Technology
Apple 200-Day Moving Average Chart Breakdown, Concerns of 2012 All Over Again
Published:
Last Updated:
Apple Inc. (NASDAQ: AAPL) is the largest company by market cap and profitability in the world. It has products that generally enthrall the consumer electronics world. And it is one of the most market-focused stocks of them all. Now it has a stock chart that may be signaling real trouble ahead.![]() Source: Courtesy of Apple Inc.
Source: Courtesy of Apple Inc.
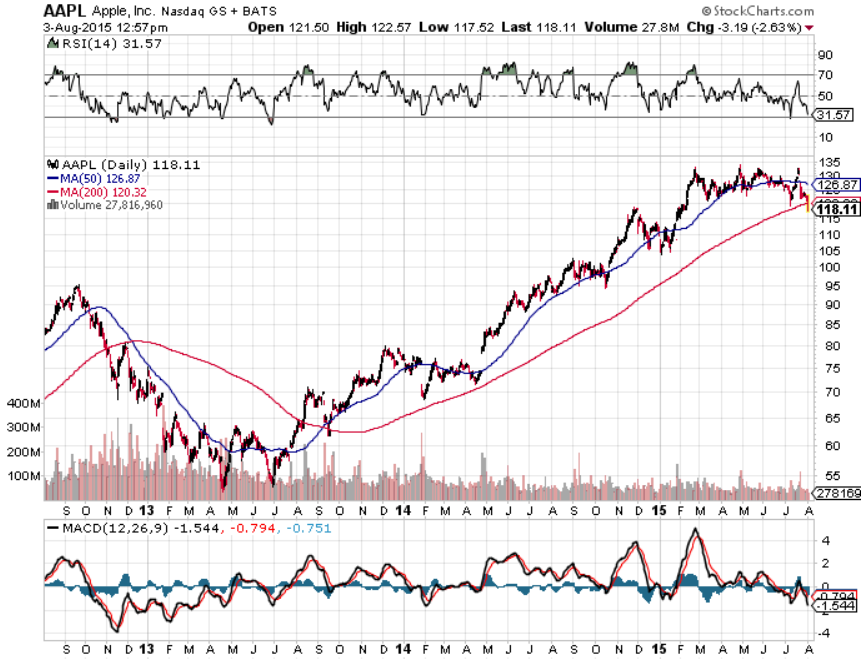
Apple shares have broken under their 200-day moving average for the first time since September of 2013. While that instance was a false test of the key 200-day moving average, the breakdown that took place under the 200-day moving average late in 2012 was after shares peaked at $95.00 (split adjusted) and shares ultimately bottomed out at the post-split equivalent price of $55 in two different waves in 2013. Apple shares recovered to $80 in late 2013, but it was not until April of 2014 that Apple went into its massive rally mode.
The question that investors will want to know now is whether this is the type of technical event that was false in September of 2013 or if it is the start of a serious slide that was seen in 2012. If it is the latter, then investor sentiment may have a serious test of solidarity again.
ALSO READ: 5 Analyst Stock Picks From July That Could Double
The chart below from StockCharts.com shows the long-term picture going back three years. Again, this is the first instance that investors have seen in quite some time. Also, do not forget that the bull market is now nearing six and a half years old.
Apple shares were last seen down more than $3.00, or 2.5%, at $118.30 in mid-afternoon trading on Monday. Apple’s 52-week trading range is $93.28 to $134.54, and the consensus analyst price target is still all the way up at $147.72.
Apple’s 200-day moving average is currently $120.32, and its 50-day moving average is up at $126.86. That 200-day average is so important because it is effectively the average closing price of almost all the trading days in the past year. Long-term chart watchers treat that as a very critical point in most cases.
Several fundamental issues have been seen in Apple of late. Some are supposed to be good for the stock, and some are mixed. One insider bought shares last week. Best Buy plans to sell the Apple Watch, if anyone cares. There is a look ahead at what is expected to be an iPhone 6 refresh (or an iPhone 7). We tracked multiple positive analyst calls at the end of July after earnings, and the earnings report may have been clouded by expectations that were too optimistic.
ALSO READ: 6 Big Stocks With Massive Upside Potential
Below is the StockCharts.com look over the past three years.
Finding a qualified financial advisor doesn’t have to be hard. SmartAsset’s free tool matches you with up to 3 fiduciary financial advisors in your area in 5 minutes. Each advisor has been vetted by SmartAsset and is held to a fiduciary standard to act in your best interests. If you’re ready to be matched with local advisors that can help you achieve your financial goals, get started now.
Thank you for reading! Have some feedback for us?
Contact the 24/7 Wall St. editorial team.