
The United States has long been the destination of immigrants either seeking opportunity or fleeing from persecution, or both. Some were brought here by force, while others came as refugees with few belongings or money. By and large, those coming to America believed it was a place that offered asylum, freedom, and opportunity.
Despite the recent rise in anti-immigration sentiment, the United States continues to attract immigrants and remains a vast melting pot.
To acknowledge what former New York City mayor David Dinkins called a “gorgeous mosaic,” 24/7 Wall St. has compiled a list of 14 states that have a higher share of foreign-born population than the national average.
Click here to see the states with the most immigrants.
Click here to read our detailed findings and methodology.

Source: mdesigner125 / Getty Images
14. Arizona
> Pct. foreign-born: 13.4%
> Pop. growth due to international immigration, 2017: 0.2%
> Naturalizations in FY 2017: 12,462
> Green cards in FY 2016: 20,694
> Origin of largest immigrant group: Mexico
The four U.S. states that border Mexico have among the highest foreign-born populations. Arizona joins Texas and California on this list (New Mexico ranks 19th). Aside from the region’s historic relationship with Hispanic culture dating back to before the independence of the U.S. and Mexico, Arizona has long attracted Mexican immigrants seeking agricultural work in the state.
Today, Mexican-born immigrants make up about 57% of all immigrants in the state, while an estimated 35% of Arizona’s immigrant population is undocumented migrants, according to the American Immigration Council. Arizona has taken a particularly hardline against illegal immigration. Some believe the reason is due to another demographic shift in the state — an influx of retirees in recent decades.
The second-biggest immigrant group in Arizona comes from America’s other neighbor, Canada. Canadians’ share of the foreign-born population in Arizona is 4.9%.
[in-text-ad]
Source: Thinkstock
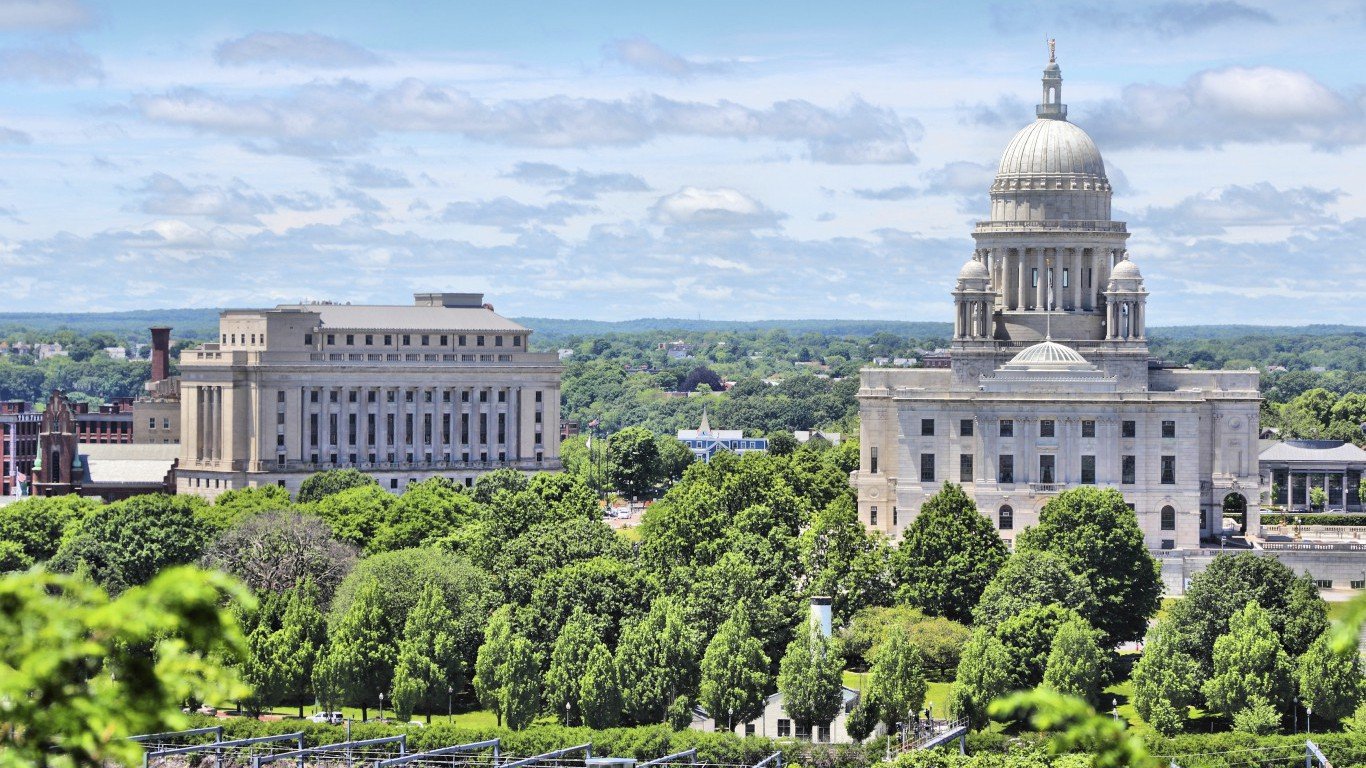
13. Rhode Island
> Pct. foreign-born: 13.5%
> Pop. growth due to international immigration, 2017: 0.5%
> Naturalizations in FY 2017: 3,415
> Green cards in FY 2016: 4,194
> Origin of largest immigrant group: Dominican Republic
The Dominican population in the United States has more than tripled since 1990 to nearly 2 million, making it the fifth-largest Latino group in the country. The Dominican diaspora has tended to favor Florida and East Coast cities. This includes Providence, Rhode Island, which in 2010, elected its first Hispanic mayor, Angel Taveras, the son of Dominican immigrants. Dominicans make up 17.4% of foreign-born immigrants in Rhode Island. Dominican immigration ramped up in the 1960s as residents fled economic and political hardships following the assassination of dictator Rafael Trujillo by rebels. Dominican immigration to the U.S. has continued to grow as residents pursued better employment opportunities and fled ongoing poor economic conditions.
The second-biggest immigrant group in Rhode Island comes from Portugal. Portuguese-born people comprise 11.5% of Rhode Island’s foreign-born population.

Source: aiisha5 / iStock
12. Washington
> Pct. foreign-born: 13.5%
> Pop. growth due to international immigration, 2017: 0.4%
> Naturalizations in FY 2017: 16,030
> Green cards in FY 2016: 27,304
> Origin of largest immigrant group: Mexico
Well before Washington became a state in 1889, Mexicans were travelling to the Pacific Northwest to work primarily as mule packers, contributing to a nascent transportation system established by the mining and fur-trapping trades. Mexican settlement in Washington picked up during World War II, when American men were sent to the front lines and American women took work in the factories, creating a need for agricultural laborers. Mexicans continued to pursue agricultural work as the state’s agricultural activity picked up in the 1950s. Today, Washington is a major year-round producer of many products, from apples to Christmas trees, which continues to fuel demand for immigrant labor. In 2014, Washington experienced the largest one-year increase in the number of Mexican immigrants of any state. Mexicans comprise 24.5% of foreign-born immigrants in Washington.
Chinese are the second-biggest immigrant group in Washington, accounting for 8.0% of the state’s foreign-born population.
Source: wellesenterprises / Getty Images
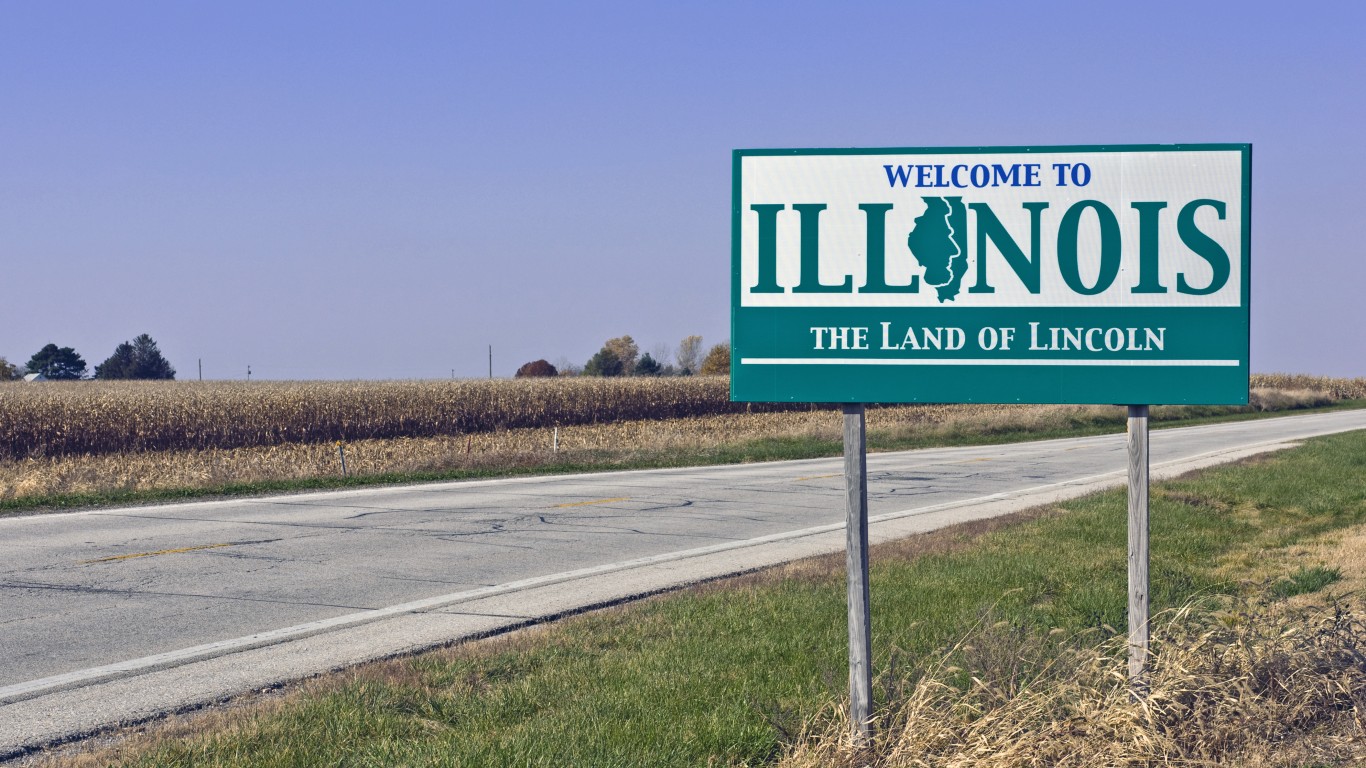
11. Illinois
> Pct. foreign-born: 13.9%
> Pop. growth due to international immigration, 2017: 0.3%
> Naturalizations in FY 2017: 24,933
> Green cards in FY 2016: 43,207
> Origin of largest immigrant group: Mexico
Anyone who visits Chicago will notice quickly that it’s one of the most Hispanic cities in the country. In 2016, Latinos – led by Mexicans – became the city’s largest minority group, surpassing the city’s sizable African American community. The Chicago metropolitan area boasts not only the second largest concentration of Mexican-born immigrants in U.S. cities, after the Los Angeles area, but also it’s one of only two urban zones among the 10 cities with the highest share of Mexican immigrants located in a state that doesn’t border Mexico.
This influx of Mexican immigrants to the Windy City area, which started around 1910 as Mexicans fled a civil war in their country to toil mostly in the Chicago area’s meat-packing plants. As Mexican immigrants integrate, many move out of Chicago to the state’s smaller communities. Today, more Illinois residents of Hispanic descent, mostly Mexican-Americans, live outside of Chicago. Mexicans account for 37.7% of foreign-born immigrants in Illinois.
The second-largest immigrant group in Illinois consists of immigrants from India, who make up 8.2% of the foreign-born population.
[in-text-ad-2]
Source: Thinkstock
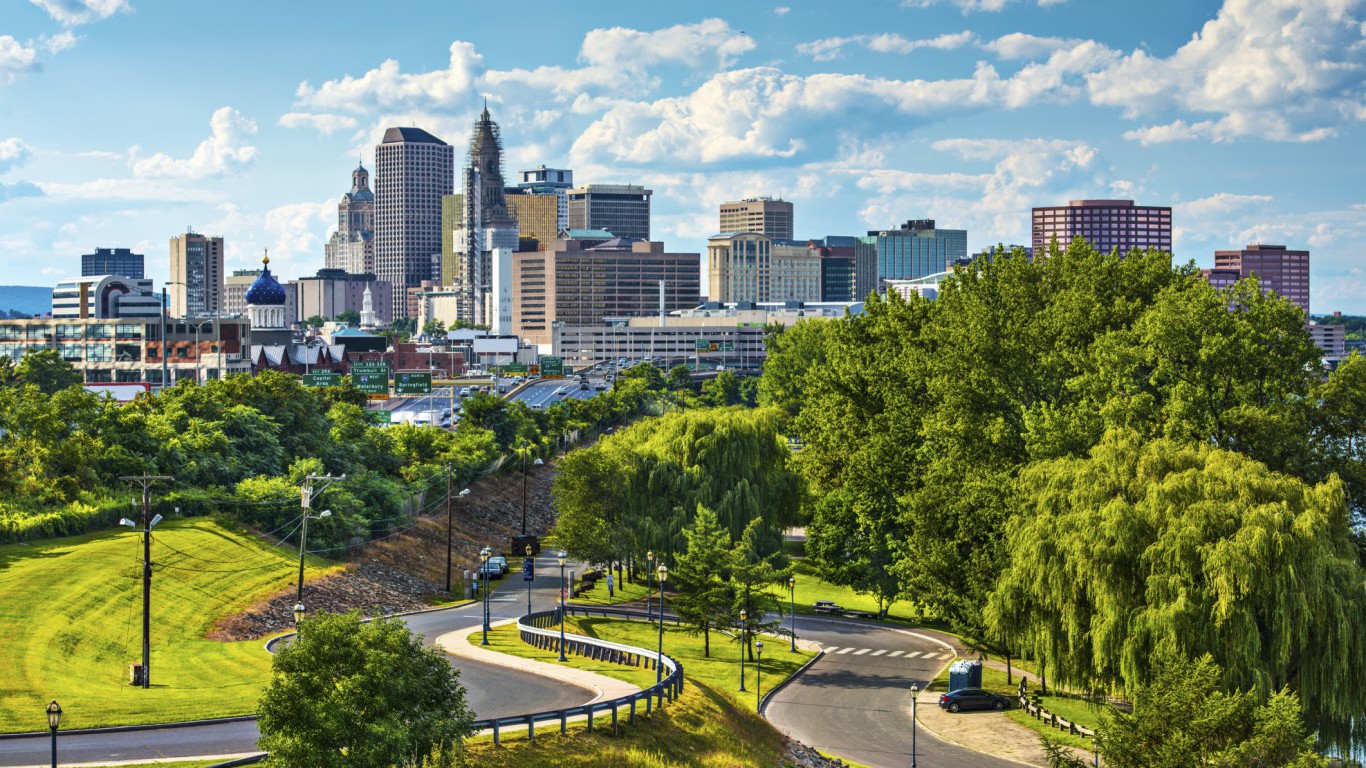
10. Connecticut
> Pct. foreign-born: 14.0%
> Pop. growth due to international immigration, 2017: 0.5%
> Naturalizations in FY 2017: 7,441
> Green cards in FY 2016: 12,669
> Origin of largest immigrant group: India
Mexico is the country of origin of most foreign-born immigrants in many U.S. states, but not Connecticut. The New England state has attracted more immigrants from India than from America’s southern neighbor. Though it’s not entirely clear why certain immigrant groups originally gravitate to certain regions of the U.S., data shows immigrants increasingly are settling in the suburbs. This is especially true of immigrants from Asian countries, who make up the fastest-growing immigrant group. Connecticut is experiencing a demographic shift in the immigrant population, especially outside of New Haven, East Haven, and West Haven, where immigrants from Asia – mainly China and India – are settling in increasing numbers.
Jamaicans are the second largest foreign-born group in Connecticut, comprising 6.9% of foreign-born residents.
Source: Thinkstock
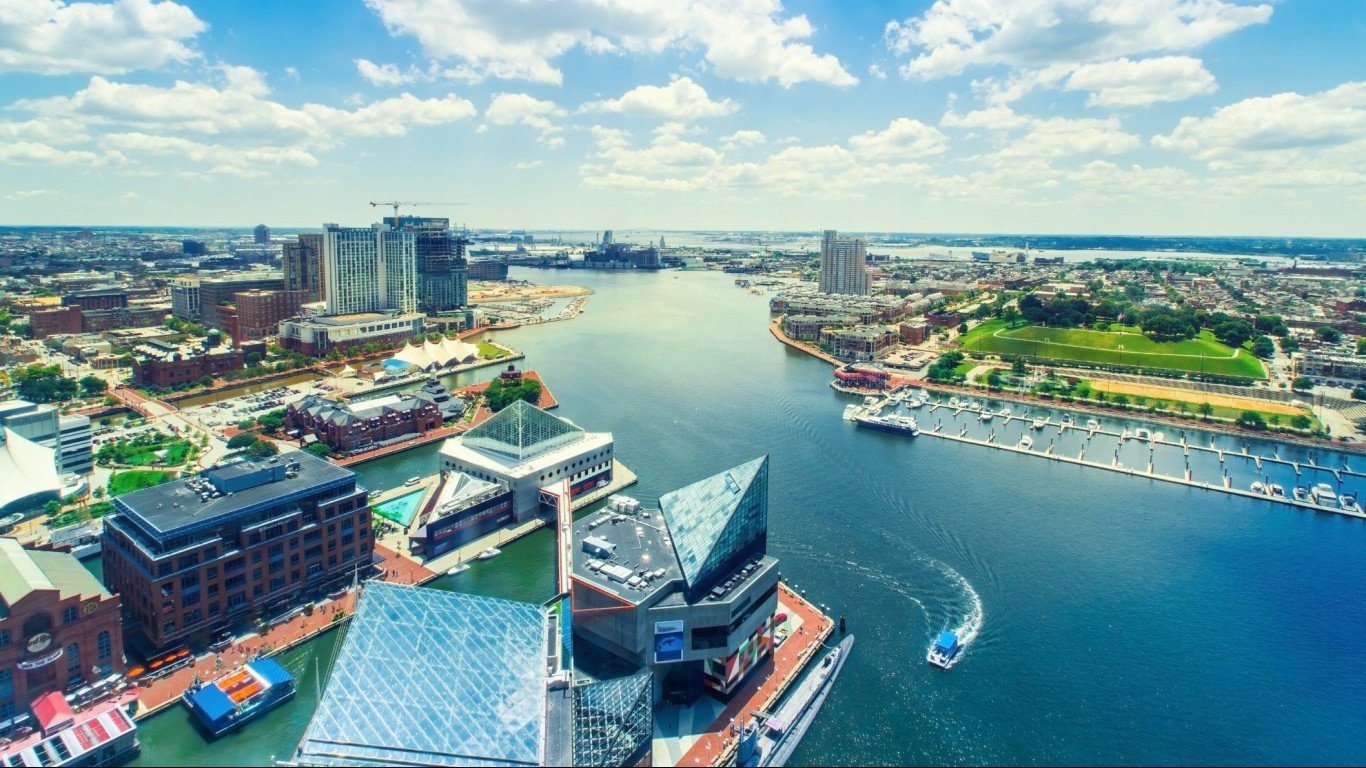
9. Maryland
> Pct. foreign-born: 14.7%
> Pop. growth due to international immigration, 2017: 0.5%
> Naturalizations in FY 2017: 17,729
> Green cards in FY 2016: 26,077
> Origin of largest immigrant group: El Salvador
For decades, the Washington D.C. area has been a magnet for Salvadoran immigrants. Today, in neighboring Maryland, immigrants from the tiny Central American country considerably outnumber immigrants from other Latin American countries like Mexico, Guatemala, and the Dominican Republic. With a civil war in El Salvador in the 1970s, and continued violence in the following decade, hundreds of thousands of Salvadorans fled to the United States. Like other immigrants, they tended to go to urban centers where previous immigrants from their origin country had already established footholds. In Maryland, Salvadorans account for 12.2% of the foreign-born population. Los Angeles and the nation’s capital were early gateway cities for Salvadoran immigrants. More immigrants came to these already sizable Salvadoran communities following recent natural disasters, including hurricanes and earthquakes.
Immigrants from India comprise 6.7% of the foreign-born population in Maryland, the second-largest community.
[in-text-ad]
Source: Sean Pavone / Getty Images
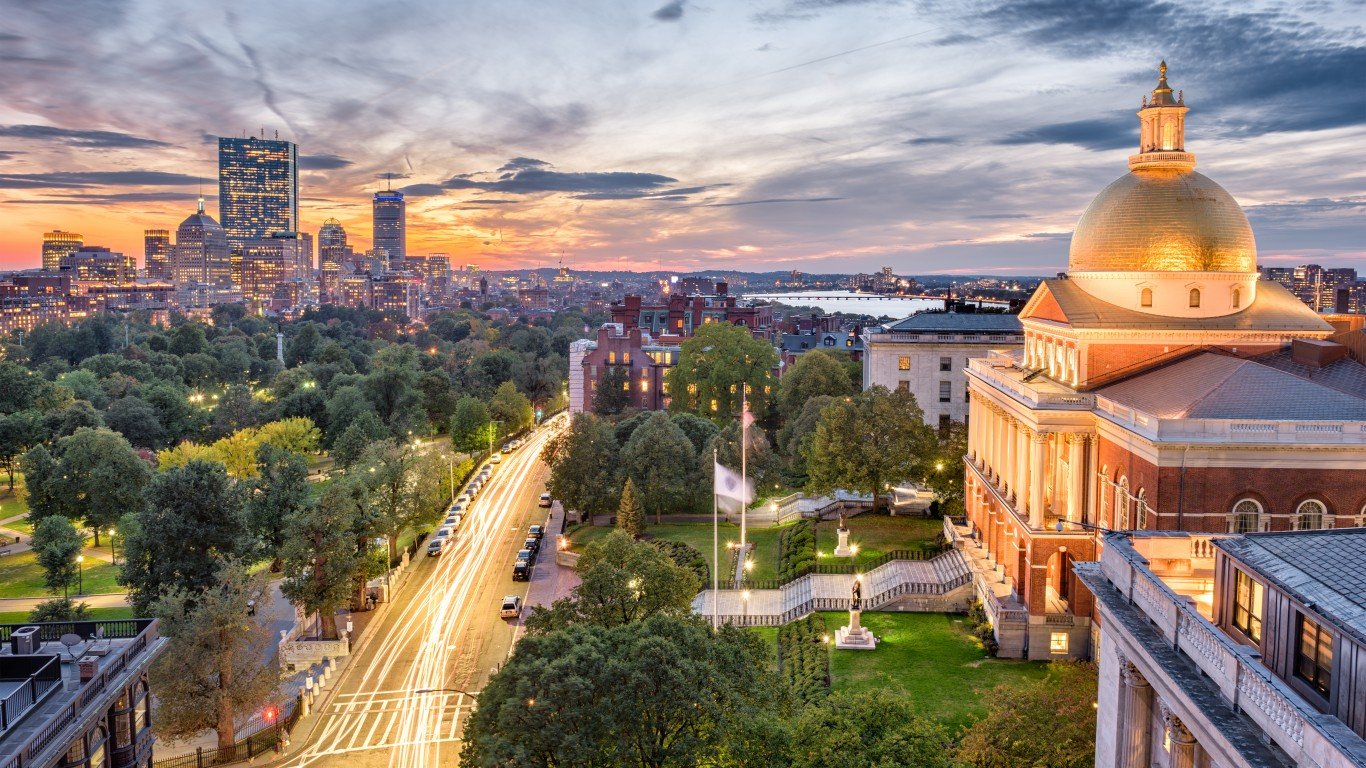
8. Massachusetts
> Pct. foreign-born: 15.7%
> Pop. growth due to international immigration, 2017: 0.7%
> Naturalizations in FY 2017: 27,739
> Green cards in FY 2016: 35,706
> Origin of largest immigrant group: China
Like Illinois, immigrants to Massachusetts have tended to gravitate to the state’s largest city, in this case Boston. For much of pre-World War II history, the Chinese settled mostly in the West, working under brutal conditions as railroad construction workers or local merchants. This influx created deep resentment with European settlers. During this period, Chinese began heading east, where anti-Chinese sentiment was less pronounced, and they began establishing what would become Chinatowns in many urban areas, including Boston. That city’s robust industrial base, and its relationship with China from the tea and silk trades, made it an appealing destination for Chinese immigrants. Today’s robust Chinese-born population in the state is attributed to Boston’s many higher-education institutions, the introduction of the H-1B skilled-worker visa in 1990, and the expansion of that visa program in 1998 and 2000. Chinese account for 9.4% of the foreign-born population in Massachusetts.
Immigrants from the Dominican Republic are the second-largest foreign-born group, comprising 7.6% of the foreign-born population in Massachusetts.
 24/7 Wall St.
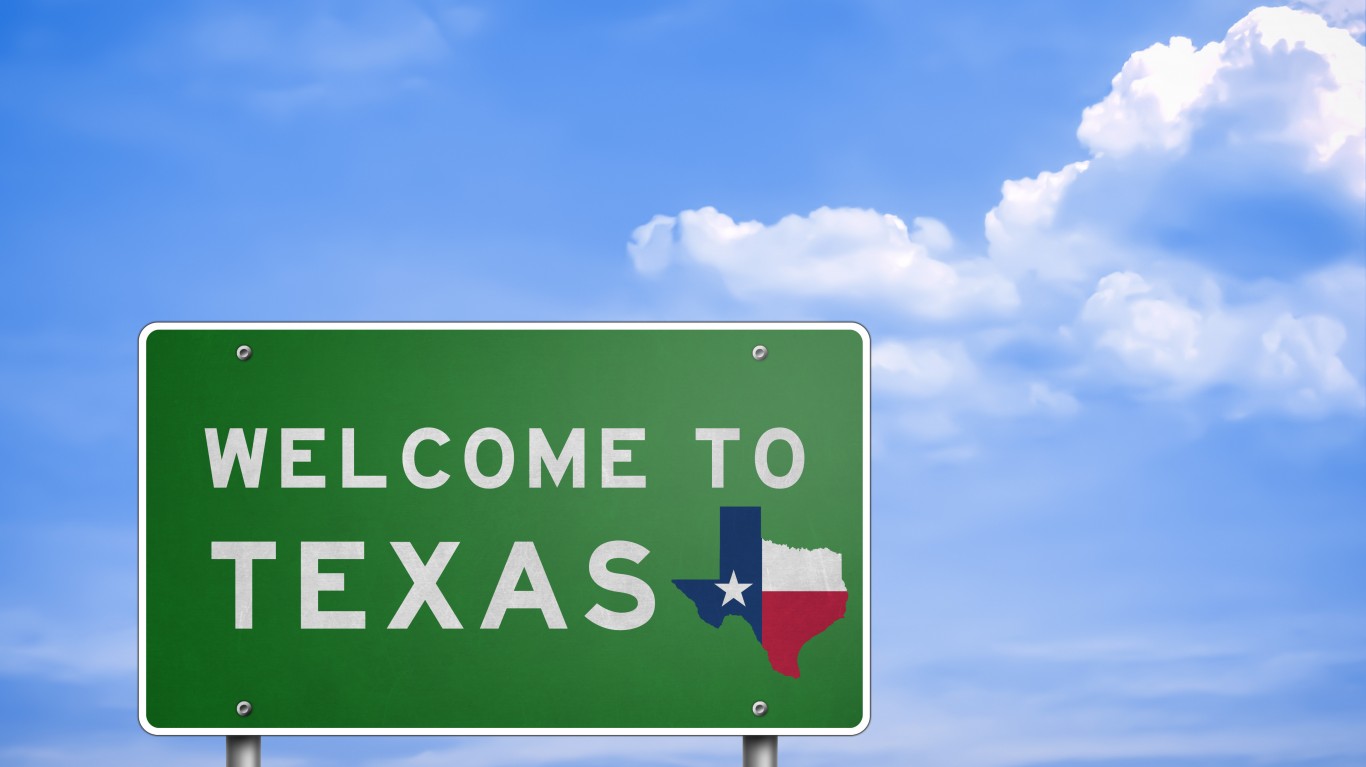
Source: gguy44 / Getty Images
7. Texas
> Pct. foreign-born: 16.7%
> Pop. growth due to international immigration, 2017: 0.4%
> Naturalizations in FY 2017: 50,552
> Green cards in FY 2016: 110,651
> Origin of largest immigrant group: Mexico
The Lone Star State is one of four U.S. states bordering Mexico on this list. The cultural ties between Texas and Mexico predate their independence and establishments. In the 19th century, Mexican migration to the country’s northernmost boundaries amounted to a trickle and was far outnumbered by Anglo-Americans migrants to the west. This led to the U.S. annexation of territory that today makes up significant parts of California, Arizona, New Mexico and Texas. Mexican immigration into Texas and other border states began in earnest during and after the Mexican Revolution of 1910-1920. As of 2015, more than half of the state’s foreign-born population of 4.7 million consisted of Mexicans, and an additional 4.1 million U.S.-born Texans have at least one immigrant parent. Citing official state data, a 2014 report by political opinion research firm Latino Decisions predicts the state’s Hispanic population will edge past the white population by 2020, and it will become a solid majority by 2040.
Indians are the second-biggest immigrant group in Texas, accounting for 4.8% of the foreign-born population.

Source: ademyan / Getty Images
6. Hawaii
> Pct. foreign-born: 17.9%
> Pop. growth due to international immigration, 2017: 0.5%
> Naturalizations in FY 2017: 3,491
> Green cards in FY 2016: 6,285
> Origin of largest immigrant group: Philippines
Because of its location, Hawaii is the only U.S. state whose foreign-born population comprises primarily of immigrants from Asian. Among them, immigrants from the Philippines make up nearly half of all foreign-born residents. Hawaii’s Philippine community dates back to the early years of the 20th century, when the state’s sugar growers began recruiting plantation workers from the country because of laws restricting the immigration of Chinese laborers. The annexation of the Philippines by the United States in 1898 also helped make the country an ideal source of plantation labor. Because of its century-long relationship with Filipino immigrants Hawaii continues to be a prime destination. Today, 46% of Hawaii’s foreign-born residents are Filipinos. This Asian migration is also heavily represented in the U.S. Pacific territories of the Northern Marianas Islands, Guam, and American Samoa.
Chinese are the second-biggest immigrant group in Hawaii, accounting for 9.7% of the state’s foreign-born population.
[in-text-ad-2]

Source: gsalermo / Getty Images
5. Nevada
> Pct. foreign-born: 19.3%
> Pop. growth due to international immigration, 2017: 0.3%
> Naturalizations in FY 2017: 7,438
> Green cards in FY 2016: 11,555
> Origin of largest immigrant group: Mexico
Nevada has the highest proportion of undocumented immigrants in the country, according to a recent Pew Research Center study. Nevada is no stranger to ethnic diversity. Already in 1870 it had the highest percentage of foreign-born people, nearly three times the national average at the time, according to the U.S. Census that year. The Comstock Lode discovery of silver and gold ore a few years earlier attracted prospectors form across the globe. The construction of the Hoover Dam starting in 1931 and the exploding growth of Las Vegas after World War II attracted new waves of migrant workers, many of whom traveled northward from Mexico. Today, Mexicans make up 41.2% of all foreign-born immigrants, working largely in hospitality, retail, and construction.
Filipinos are the second-biggest immigrant group, with a 14.6% share of the foreign-born population.

Source: marchello74 / Getty Images
4. Florida
> Pct. foreign-born: 19.9%
> Pop. growth due to international immigration, 2017: 0.7%
> Naturalizations in FY 2017: 69,485
> Green cards in FY 2016: 136,337
> Origin of largest immigrant group: Cuba
Just as Hawaii’s relative proximity to Asia has made it an ideal destination for immigration from the continent to the U.S., Florida’s relative proximity to the Caribbean region and Latin America has made it a gateway for immigrants from those areas. Perhaps unsurprisingly, Cubans make up the largest foreign-born population in the state, at 23.1% — Florida is just 90 miles from Cuba. The state also is home to significant populations of people born in Haiti, Jamaica, Colombia, and Mexico. In 2016, 2.5 million native-born Floridians (nearly 13% of the state’s population), claimed at least one foreign-born parent.
Haitians are the second-biggest foreign-born group in Florida, with a 7.7% share of the immigrant population.
[in-text-ad]
Source: SeanPavonePhoto / Getty Images
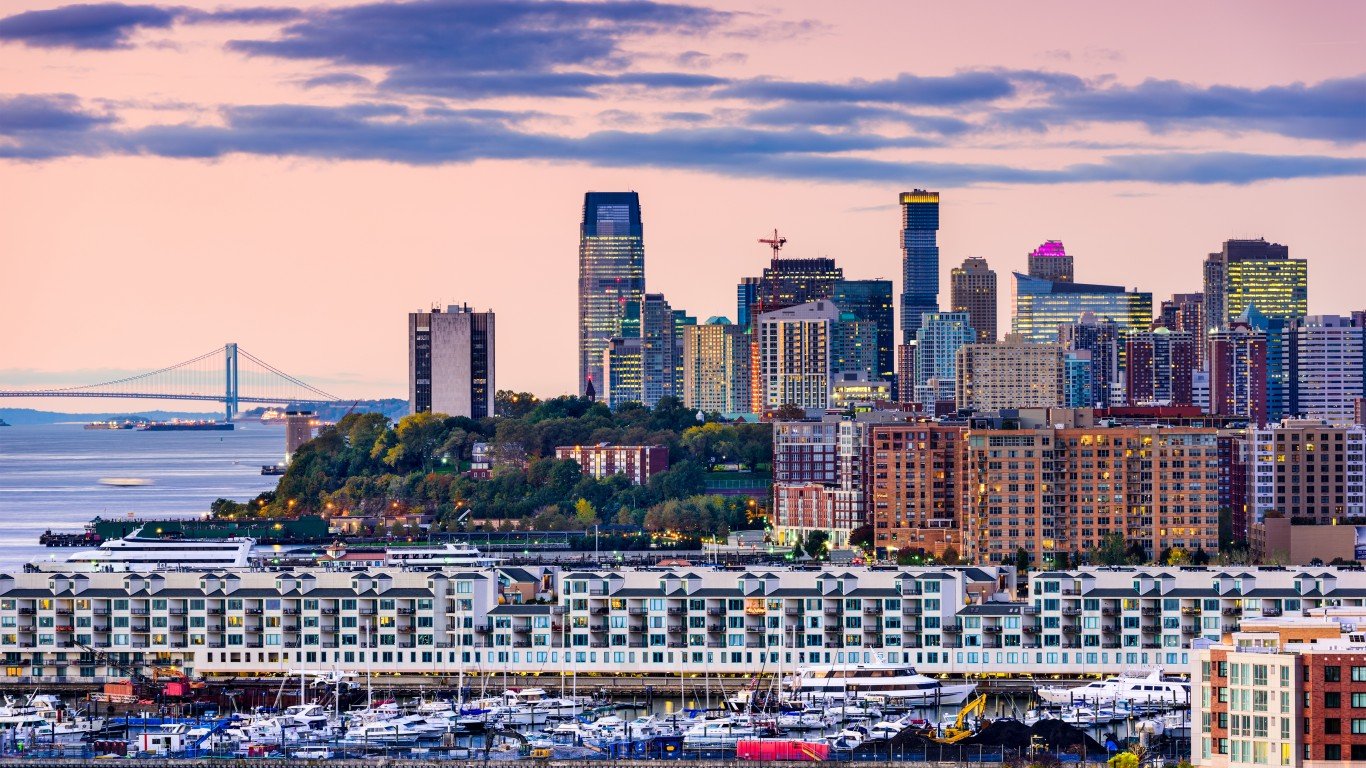
3. New Jersey
> Pct. foreign-born: 21.8%
> Pop. growth due to international immigration, 2017: 0.6%
> Naturalizations in FY 2017: 38,611
> Green cards in FY 2016: 56,187
> Origin of largest immigrant group: India
Along with Connecticut, New Jersey is the other state on this list where immigrants from India make up the largest foreign-born state population, at 12.4%. Indian migration to New Jersey ramped up after U.S. immigration laws were changed in 1965. That opened the way for Indians, many of them doctors, engineers, and other professionals who began establishing footholds in the traditional gateway city of New York. Then, Indians began relocating across the Hudson River in pursuit of lower-cost housing and better schools. Today, in towns like Edison, Iselin, North Bergen and Jersey City many local businesses are owned by immigrants from India. The introduction of the H-1B visa for foreign professionals in the ’90s, as well as the large pharmaceutical industry in the state, fueled more immigration from the Asian country, particularly of those with advanced degrees.
The second-largest foreign-born group in New Jersey is immigrants from the Dominican Republic, at 7.7%.
Source: spyarm / Getty Images
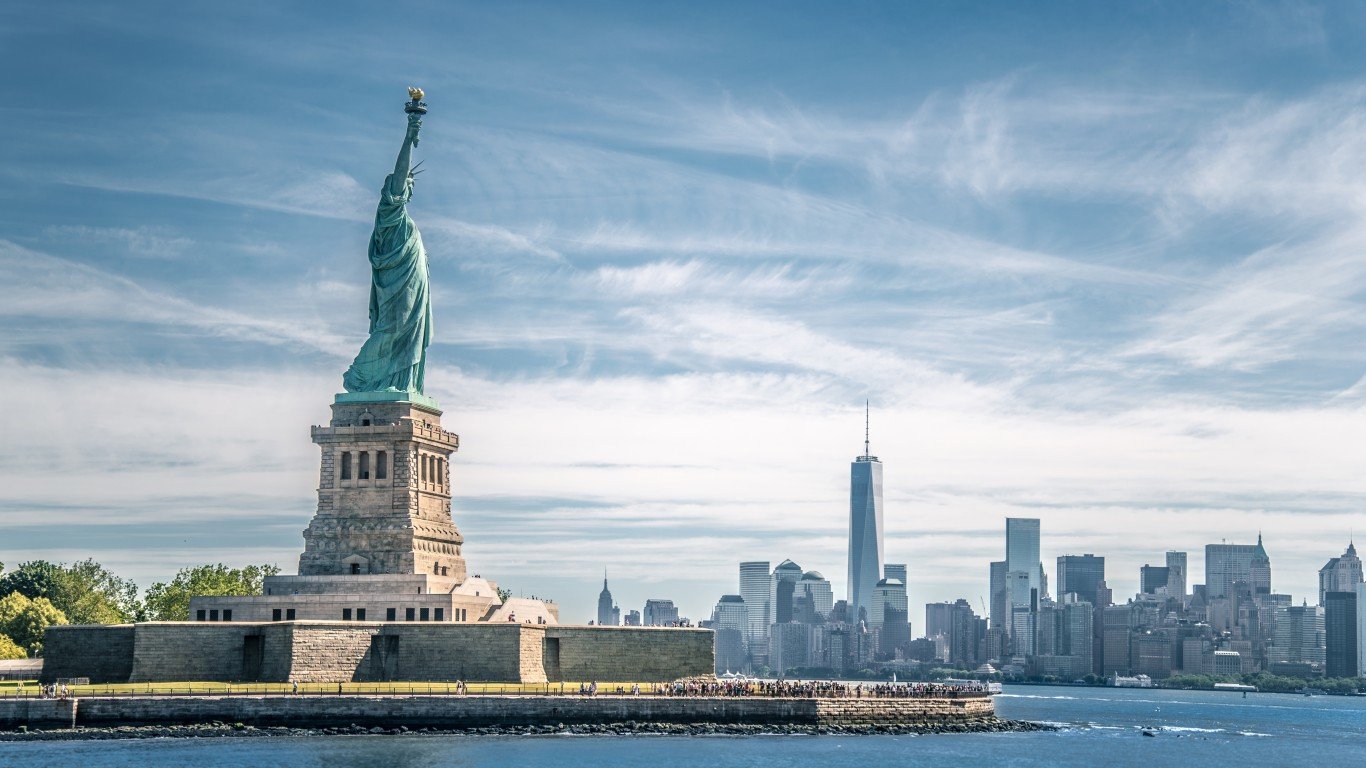
2. New York
> Pct. foreign-born: 22.6%
> Pop. growth due to international immigration, 2017: 0.7%
> Naturalizations in FY 2017: 86,407
> Green cards in FY 2016: 159,878
> Origin of largest immigrant group: Dominican Republic
Since the 1950s, Puerto Ricans were the dominant Hispanic presence in New York City. In 2013, however, the U.S. Census Bureau’s American Community Survey found that Dominicans had overtaken Puerto Ricans as the city’s largest Hispanic group. Immigration from the Dominican Republic was spurred by political unrest in the country in the mid-1960s, followed by decades of economic hardship. The rise of Dominicans in the city led to slight rivalry between the two groups, with some Puerto Ricans viewing themselves as the city’s Hispanic standard bearer and pioneers who suffered anti-Hispanic sentiment and discrimination. Today, with a more diverse Hispanic community in New York City and state – Mexicans and Ecuadorians are the third and fifth largest foreign born populations in New York – these rivalries have largely abated. Dominican immigrants have gained more local political representation and economic power in recent years.
Dominicans account for 10.8% of New York’s foreign-born population, slightly ahead of immigrants from China, who comprise 10.2% of the immigrant population.
Source: Thinkstock
1. California
> Pct. foreign-born: 27.0%
> Pop. growth due to international immigration, 2017: 0.4%
> Naturalizations in FY 2017: 157,364
> Green cards in FY 2016: 223,141
> Origin of largest immigrant group: Mexico
The largest economy in the country, California is not only home to one in eight Americans and the largest share of foreign-born residents, but it’s also home to the most immigrants from Mexico. Four out of every 10 foreign-born immigrants in the Golden State come from Mexico. Additionally, nearly a quarter of the state’s entire population claim at least one foreign-born parent, mostly from Mexico, followed by the Philippines, China, Vietnam, and India. Historically, many of the state’s first Mexicans didn’t immigrate; they were absorbed into the nation’s cultural fabric when the U.S. annexed huge portions of the West from Mexico in the 19th century. Like other U.S. southern border states, California’s agricultural industry attracted immigrants from Mexico in the 20th century — a demand that escalated during World War II due to manpower issues as a result of the war. California’s rich Hispanic history continues to make it an ideal destination for Mexicans seeking better job opportunities and fleeing poverty, political corruption, and gang violence south of the border.
Chinese make up the second-biggest foreign-born cohort in California at 8.1%.
Detailed Findings
The states with the highest share of immigrants are led by California (27%) and New York (22.6%). By comparison, in 19 states the share of the foreign-born population is less than 5%. Montana (2%) and West Virginia (1.6%) are at the bottom.
About 13% of the country’s population was born abroad, and many more have at least one foreign-born parent.
With the exception of Pennsylvania and Ohio, the states with the largest populations – California, Texas, New York, Florida, and Illinois – are also home to the highest percentage of foreign-born people.
Mexican-born immigrants are the largest immigrant group by percentage in six of the 14 states with the biggest immigrant populations. Dominicans have recently overtaken Puerto Ricans as New York City’s largest Hispanic group. Chinese have been particularly attracted to Massachusetts, and Indians have leaned toward New Jersey. Hawaii’s largest foreign-born population is people from the Philippines.
Methodology
To determine the states with the largest share of immigrant population immigrants, 24/7 Wall St. ranked states based on the share of the population that was born outside of the United States with data from the U.S. Census Bureau’s American Community Survey for the period 2011 to 2016. Data on population change due to net international migration also came from the Census Bureau. Data on naturalizations and green cards by origin country and fiscal year came from the Department of Homeland Security’s Yearbook of Immigration Statistics 2017.
Sponsored: Find a Qualified Financial Advisor
Finding a qualified financial advisor doesn’t have to be hard. SmartAsset’s free tool matches you with up to 3 fiduciary financial advisors in your area in 5 minutes. Each advisor has been vetted by SmartAsset and is held to a fiduciary standard to act in your best interests. If you’re ready to be matched with local advisors that can help you achieve your financial goals, get started now.
Thank you for reading! Have some feedback for us?
Contact the 24/7 Wall St. editorial team.
Editors' Picks

