Gold Miner Breakout, Hecla Can Still Double
February 15, 2014 by Jon C. Ogg
This is helping to boost Hecla Mining Co. (NYSE: HL). 24/7 Wall St. recently named nine stocks that could double in 2014, and Hecla was one of those nine stocks. Hecla is trying to turnaround after a series of unfortunate events. To highlight just how bad this was, Hecla’s stock price started imploding before it became the norm for gold and silver miners to begin imploding. Yet its chart is at a critical inflection point.
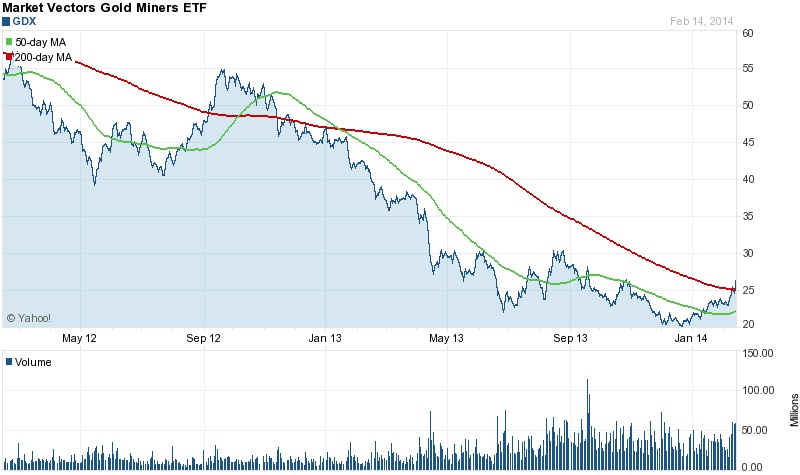
The Market Vectors Gold Miners ETF (NYSEArca: GDX) is signaling a major breakout in the chart pattern here. It gets complicated when you think of gold still being poorly thought of by so many investors. Yet here we are. Technicians, the so-called chart readers, will be observing that the gold mining stocks ETF has now broken above the key 200-day moving average for the first time in almost a year and a half.
If you read the Yahoo! Finance charts below, something else should stand out that makes this chart breakout different than the one in the second half of 2012. The GDX ETF went from about $49 to a peak of $55 on that run. This breakout forming at this time is taking place when the ETF’s share price is down closer to $26.
Chart readers are an interesting lot. They claim not to care about the news at all. They simply use charts to tell them whether they should be buying or selling. We would warn readers that chart patterns are simply used as guides, and that the same thing holds true with fundamental analysis. There are no guarantees, and there are always the same number of excuses when the chart patterns do not materialize the way they were expected to.
One last word of warning is that gold itself has only just on Friday challenged its key 200-day moving average. The mining stocks appear to be anticipating this breakout. Gold bears will almost certainly try to challenge gold bugs over a returning bull market in gold. That is just the way things go.
So, why is this breakout happening? Is it a new risk-on trade again? Is emerging market currency risk too much? Is India really going to be back as a gold buyer with lower restrictions? Is the experimental Bitcoin crash ($1,000 to $362 in less than a month) proving that virtual currencies are garbage? The answer is likely yes, at least in part, on all of these, but pure chart watchers could care less what the reasoning is.
And back to the case of Hecla. Its 2011 revenue of $477 million fell to $321 million in 2012. Accidents and closures at its unlucky “Lucky Friday” mine crushed Hecla. Sales have recovered now that its mining operations are back online, and they are expected to grow by another 33% in 2014 to $534 million. That means Hecla could be larger again than it was before the implosion took place. Its gold and silver production were up strongly last year, and Hecla also reported it still has $212 million in cash.
Hecla remains an early turnaround story. The reason we considered it as a candidate that could see its stock double is not just because of a gold recovery. This assumption was based upon no-change in gold, but was also based on no continued gold cratering. If the market decides that gold needs to trade down to $800 then that will almost certainly drag Hecla, and almost every other miner, down with it.
Hecla was a $10 stock at the start of 2011. It has been a troubled stock ever since. This gold miner breakout may make our call for Hecla to possibly double from $3.12 at the time come much easier and faster than our original assumptions. Hecla’s current share price is $3.47, but it has also challenged $3.00 since the call to possibly double.
Charts on the Market Vectors Gold Miners ETF and on Hecla are provided below. Both are from Yahoo! Finance and show the two-year trading patterns. Also shown are the 50-day and 200-day moving averages.
Sponsored: Find a Qualified Financial Advisor
Finding a qualified financial advisor doesn’t have to be hard. SmartAsset’s free tool matches you with up to 3 fiduciary financial advisors in your area in 5 minutes. Each advisor has been vetted by SmartAsset and is held to a fiduciary standard to act in your best interests. If you’re ready to be matched with local advisors that can help you achieve your financial goals, get started now.