Companies and Brands
Full 360-Degree Preview of Amazon.com Earnings (AMZN, BBY, AAPL, NFLX)
Published:
Last Updated:
 Amazon.com Inc. (NASDAQ: AMZN) is set to report earnings after the close of trading on Tuesday. What makes Amazon so different from many peers in technology, internet and virtual companies is that it is only recently off of its highs and not really by that much. Even after a 2.5% drop so far on Tuesday, the $231.50 area compares to a closing price yesterday of $237.61 and to a 52-week range of $156.77 to $246.71.
Here are the targets. Amazon.com continues to be a thorn in the side of Best Buy Co. Inc. (NYSE: BBY) for consumer electronics. The big question is whether or not it can take away iPad sales from Apple Inc. (NASDAQ: AAPL) with the new souped up Kindle models and whether or not it can suddenly challenge NetFlix, Inc. (NASDAQ: NFLX) now that Reed Hastings seems to be messing up on every turn.
Thomson Reuters has estimates for its third quarter of $0.24 EPS and $10.93 billion in sales. For the current fourth quarter we are already in, those estimates are $0.86 EPS and $18.05 billion in revenues. Keep in mind that the fourth quarter is “the money quarter” as it includes Christmas and the holiday season sales and the estimates compare to the readings a year ago of $0.91 EPS and $12.95 billion in sales.
What is amazing is that Amazon.com still trades at more than 100-times expected 2011 earnings. The company has rapidly been building its cloud efforts and building its infrastructure. This has all come at the expense of margins, and trying to factor in the new Kindle sales will be no easy task.
If you just use the weekly options, then it looks as though options traders are braced for a move of up to about $9.50 to $11 in either direction. If we use the monthly expiration November options, then it seems that options traders are braced for a move of $14.00 or more in either direction.
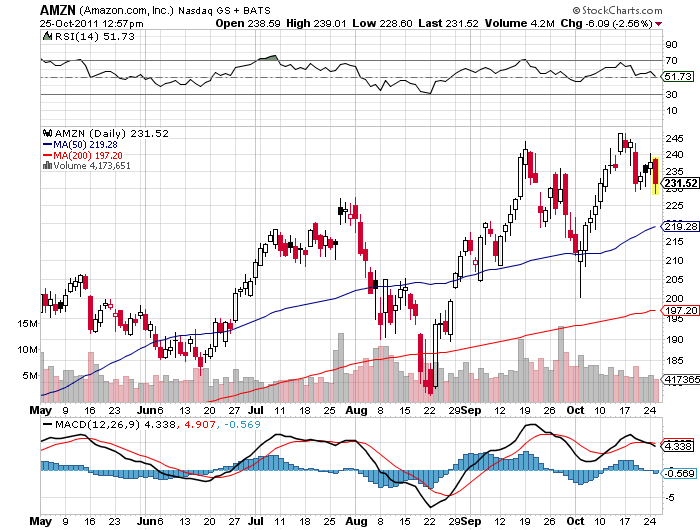
You can take a look at the chart from stockcharts.com below if you want. The stock is looking tired, but honestly we would have said the exact same thing a month ago right before we saw a false-breakdown of the chart. We would point that the 50-day moving average was tested and held for the most part a month ago. That 50-day moving average is now down at $219.28 and the 200-day moving average is $197.20.
The analyst community has a consensus price target just above $243.50. At some point, Wall Street is going to demand higher margins. When that is can be anyone’s guess. We stopped trying to harp on it because no one seems to care.
JON C. OGG

Take the quiz below to get matched with a financial advisor today.
Each advisor has been vetted by SmartAsset and is held to a fiduciary standard to act in your best interests.
Here’s how it works:
1. Answer SmartAsset advisor match quiz
2. Review your pre-screened matches at your leisure. Check out the
advisors’ profiles.
3. Speak with advisors at no cost to you. Have an introductory call on the phone or introduction in person and choose whom to work with in the future
Take the retirement quiz right here.
Thank you for reading! Have some feedback for us?
Contact the 24/7 Wall St. editorial team.