Economy
75th Anniversary of Pearl Harbor: 13 Stats Then vs Now
Published:
Last Updated:
A day that will live in infamy was now 75 years ago. The Japanese attack on Pearl Harbor launched the United States into World War II, with a formal war declaration the following day. The reality is that the world order has never been the same since that time.
24/7 Wall St. wanted to evaluate some basic statistics from Pearl Harbor and for the United States from the war years of 1941 to 1945 versus modern times. Other statistics about society and war have been compiled as well, and they have been given a comparison to modern day figures if possible.
Much of this will have a U.S.-centric focus, and the reality is that statistics and references like this could almost go on endlessly. There is also no way to express the horror and trauma of World War II. Hopefully this may even act as yet one more reminder about why a World War III would be merely too costly and painful when considering the raw figures here on the more serious topics.
Figures have been tallied up regarding population, deaths, economics and other topics. No specific order has been assigned to these figures. There is some frustration among the statistics of World War II itself and of the outside sources where numbers have changed through time. The National World War II Museum admits on its own site:
Statistics are notoriously tricky things. The more you try to find exact numbers, the more they change. Different sources will report different numbers. Different sources may use different definitions for the same subjects. Some numbers come from well-kept government records; others are best estimates based on a variety of reports and sources.
Here are 13 broad or pointed issues that aim to capture some topics from Pearl Harbor, World War II as a whole, economic and social issues, and how some of them compare to today.
1. United States Versus Japan (and World) in Total Population Base
Data was taken from the Census of each nation, noting that the United States makes its Census estimates annually and Japan’s formal count is each five years. The world population is from the ECOLOGY Global Network for 1940 and the Census estimate was live for December 6, 2016. These were shown as follows:
2. Deaths from Pearl Harbor versus 9/11 Terror Attacks
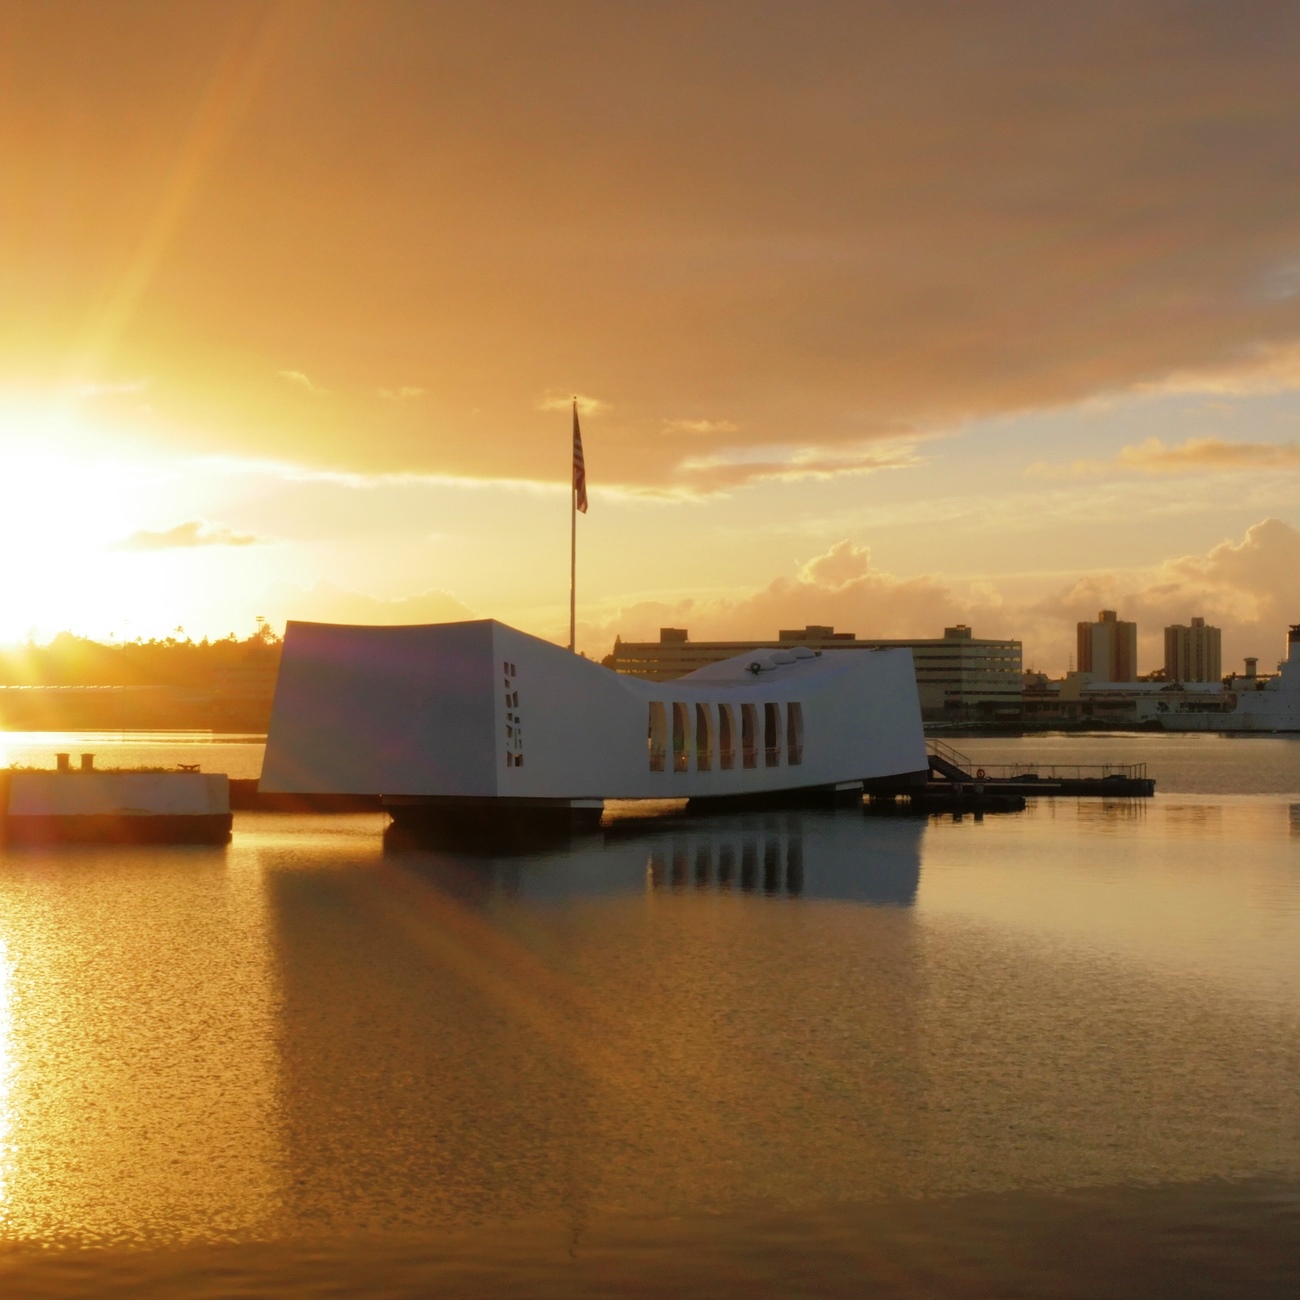
The morning attack on Pearl Harbor has been the subject of many movies, books and even conspiracies. More than 2,400 people in total died, some 2,335 of which were military personnel and over half from the USS Arizona alone. According to the Pearl Harbor Visitors Bureau:
CNN’s 9/11 anniversary fast facts showed that a total of 2,977 people were killed, when deaths in New York City and in Washington, D.C., were added to those who died in the plane crash outside of Shanksville, Pennsylvania. Some 2,753 of those people were at the World Trade Center site.
3. The Death Toll of World War II
Of the 16.11 million total U.S. service members who served in World War II, the VA (May 2016) showed that there were 291,557 battle deaths and 113,842 other deaths in service (non-theater). As of May 2016, there were also just 696,000 living World War II veterans.
The National World War II Museum website shows the following number of deaths from World War II:
4. U.S. Gross Domestic Product (Gross National Product)
There have been many changes in how the United States measures its economy. Prior to the 1990s, it was gross national product (GNP), and then it became gross domestic product (GDP). The U.S. was a manufacturing and goods-producing economy before, during and after World War II. That has changed through time, and now roughly two-thirds of GDP is based on and around consumer spending.
According to the Bureau of Economic Analysis, GDP in 1941 was $126.7 billion. That did not hit $1 trillion until 1970. That was $15 trillion nominal by 2011, and the World Bank figure for 2015 was more than $17.9 trillion.
5. Dow Jones Industrial Average, Then Versus Now
Prior to World War II’s outbreak in Europe, the United States had suffered through the Great Depression. That wrecked the value of stocks and asset prices for more than a decade. The Dow was valued at only about 100 in the week after the December attack in Pearl Harbor. By December of 2015, the Dow had surpassed the 19,000 hurdle. After the attack on Pearl Harbor in 1941, stock prices fell by about 5% (CRS Report for Congress) and had already discounted much of the U.S. entrance into World War II.
While the Dow Jones Industrial Average has undergone many changes over the years, there are now just a handful of companies in the index today that were there during World War II. Those include DuPont, General Electric and Procter & Gamble. Many other companies have since come in and gone from the Dow, some via mergers, but some have since ceased to exist entirely.
6. The Direct Financial Cost of World War II
The State Department’s tally from 2008 showed the direct costs as $296 billion spent from 1941 to 1945. That was put at $4.114 trillion in 2008-equivalent dollars. Estimates of the costs are for military operation expenses only. They do not count the costs of veterans benefits, interest paid on war financing nor assistance to allies.
That figure would be even higher today, with a Census CPI inflation calculator showing that $1.00 in 2008 has the same buying power as $1.12 in 2016.
7. Equipment Destroyed During Pearl Harbor Attack
According to the National World War II Museum, the attack on Pearl Harbor and its nearby airfields in Hawaii resulted in the sinking or destruction of 18 ships (five of which were battleships). Some ships were destroyed entirely, while most ships rejoined fleets between 1942 and 1944. Also, nearly 350 planes were destroyed or damaged.
Of the Japanese ships noted on the National World War II Museum site, only one of the 22 total Japanese ships at Pearl Harbor was not sunk by the end of the war.
8. U.S. Military Production Totals (All of World War II)
If you want to know what major warfare looks like, the numbers of production were massive for weapons of war. According to the World War II National Museum site, the United States made 12.5 million rifles and carbines and 41 billion rounds of ammunition.
The United States made some 310,000 in total aircraft (all types), versus over 76,000 from Japan from 1939 to 1945. Total U.S. tank production of all types was almost 61,000, versus not even 2,500 from Japan.
9. Welcome to the Nuclear Age
The United States brought in the nuclear age shortly before the end of World War II. The cities Hiroshima and Nagasaki were bombed, and the years after World War II brought on a nuclear arms race.
As of 2016, there are nine nations with nuclear weapons. The global security foundation called Ploughshares Fund showed that the world still has a total arsenal of 15,375 nuclear weapons, with some 93% being owned by the U.S. and Russia. They also represent that even this massive number of nukes is down by over two-thirds since peaking in the 1980s.
10. Jewish Victims of the Holocaust
Considering World War II without the Holocaust is just not possible. According to the United States Holocaust Memorial Museum, up to 6 million Jews were killed, in their estimates. There is no official figure for this due to a lack of centralized numbers and due to destroyed documents, and some estimates elsewhere are higher versus lower at other sources.
The total population of Israel (CIA World Factbook July 2016 estimate) was last seen at 8.174 million. That includes the 25.2% of the population who are counted as non-Jewish and mostly Arab.
11. Statistics of Japanese in America, Then Versus Now
Records sourced by the History Channel from the Census show that 127,000 people of Japanese ancestry lived in the United States in 1940, and close to 120,000 were relocated to live in internment camps. The East-West Center used 2010 Census data, and this was confirmed at the Census site, that there were a total of just over 1.3 million people in America who claim some Japanese heritage — with almost 842,000 claiming Japanese only.
12. Japan’s Auto Industry Footprint in America
It is no secret that Japanese industry exports and does vast business in America. Outside of TVs and other electronics, there are millions upon millions of cars sold each year by Japanese car giants in America (Toyota, Nissan, Honda).
Of the 17.5 million cars and trucks sold in America as a whole in 2015, a breakdown by major brand (may not include sub-brands) per Automotive News showed the following: Nissan brand set an annual sales record of 1,351,420 units and the Honda brand set an annual record with deliveries of 1,409,386 units. Toyota’s own press release showed that all Toyota Motor Sales, USA, were 2,499,313 units in 2015.
13. Japanese Cuisine Expansion in United States
The one area of Japanese culture that has expanded the most is its cuisine. The number of Japanese restaurants (particularly sushi bars) in America was miniscule before and after World War II. Japan’s explosive economic expansion into the 1980s and 1990s brought many more sushi bars to America to cater to Japanese businessmen who traveled and lived abroad. Sushi’s rise in America has continued for more than two decades, after what was considered the peak of Japan’s economic power.
Statistic Brain shows that there are nearly 4,000 sushi restaurants in the United States today (versus 45,000 in Japan) and that sushi now is a $2.25 billion revenue generator in the country. They also show that sushi consumption rose 28% from 2010 to 2014.
What people should consider here is that the number of restaurants and places you can buy sushi has exploded in the past two decades. Many mixed-Asian restaurants sell sushi, as do many grocery stores throughout America. While this may sound crazy and would not be recommended, you can even buy sushi to-go in some gas stations in America now.
Are you ready for retirement? Planning for retirement can be overwhelming, that’s why it could be a good idea to speak to a fiduciary financial advisor about your goals today.
Start by taking this retirement quiz right here from SmartAsset that will match you with up to 3 financial advisors that serve your area and beyond in 5 minutes. Smart Asset is now matching over 50,000 people a month.
Click here now to get started.
Thank you for reading! Have some feedback for us?
Contact the 24/7 Wall St. editorial team.