As of the end of the second quarter of this year, U.S. student loan debt outstanding amounted to $1.48 trillion, a total more than five times the amount borrowed in 2003. That total is spread among approximately 43 million borrowers (compared with 19 million in 2003) and represents an average balance per borrower of $33,500, approaching double the average balance in 2003.
The median student loan, however, is much lower, at just under $18,000. About a third of borrowers have balances of less than $10,000, while 20% have balances greater than $50,000. Just 7% have balances exceeding $100,000.
The data was posted on the Federal Reserve Bank of New York’s Liberty Street Economics blog last week. The Fed economists attributed the explosion in student borrowing to two things: many more borrowers and rising college costs. Student borrowing rose during the Great Recession partly due to a tight job market that encouraged more students to go to college. College costs rose by about 2% to 3%, adding to the increased borrowing, while the average balance rose by about 5%.
The researchers grouped anonymized credit reports and loan data and classified borrowers into quartiles based on the average adjusted gross income in their zip codes. Individual incomes are not available on credit reports.
The following chart shows that the number of borrowers was roughly the same across the quartiles. That’s largely due to the design of federal student loan programs that “distributes loans to borrowers across the income spectrum without regard to creditworthiness.”
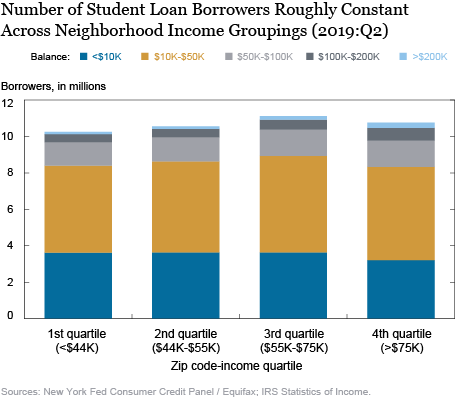 Source: Federal Reserve Bank of New York
That equality is eroded when loan balances are totaled by quartile. Borrowers in the two lower-income quartiles have balances of around $650 billion while borrowers in the upper two quartiles have borrowed more than $800 billion.
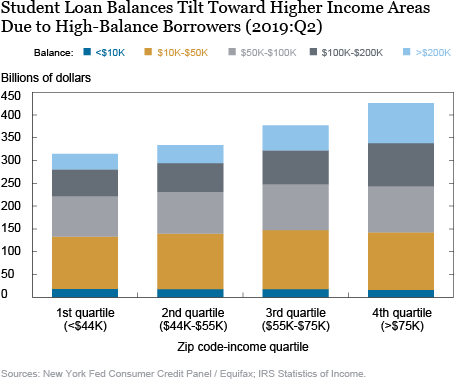 Source: Federal Reserve Bank of New York
The Fed researchers note that average balances are about $9,000 higher in the fourth quartile than in the first, but income levels are three times higher in the fourth quartile than in the first. As a percentage of income, balances in the first quartile reflect about 22% of a borrower’s income, while in the fourth quartile, balances reflect about 8% of an individual’s income.
The natural result is that borrowers in the lower-income groups have a harder time making repayments and, consequently, have higher delinquency and rates. Even higher income borrowers struggle to lower their balances though, as the following graphic indicates. The gray bars show the percentage of borrowers who are current with their payments, but whose balances are increasing. The reasons for the rising balances could be that borrowers are still in school or have recently graduated, or they make payments that aren’t large enough to offset accruing interest.
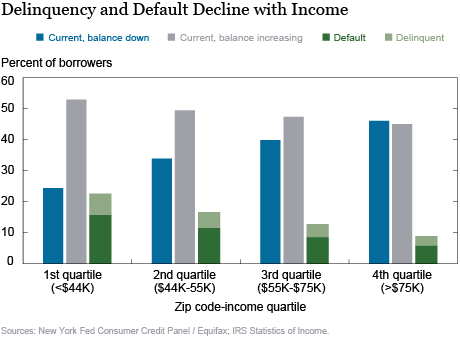 Source: Federal Reserve Bank of New York
 24/7 Wall St.
Thank you for reading! Have some feedback for us?
Contact the 24/7 Wall St. editorial team.
Editors' Picks