Health and Healthcare
Gilead Risks Beyond Just Merck: Serious Chart Violation Watch
Published:
Last Updated:
Gilead Sciences Inc. (NASDAQ: GILD) may have been largely responsible for the drop in biotech stocks after politicians went after its drug costs, but an excessive multiyear performance above and beyond the stock market also allowed sellers to keep exiting the sector. Now Gilead is facing a new threat — Merck & Co. Inc. (NYSE: MRK). Another sinister threat may be a key technical pattern in Gilead’s long-term stock chart. Source: Thinkstock
Merck announced positive study results on a hepatitis C trial. In Phase II studies, Merck showed that it had a cure rate of 98%. The study also brought on a 94% cure rate in another group. How this pans out in larger studies may not be known until 2015.
This is bad headline news for Gilead. It may not prove to be a real business risk as it stands today, but longer-term it does considering that Gilead’s drug charges are so high. Another plus for Gilead is that it can be used in what is supposed to be all genotypes, which is not a known conclusion for Merck as of yet.
Investors are shooting first and asking questions later. Gilead shares were down another 3.6% at $68.03 in late-morning trading on Thursday. This is down from a peak of $84.88 — a drop of right at 20% from the peak. Gilead is still the largest biotech by market cap at almost $105 billion.
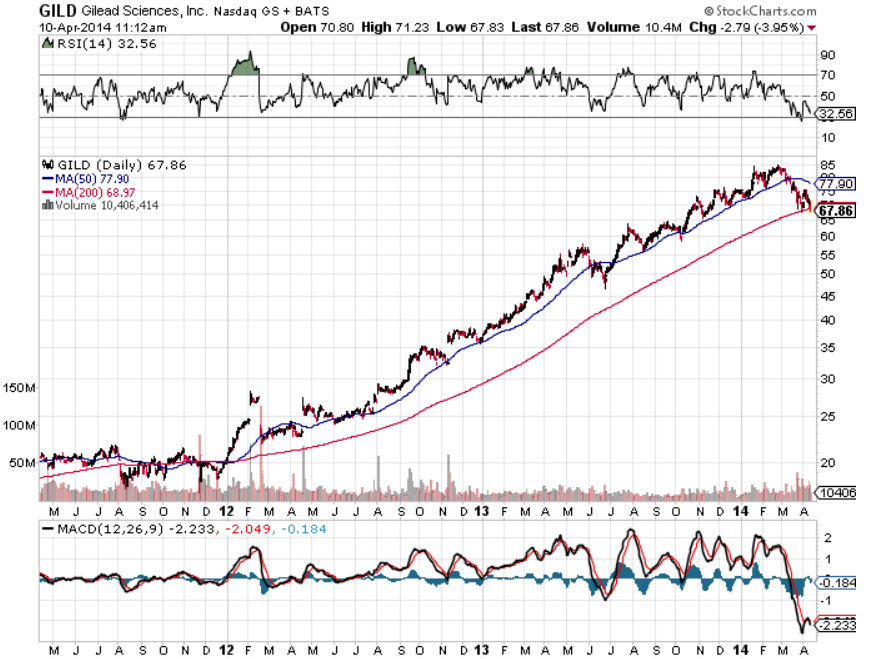
Another risk is Gilead’s 200-day moving average. That 200-day moving average sits at $68.97, and this could mark the first real challenge of that chart level. Gilead once challenged that level back in late March but managed to get back above it. After looking at a StockCharts.com chart, this would be the first time that Gilead has successfully broken under the 200-day moving average in more than two years.
What is a huge risk, at least on the surface, for Gilead may not be as big of a boost for rival Merck. Gilead’s market cap of almost $105 billion is based on expected revenue of almost $17 billion in 2014 and $21.6 billion in 2015. Merck’s market cap of $168 billion is based on expected revenue of about $43 billion in each 2014 and 2015.
ALSO READ: Warren Buffett’s Best Dividend Stocks
This is just another day of the momentum coming out of Gilead. The news headlines on the attack for hepatitis C may be the real culprit, but that chart is something else that will have technicians buzzing even more than they have been of late.
Watch that 200-day moving average on Gilead. It could indirectly become a serious valuation cap as far as how much investors are willing to pay for the fundamental growth when they apply historical chart patterns to the mix.
A financial advisor can help you understand the advantages and disadvantages of investment properties. Finding a qualified financial advisor doesn’t have to be hard. SmartAsset’s free tool matches you with up to three financial advisors who serve your area, and you can interview your advisor matches at no cost to decide which one is right for you. If you’re ready to find an advisor who can help you achieve your financial goals, get started now.
Investing in real estate can diversify your portfolio. But expanding your horizons may add additional costs. If you’re an investor looking to minimize expenses, consider checking out online brokerages. They often offer low investment fees, helping you maximize your profit.
Thank you for reading! Have some feedback for us?
Contact the 24/7 Wall St. editorial team.