Housing
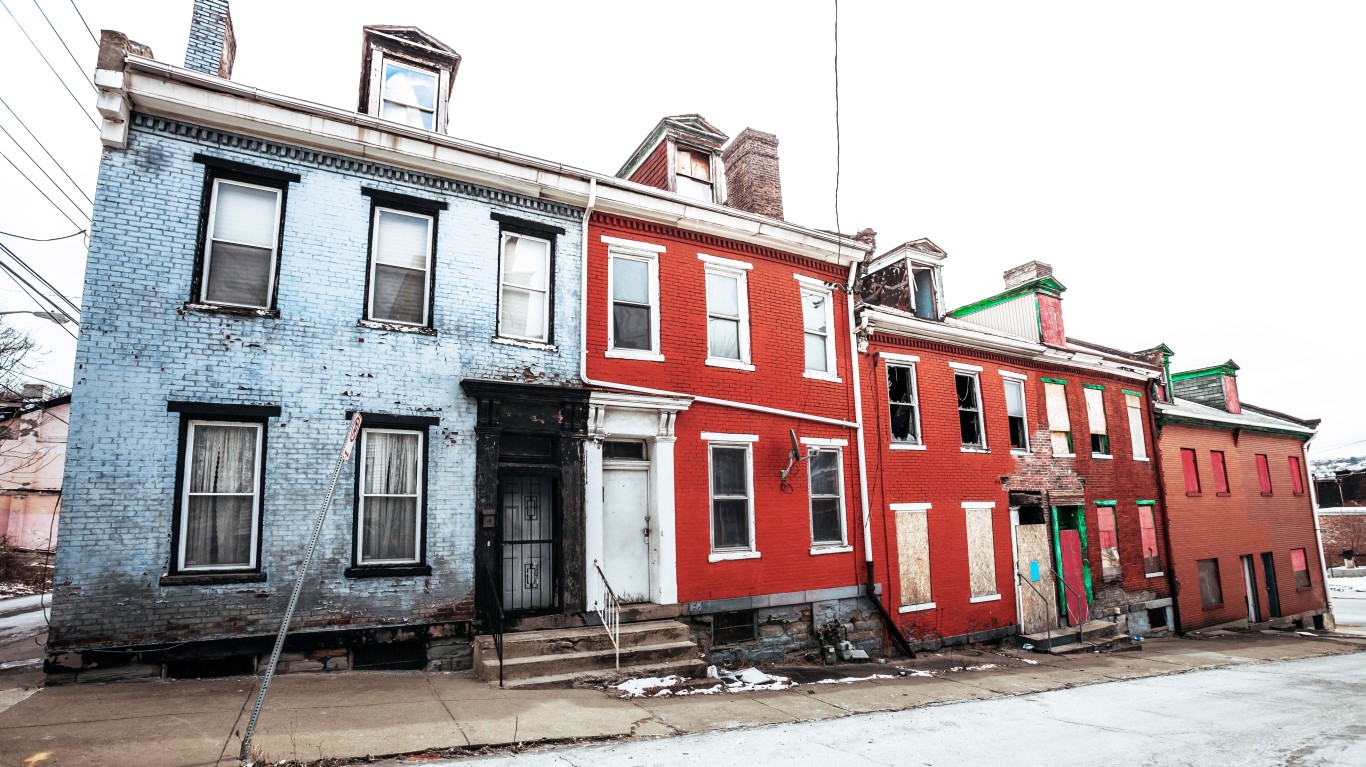
Portland, Seattle Home Prices Continue Surge
Published:
Last Updated:
In all 20 U.S. cities included in the S&P/Case-Shiller home price index, August house prices increased year-over-year, and all 20 also posted month-over-month increases. Portland (up 11.7%), Seattle (up 11.4%) and Denver (up 8.8%) posted the largest year-over-year gains. New York City, Phoenix and Tampa (all up 0.6%) posted the largest month-over-month increases, while Cleveland, Las Vegas and San Diego posted the smallest gains at 0.1%.
The smallest year-over-year gains came in New York (up 1.7%), Washington, D.C., (up 2.3%) and Cleveland (up 2.9%).
The S&P/Case-Shiller home price index for August increased by 5.1% year over year for the 20-city composite index and by 4.3% for the 10-city composite index. The national index rose to 5.3% year over year, up from a month-over-month increase of 5.1% in July.
The index tracks prices on a three-month rolling average. August represents the three-month average of June, July and August prices.
Before seasonal adjustment, the month-over-month National Index, 10-City Composite and 20-City Composite posted gains of 0.5%, 0.4% and 0.4%, respectively. After seasonal adjustment, the month-over-month gains were 0.6% on the National Index and 0.2% on both the 10-city index and the 20-city index.
Average home prices for August remain comparable to their levels in the winter of 2007.
The chairman of the S&P index committee, David M. Blitzer, said:
With the national home price index almost surpassing the peak set 10 years ago, one question is how the housing recovery compares with the stock market recovery. Since the last recession ended in June 2009, the stock market as measured by the S&P 500 rose 136% to the end of August while home prices are up 23%. However, home prices did not reach bottom until February 2012, almost three years later. Using the 2012 date as the starting point, home prices are up 38% compared to 59% for stocks. While the stock market recovery has been greater than the rebound in home prices, the value of Americans’ homes at about $22.3 trillion is slightly larger than the value of stocks and mutual funds at $21.2 trillion.
Compared with their peak in the summer of 2006, home prices on both 10-city and 20-city indexes remain down about 9.1% to 7.2%, respectively. Since the low of March 2012, home prices are up 40.5% and 43% on the 10-city and 20-city indexes, respectively.
Ever wanted an extra set of eyes on an investment you’re considering? Now you can speak with up to 3 financial experts in your area for FREE. By simply
clicking here you can begin to match with financial professionals who can help guide you through the financial decisions you’re making. And the best part? The first conversation with them is free.
Click here to match with up to 3 financial pros who would be excited to help you make financial decisions.
Thank you for reading! Have some feedback for us?
Contact the 24/7 Wall St. editorial team.