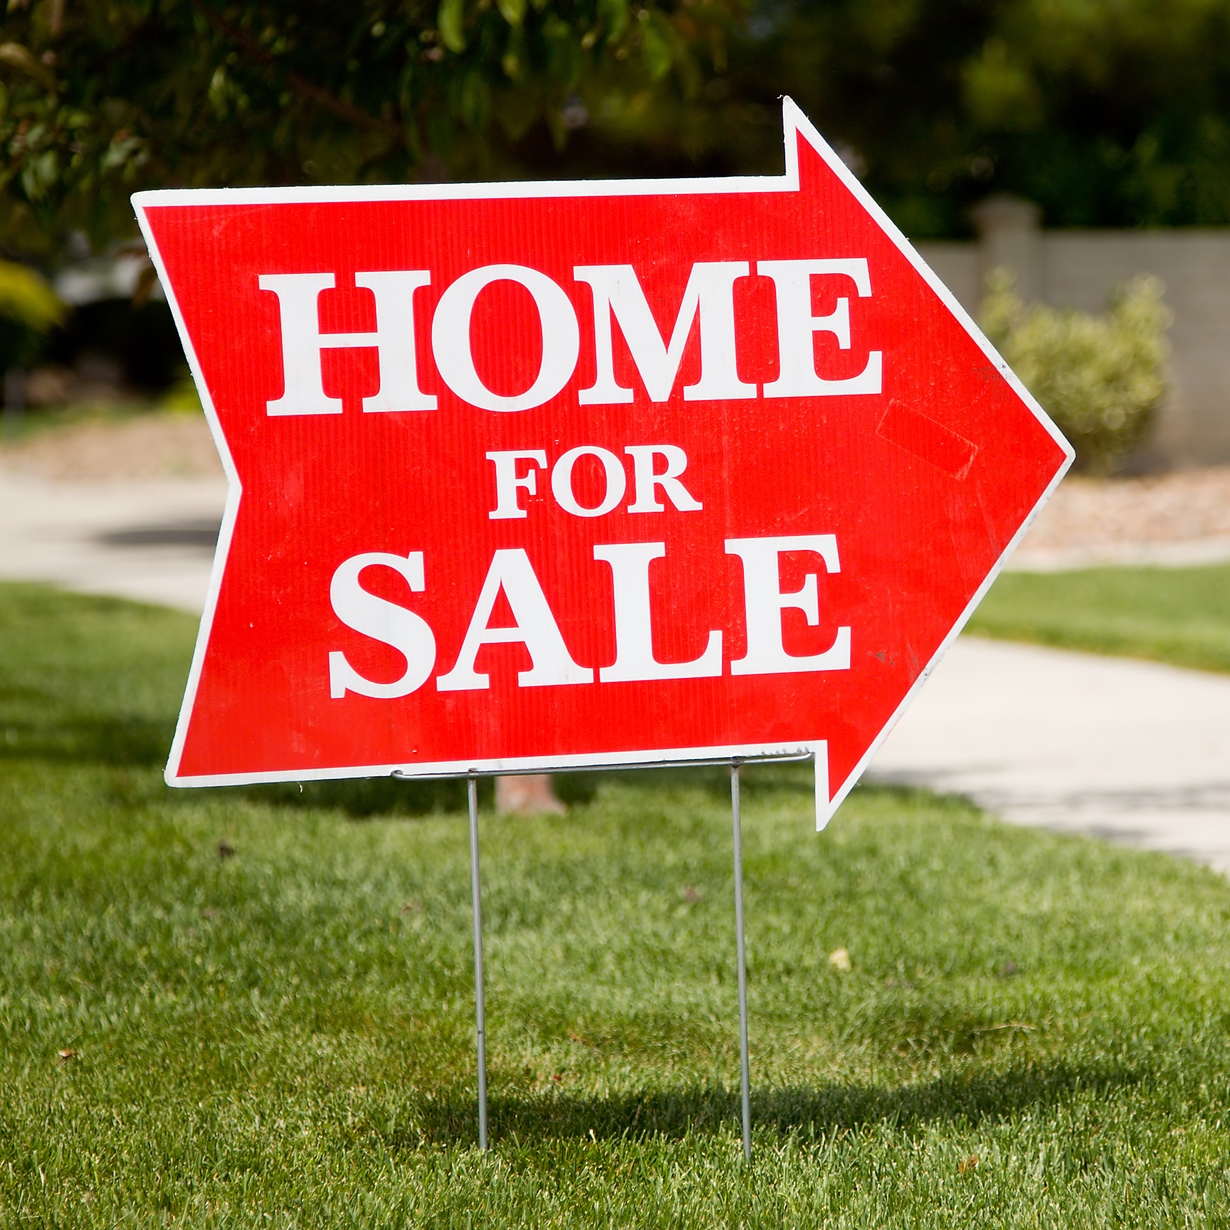
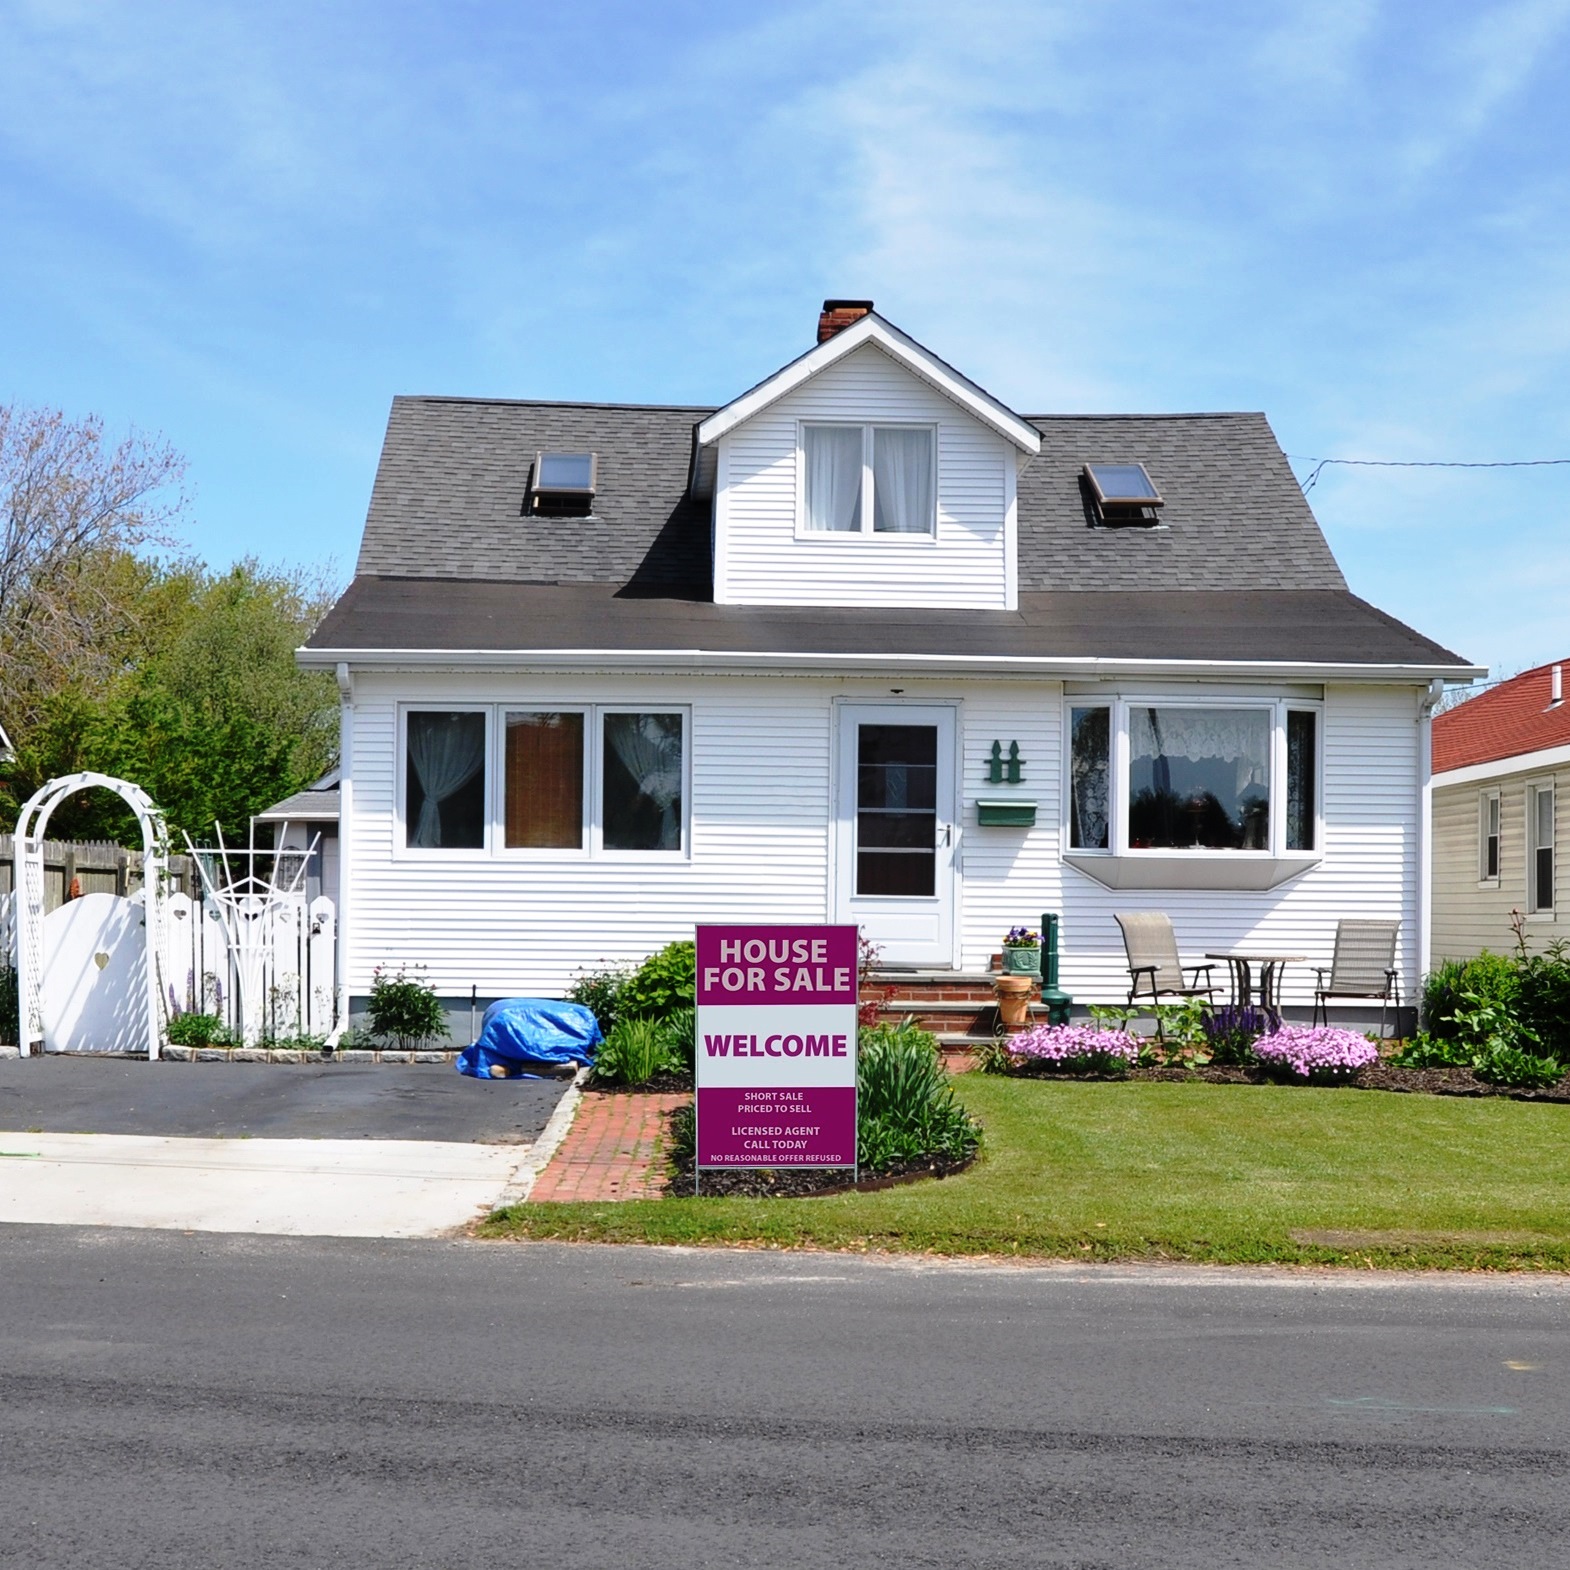
Housing
September Home Prices Continue Higher: Case-Shiller
Published:
Last Updated:
The S&P CoreLogic Case-Shiller national home price index rose to a tenth consecutive record high in September, rising 6.2% year over year to a non-seasonally adjusted (NSA) index of 195.51. The month-over-month percentage increase was 0.4%, down from the July-to-August increase of 0.5%.
In all 20 U.S. cities included in the 20-city home price index, September house prices increased year over year and 16 of 20 also posted NSA month-over-month increases. Seattle (up 12.9%), Las Vegas (up 9.0%) and San Diego (up 8.2%) posted the largest year-over-year gains. Las Vegas (up 1.0%) and New York and Tampa (up 0.9%) posted the largest month-over-month increases while Seattle (down 0.3%), Washington D.C. (down 0.2%) and Detroit (down 0.1%) posted declines. Minneapolis posted no month-over-month change.
The S&P CoreLogic Case-Shiller NSA home price indexes for September increased by 6.2% year over year for the 20-city composite index and by 5.7% for the 10-city composite index.
Economists had estimated an NSA year-over-year gain in the 20-city index of 6.2%. The NSA monthly gain of 0.4% came in at the consensus estimate.
The index tracks prices on a three-month rolling average. September represents the three-month average of July, August and September prices.
Average home prices for September remain comparable to their levels in the winter of 2007.
The chairman of the S&P index committee, David M. Blitzer, said:
Home prices continued to rise across the country with the S&P CoreLogic Case-Shiller National Index rising at the fastest annual rate since June 2014. Home prices were higher in all 20 cities tracked by these indices compared to a year earlier; 16 cities saw annual price increases accelerate from last month. Strength continues to be concentrated in the west with Seattle, Las Vegas, San Diego and Portland seeing the largest gains. The smallest increases were in Atlanta, New York, Miami, Chicago and Washington. Eight cities have surpassed their pre-financial crisis peaks.
Most economic indicators suggest that home prices can see further gains. Rental rates and home prices are climbing, the rent-to-buy ratio remains stable, the average rate on a 30-year mortgage is still under 4%, and at a 3.8-month supply, the inventory of homes for sale is still low. The overall economy is growing with the unemployment rate at 4.1%, inflation at 2% and wages rising at 3% or more. One dark cloud for housing is affordability – rising prices mean that some people will be squeezed out of the market.
Compared to their peak in the summer of 2006, home prices on both 10-city and 20-city indexes remain down about 4.0% and 1.5%, respectively. Since the low of March 2012, home prices are up 48.4% and 51.5% on the 10-city and 20-city indexes, respectively. On the national index, home prices are now 5.9% above the July 2006 peak and 45.9% higher than their low-point in February 2012.
Ever wanted an extra set of eyes on an investment you’re considering? Now you can speak with up to 3 financial experts in your area for FREE. By simply
clicking here you can begin to match with financial professionals who can help guide you through the financial decisions you’re making. And the best part? The first conversation with them is free.
Click here to match with up to 3 financial pros who would be excited to help you make financial decisions.
Thank you for reading! Have some feedback for us?
Contact the 24/7 Wall St. editorial team.


 24/7 Wall St.