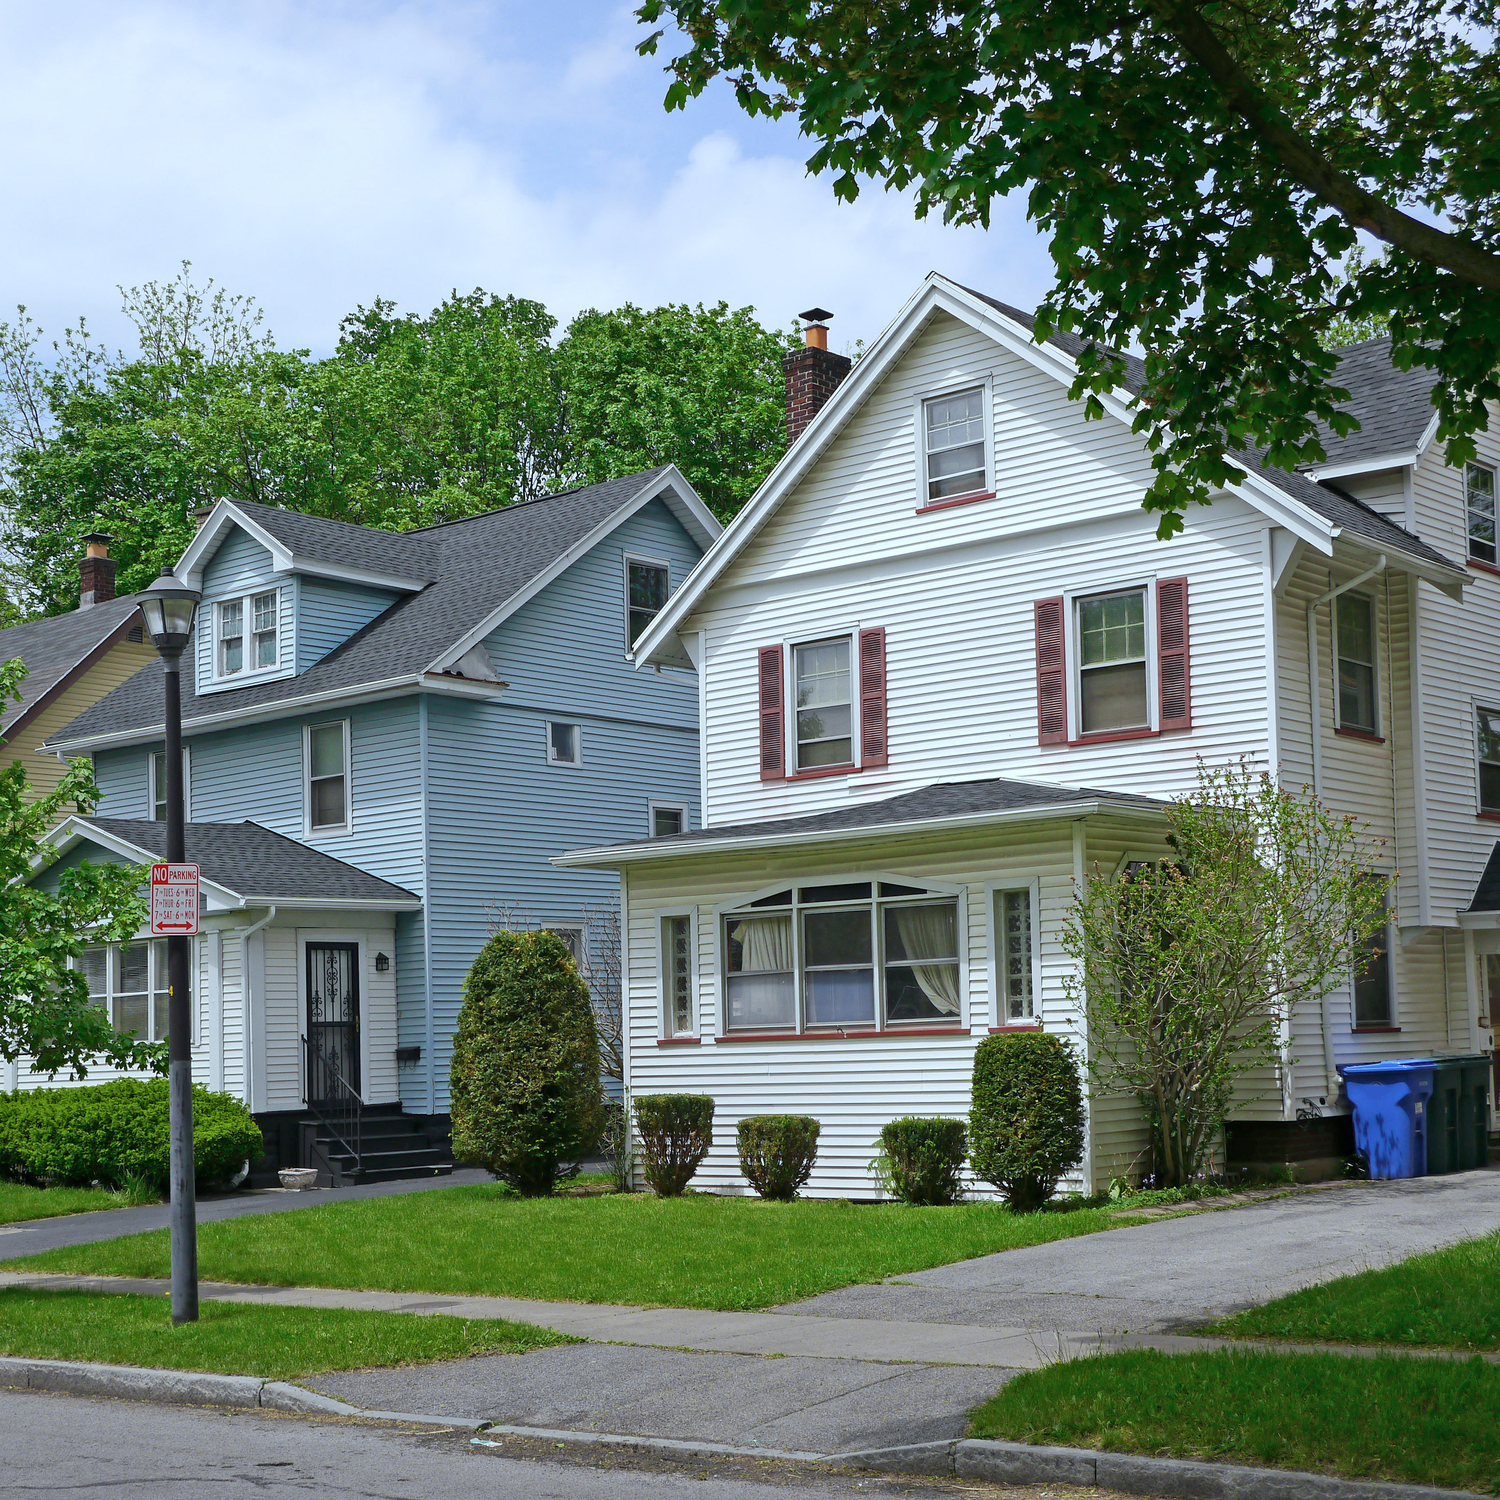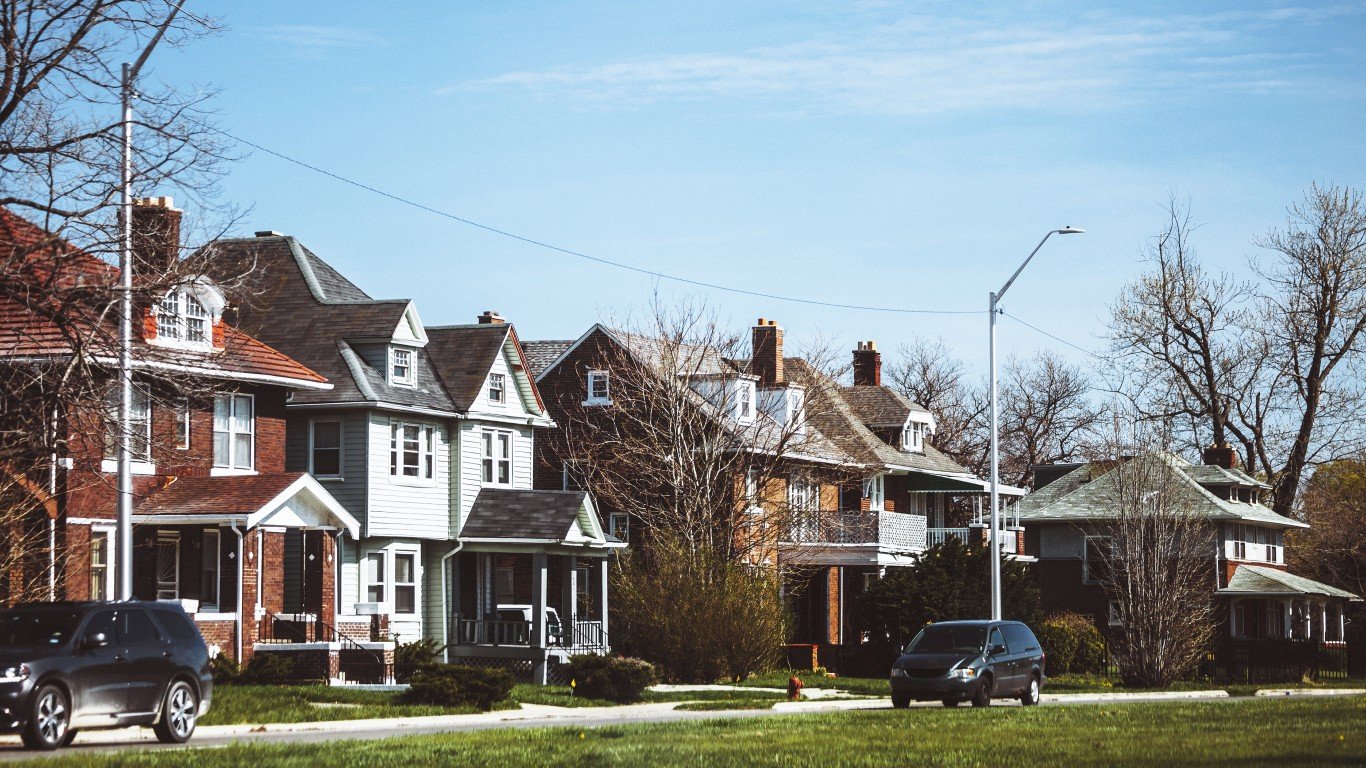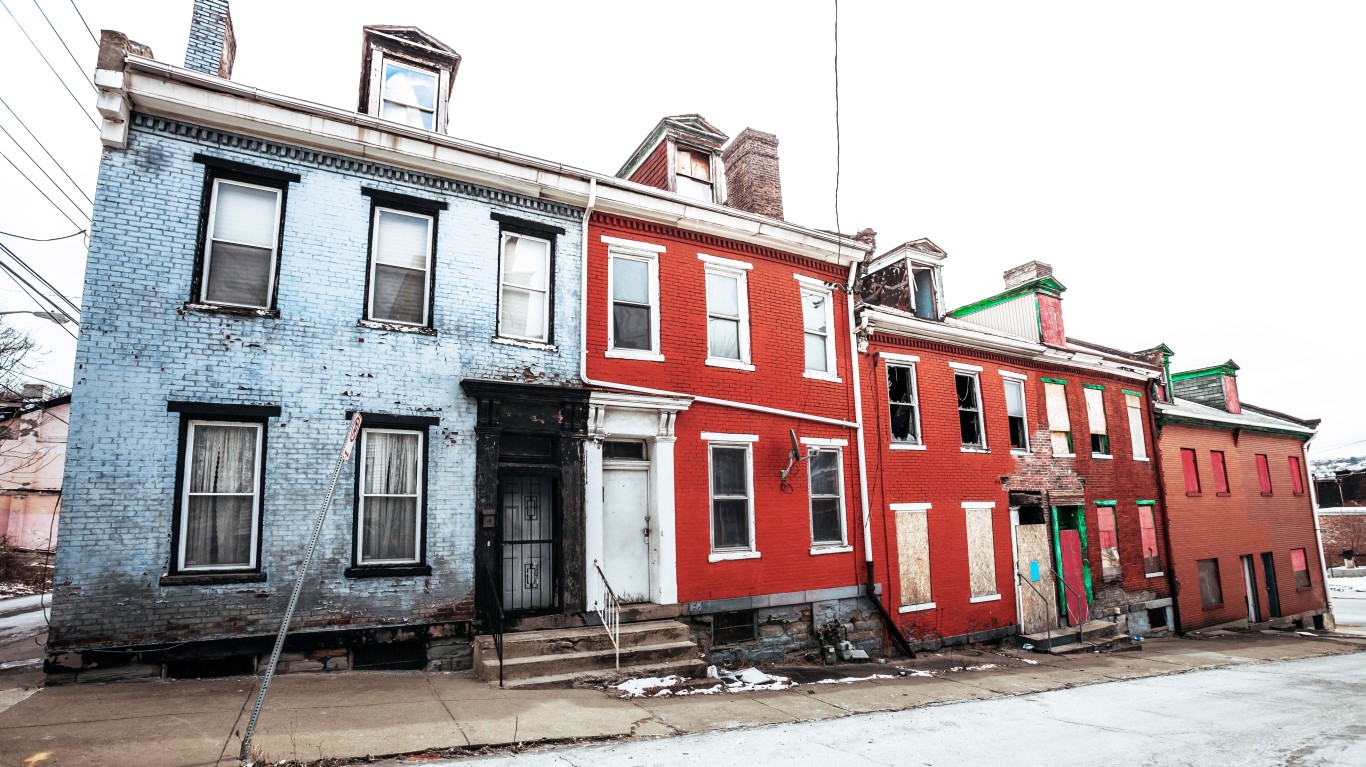

U.S. homeowners had lost $16 trillion in net worth between 2006, when home prices reached their peak, and 2011, when prices bottomed out. Home prices fell by a third in that period, and by the end of the third quarter of last year they had climbed out of that hole. The average U.S. home price was 1% higher than it had been at the 2006 peak.
The data were included in a new report, “Evaluating the Housing Market Since the Great Recession,” released Thursday by CoreLogic.
The recovery in home prices, though widespread, has not been universal. Current home prices in 14 states remain below their peaks, even though home prices have risen in every state and the District of Columbia between 2012 and 2017.
In Nevada for example, where the peak-to-trough drop of 60% in home prices was the worst in the country, home prices remain 23% below their peak levels, even though prices are up 93% from the low point.
In California, where prices bottomed a 42% below the 2006 peak, current home prices have moved to 2% above that peak, after rising 78% from their low point.
Here are the six states where home prices have risen most from their 2006 peaks:
- North Dakota: up 48% from 2006 peak and 50% from their low point
- Colorado: up 44% from the peak and 67% from their low point
- Texas: up 29% from the peak and 49% from the trough
- South Dakota: up 29% from the peak and 39% from the trough
- Tennessee: up 20% from the peak and 38% from the trough
- Nebraska: up 20% from the peak and 27% from the trough
Now the six states where home prices remain the furthest from their 2006 peaks:
- Nevada: down 23% from peak and up 93% from the trough
- Connecticut: down 19% from peak and up 8% from the trough
- Maryland: down 17% from peak and up 21% from the trough
- Arizona: down 16% from peak and up 66% from the trough
- Florida: down 16% from peak and up 66% from the trough
- New Jersey: down 14% from peak and up 17% from the trough
The metropolitan area that has posted the greatest home price appreciation in the five-year period between 2012 and 2017 is San Jose, where home prices have risen 77%, and the average equity gain on a home in the 12-month period ending in September of last year was $102,828. Seattle home prices appreciated 68% during the five-year period, and the average gain over the same 12-month period was 63,641. San Francisco prices rose 65% in five years, and the 12-month equity gain totaled $73,217.
The CoreLogic report is available from the company’s website and contains much more data and analysis.
Take This Retirement Quiz To Get Matched With A Financial Advisor (Sponsored)
Take the quiz below to get matched with a financial advisor today.
Each advisor has been vetted by SmartAsset and is held to a fiduciary standard to act in your best interests.
Here’s how it works:
1. Answer SmartAsset advisor match quiz
2. Review your pre-screened matches at your leisure. Check out the
advisors’ profiles.
3. Speak with advisors at no cost to you. Have an introductory call on the phone or introduction in person and choose whom to work with in the future
Take the retirement quiz right here.
Thank you for reading! Have some feedback for us?
Contact the 24/7 Wall St. editorial team.


