Why GE Analysts and Investors May Be Set Up for an Earnings Surprise
October 19, 2016 by Jon C. OggThis Friday morning will mark the third-quarter earnings report for General Electric Co. (NYSE: GE). While GE has had great promise in 2016, the reality is that GE has also faced a lot of headwinds too. Analysts and investors alike have cooled their jets on some of the expectations for the third quarter. Some have even cooled expectations for all of 2016 and for 2017.
The first thing to consider here is that GE shares are now down close to 5% so far in 2016. The shares are actually down over 10% over the past 90 days as the stock has pulled back from the highs.
24/7 Wall St. wanted to show by how much some of the estimates have come down for GE. We also wanted to address the “why” for a reasoning. We would also remind readers that this much conviction for a muted result sets up the stage for GE to potentially surprise if the news is anything other than bad.
GE shares were up 22 cents at $29.20 on Wednesday afternoon. GE’s latest consensus analyst price target is now $32.47, offering implied upside of 11.2%, before considering the 3.1% dividend yield.
What stands out here is that the consensus price target was on the rise for much of the earlier part of 2016. That has reversed, and the mean target is down $1.10 from a month ago and down $1.24 from just 60 days ago.
The median target, which is not used for the real consensus analyst targets, has slid even more of late. That means that multiple analysts have been dragging down some of their upside price targets, even if the lower “sell” and “underperform” ratings have just maintained their target prices. In short, the mean target might show more of what investors should be considering here: more muted upside. The median price target is currently $32.00. That is down from a median target price of $34.00 that was static over the months of July through September.
GE is also one of the fresh nine companies that have disappointed against analyst calls for 2016. In our own 2016 bullish and bearish case for GE, we were looking for 4.95% upside in 2016. It had passed that earlier this year, but now it is negative.
So, what’s driving the negativity and potentiality for a surprise?
One key issue is that GE expanded in the oil and gas services and equipment just in time for oil prices to crash. We have seen very muted expectations ahead from GE’s Oil & Gas efforts, but we cannot forget that oil has recovered handily and OPEC still acts like it will stick with production cuts.
First might be a most recent disappointing guidance from Honeywell. Note that Honeywell did not mean its guidance was bad, but the market voted its money that way. Another issue is that GE made a 3D printing acquisition, and this sector remains full of hype.
The airlines industry has been riddled with slower expectations in 2016. Some of this may be the global weakness, but there have also been flight groundings. All of this acts to mute demand for GE’s jet engines.
A summer research report showed that GE might do better under a Trump presidency, but we have recently seen that GE might now be fine under either Clinton or Trump. As a reminder, GE recently made another acquisition in wind, and GE is active in wind and other alternative and green efforts.
Now we need to consider the recent performance of the earnings themselves. GE’s earnings report from July did not exactly offer any wow factors. The conglomerate’s second-quarter report was $0.51 in earnings per share (EPS) on $33.5 billion in revenue. The Thomson Reuters consensus estimates for that quarter were $0.46 in EPS on revenue of $31.76 billion. In the same period of 2015, GE posted EPS of $0.31 and $29.32 billion in revenue. Still, the guidance and internals were different, and GE shares were trading at $32.59 (without adjusting for dividends) at that time.
Another issue to consider here is that GE’s effort has been to maintain that 2016 would be a back-end loaded success for the year. CEO Jeff Immelt has not been that vocal of late, but here is what he said in July:
Investors are seeing the benefits of our portfolio transformation. The GE Capital exit plan enabled GE Capital to return $15 billion in dividends year to date, and our de-designation as a systemically important financial institution gives us more balance sheet flexibility. We will continue to invest in key growth initiatives such as GE Digital, while returning ~$26 billion to investors through buyback and dividends.
The diversity and scale of our portfolio enabled the company to perform well despite a volatile and slow growth economy. We delivered $0.51 of earnings per share with strong execution in Power, Aviation and Healthcare that offset challenging environments in Oil & Gas and Transportation. We expect strong organic growth in the second half of the year and reaffirm our 2016 operating framework.
One issue which might matter now is that GE has been a mega-buyer of its own stock. GE’s cash and marketable securities totaled $91.8 billion at the end of the June quarter, versus $102.5 billion at the end of June in 2015. GE said in July that its total return of capital to shareholders was about $18 billion, with roughly $13.7 billion of that from the share buyback plan.
When GE reports earnings, here are the expectations for the third and fourth quarter of 2016, as well as the fiscal years 2016, 2017, 2018 and 2019:
- Q3/16: $0.30 EPS and $29.64 billion revenue
- Q4/16: $0.47 EPS and $34.95 billion revenue
- FY/16: $1.49 EPS and $126.1 billion revenue
- FY/17: $1.69 EPS and $124.58 billion revenue
- FY/18: $1.95 EPS and $129.43 billion revenue
- FY/19: $2.25 EPS and $138.67 billion revenue
What investors need to take under consideration is that the prior talk has been for GE to hit $2.00 in earnings per share in 2018. That is now no longer considered as gospel by analysts (with the $1.95 EPS target now). It is also dangerous for companies to offer too much specific guidance that far out.
Part of the long-term guidance and estimates is based in part on a lower share count, with GE retiring shares as it buys them down. The 10 billion shares of 2015 are projected by analysts to fall as follows (at year-end):
- 9.16 billion in 2016
- 8.73 billion in 2017
- 8.35 billion in 2018
- About 8.2 billion in 2019
If you want to go back and see what makes GE so hard to analyze, it is that GE has been in a serious state of change. On top of recent small acquisition, GE had two big cautious analyst reports in July after earnings. On top of GE now facing lower financial regulations after losing its SIFI/TBTF designation, GE has also been selling non-core units.
GE is perhaps one of the most important companies that guide the overall economy. Its market cap of $261 billion makes it the tenth largest U.S. company, but it is actively involved in so many areas of the economy that investors have to pay attention to GE’s earnings whether they want to or not.
As a reminder, being set up for a surprise is not always a positive surprise. GE has many moving parts to it and it is rather hard for analysts and investors to get their calls right. When the bets get lined up too much on one side or another, it creates an opportunity for contrarians to come in before or after the news is out.
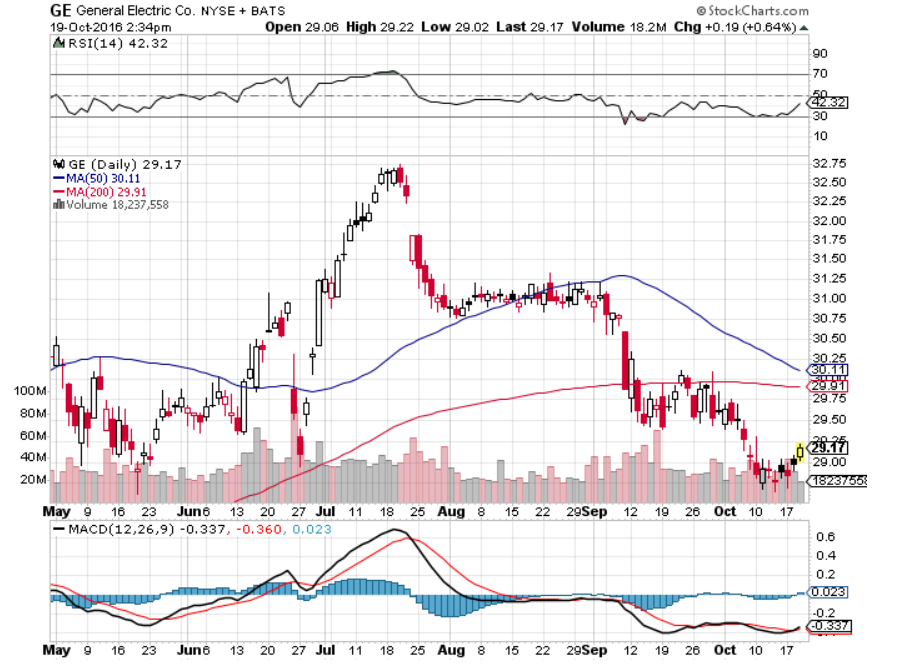
One last consideration here is GE’s chart. As you will see, GE would face a lot of implied share price resistance as it gets closer to $30. Its 200-day moving average is just under $30 and its 50-day is just above $30 (see the StockCharts.com chart below).
Sponsored: Attention Savvy Investors: Speak to 3 Financial Experts – FREE
Ever wanted an extra set of eyes on an investment you’re considering? Now you can speak with up to 3 financial experts in your area for FREE. By simply
clicking here you can begin to match with financial professionals who can help guide you through the financial decisions you’re making. And the best part? The first conversation with them is free.
Click here to match with up to 3 financial pros who would be excited to help you make financial decisions.