The bull market is alive and well, and the S&P 500 recently broke 1,700 for the first time ever. So, what happens now that stocks have rallied and rallied as fears of an end of the Federal Reserve’s quantitative easing are abating? As the S&P 500 Index hits new record highs, we wanted to revisit the call for the current bull market to become a secular bull market. Jay Lefkowicz, a technical analyst for Concept Capital, has made the very ambitious market call for the S&P 500 Index to rise to 2,584.
Investors will want to pay attention here. The translation is that the SPDR S&P 500 (NYSEMKT: SPY) still could rise another 50% or so if the S&P 500 Index call comes to fruition. Be advised that this relation to the SPDR versus the actual S&P 500 Index is of course before management fees and any possible tracking errors that can occur through time.
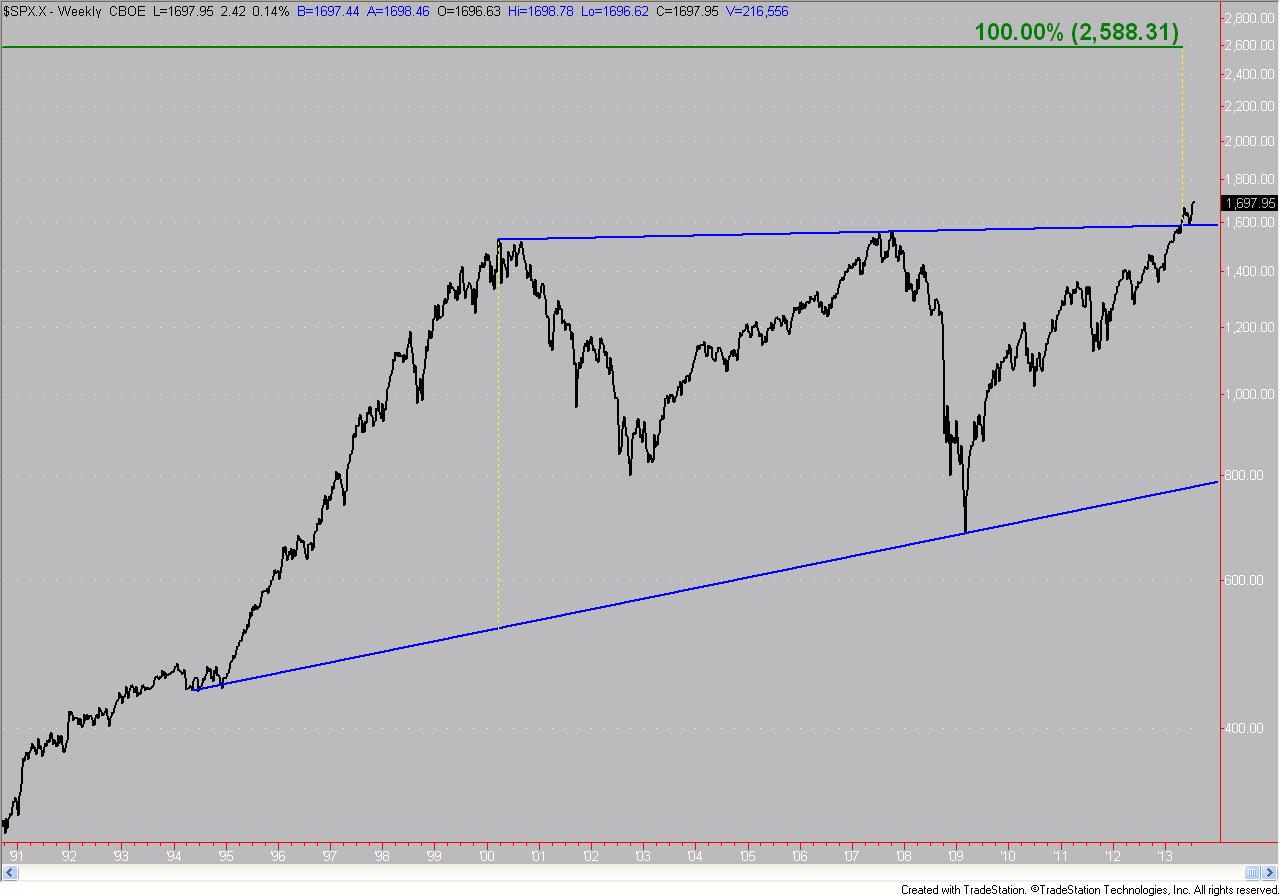
We have included an interview here from earlier in July that shows how and why this rally is sustainable, and we also have given a link back to the technical analyst’s article that was the basis of the call for the S&P 500 Index to go to 2,584. The chart offered here is also an updated chart, now that the breakout above the old resistance line is more apparent and easily seen.
Below is a recent interview we had with Jay Lefkowicz.
24/7: Jay, first off thank you for allowing us to present this to our readers. I must say that seeing a projection of over 2,000 on the S&P 500 Index is no small task. So when I see 2,500 or in this case 2,584 on the S&P 500 I can only wonder what sort of time period we are talking about. Is this a straight move with few pullbacks? Is it is a five-year call? Please explain.
JL: The analysis was based on Weekly and Monthly charts of the S&P 500 Index. I’ve been watching an 80-year chart for the past couple of years, and after the breakout in May, I focused in on the rally that began in 1994. Connecting the tops since 2000 yields a 13-year triangle, therefore a breakout from a 13-year pattern will require years to resolve. My target date is the next Fibonacci date, August 13, 2021 (8/13/21). Over the next 8 years, one should expect some pullbacks.
24/7: While timing is of course an issue, what pitfalls would cause you to reconsider your call? What sort of technical damage would have to be done?
JL: All the work I do is based on the Reward:Risk ratio (the convention is Risk:Reward, but who says “I like this idea, it’s a 1:2 trade”?). The minimum acceptable ratio is 2:1, so with 900 points of potential upside, acceptable risk can be up to 450 points. Looking at the rally since the 2009 low, a pullback below the 38.2% Fibonacci retracement of a rally (wherever it peaks) would be a cause for concern — from this point that works out to about 1,300 (on the S&P 500).
24/7: Jay, true technicians say that the fundamentals of the market take a total backseat or are not even relevant in true technical analysis. If you are calling for a move to over 2,000 and then over 2,500 on the S&P 500, then what does this imply for other major indexes like the DJIA, Nasdaq, and even the troubled European and Chinese stock markets while their economies struggle?
JL: First, I think fundamentals drive the charts and a technician must make an unbiased judgment based on price information. There are very good fundamental analysts looking at a small number of stocks. Large institutions act on that information, which builds the charts. My job is to look at the developing picture and determine if the pattern says Buy, Sell, or do nothing. As far as other indices, I do shorter term work on the e-mini S&P 500 (ES), NASDAQ 100 (NQ) and Russell 2000 (TF) futures. The prices for the major market ETFs (SPY, QQQ, and IWM) are based on those futures. I have a 1,748 target for ES and 3,193 – 3,213 for NQ.
24/7: Is anyone else is making a huge call like this that you are in touch with, or are you a lone wolf here calling for upside this large?
JL: I participate in a technicians email group and so far only one other technician mentioned the same pattern. I’m not sure if that is good or bad. My initial thought is that a majority of technical work does not look back as far as I did.
24/7: The last thing I would like to ask is around market participation, or lack thereof. The little guy and retail investor was shaken out of the stock market during or after the recession. What would you tell an investor who missed the rally in stocks so far about there still being 50% more upside to the stock market?
JL: Look at this excellent chart from BAML on Sell Side Equity Allocation recommendations. Non-participants are not alone. As far as an individual investor, I could get into the whole equities are risky and not for everyone, past results do not guarantee future performance pabulum. I can advise them to speak to a professional advisor that can tailor an investment plan to their specific needs and goals.
Here was an original research note on the matter as well.
Sponsored: Attention Savvy Investors: Speak to 3 Financial Experts – FREE
Ever wanted an extra set of eyes on an investment you’re considering? Now you can speak with up to 3 financial experts in your area for FREE. By simply
clicking here you can begin to match with financial professionals who can help guide you through the financial decisions you’re making. And the best part? The first conversation with them is free.
Click here to match with up to 3 financial pros who would be excited to help you make financial decisions.
Thank you for reading! Have some feedback for us?
Contact the 24/7 Wall St. editorial team.
Editors' Picks


