Investing
Many Closed-End Bond Funds With Massive Discounts to NAV vs ETFs
Published:
Last Updated:
Most investors who have been in the markets for more than the past decade knew about mutual funds long before they knew much about exchange traded funds (ETFs). While most mutual funds are open-ended, with unlimited potential sizes, the class of closed-end mutual funds has a set size when it comes on the market. Unlike traditional mutual funds and ETFs, they often trade at discounts or premiums to the net asset value (NAV). Source: Thinkstock
With so many value investors out there, many of them get very interested when they see stocks and funds that are trading at a discount to what they are really worth. There are sometimes good reasons behind why some funds trade at a discount to the NAV. There are also some obvious reasons that many trade at a premium to their NAV.
24/7 Wall St. recently was able to find some research from Bank of America Merrill Lynch that highlighted some of the top closed-end funds (CEF) covering bonds or fixed income with solid dividend yields that were trading at deep discounts to their NAV. Some of the prices have changed slightly, as have some of the discounts. To account for some of the changes, 24/7 Wall St. also included the stated discount to NAV that was registered at the Closed-End Fund Association website.
One key thing that Merrill Lynch did here was to break out the current discount by comparing each CEF’s historical average discounts. The firm also had Buy ratings on all of these as well. The hope is that some of the discounts are already pricing in some of the impact that will be seen when the Federal Reserve ultimately raises interest rates in 2015 or 2016. These discounts also act as a solid yield-booster as well to what are already above-average yields.
When investors buy bond funds, they are generally looking for two issues: stability and yield. These all offer solid dividend yields, but stability is going to be in the eye of the beholder here. After all, they got to trade at a discount to the NAV somehow.
24/7 Wall St. also only picked the funds out of the much larger report that had a combination of stronger dividend yields or better discounts versus the historic average discounts. Out of the 43 CEFs covered in this report, we narrowed these down to roughly 10 funds before going into detail here. These CEFs include some tax-free yielding municipal funds (see part two of this report), senior loan CEFs, high-yield funds and even an emerging market debt CEF.
Senior Loan CEFs
Voya Prime Rate Trust (NYSE: PPR) trades near $5.45, has a 52-week trading range of $5.15 to $5.79 and a yield of roughly 6.4%. The Merrill Lynch stated discount to NAV was -7.8%, versus its three-year average of -1.7%. The CEFA discount to NAV was also shown to be -7.8%, and the fund has roughly $880 million in assets.
Nuveen Floating Rate Income Fund (NYSE: JFR) currently trades around $10.99, has a 52-week range of $10.44 to $12.11 and comes with a yield of 6.6%. Merrill Lynch showed a discount to NAV of -9.5%, versus a three-year average discount of -3.5%. The CEFA discount was shown as -9.6%, and the fund has nearly $680 million in assets.
High-Yield Bond CEFs (Junk Bonds)
Western Asset High Income Opportunity Fund Inc. (NYSE: HIO) was at $5.23, with a 52-week range of $5.18 to $6.13 and a yield of 8.1%. Its discount to NAV was -12.8% per Merrill Lynch’s data, versus a three-year average discount of -5.0%. The CEFA discount to NAV was even wider at -13.18%, and this junk bond fund has just over $500 million in total assets.
Emerging Market Debt CEFs
Morgan Stanley Emerging Markets Domestic Debt Fund Inc. (NYSE: EDD) trades at $8.86, has a 52-week range of $8.73 to $13.57 and has a stated yield of 9.9%. This one is currently trading at a discount to NAV of -14.5%, compared to a three-year average of -10.7%. The CEFA site shows an even wider discount of -14.8%, and the fund has some $736 million in total assets. Just keep in mind that annual NAV has fallen by almost 26% over the past year.
Multi-Sector Fixed Income CEFs
PIMCO Dynamic Credit Income Fund (NYSE: PCI) trades at $20.34, has a 52-week range of $20.18 to $24.07 and comes with a 9.2% yield. Merrill Lynch showed a discount to NAV of -12.0%, versus a historic discount to NAV average of -6.6%. The CEFA discount to NAV was shown as -12.16%. This fund has a very large asset base of almost $3.2 billion.
AllianceBernstein Global High Income Fund (NYSE: AWF) trades at $12.02, has a 52-week range of $11.92 to $14.39 and comes with a yield of 8.1%. Its discount to NAV was shown to be -12.8%, versus a historic average discount of only -3.1%. CEFA showed a discount to NAV of -12.82%, and the fund has roughly $1.21 billion in assets.
ALSO READ: 10 Stocks to Own for the Next Decade
24/7 Wall St. wanted to make some reminders for guidance here so that investors do not just see a discount to NAV and want to jump right in without doing a lot of additional research. The biggest trick to understanding any investment is truly understanding what you are investing in. It sounds simple enough, but the simplicity ends there.
Sometimes it is very hard to calculate a net asset value. Some funds, open-end and closed-end alike, can hold bonds or other debt instruments that are either not very liquid or that have no market whatsoever. In some cases funds that are “bond funds” may even own common or preferred shares. Even ETFs sometimes trade at a discount or premium to their NAV or against the underlying index, and in that case it is referred to as “tracking error.”
Additional issues can come into play, such as currency risks. The emerging market sector was battered partly because of the strong dollar. Other funds often hold international debt, and some of that may not be dollar denominated. So guess what a strong dollar does there to the NAV.
Another consideration is leverage. Some funds have $100 million in investor money but they may have total invested assets of $125 million. This is where they have borrowed funds to buy more securities, which acts like a yield-juicing tool to increase those dividend payouts more than if the fund’s assets were dollar for dollar in the market.
After you begin to review these, be sure to look at their charts — and not just over the past year. Many closed-end funds have a trading history that goes back a decade or far longer. That means you can see how they were valued before the market crash of 2008 and 2009, how they traded during the market panic and how well they recovered thereafter.
Dividend yields are generally static for a while with most traditional stocks. That is not always the case in the land of open-end mutual funds and closed-end mutual funds. Not even ETFs always have static dividends. That means that the yield may be based on a snapshot in time and used on a static basis.
Another wild card for closed-end fund investors is that there is a so-called income only yield and a distribution yield. The “income only” is what the fund actually is taking in off of its investments in the market. The “distribution yield” is what investors are being paid. In a perfect world, the distribution yield is lower than the income only yield. Effectively this is the equivalent of common stock’s dividend coverage (earnings per share versus the dividend per share). When the payout is higher than the actual income, it means there may be borrowing or other issues allowing the funds to pay out more than the actual income is generating.
ALSO READ: 12 Things Not to Do If You Win the Lottery
Interest rate hikes, and the periods before and after they are enacted, have historically created volatility in the bond market. Now guess what happens when you have a bond fund that doesn’t just invest in Treasury debt and in the debt instruments of U.S. government agencies. Not all bonds rise or fall in value at the same rate as the actual Treasury notes and bonds that their prices are supposed to track.
During extreme times, such as 2008, some closed-end funds become volatile enough that they get out of line with what is called asset coverage of senior securities in the funds. When this occurs, the funds are forced to either skip or delay their dividend payments. Take a guess of what happens to a share price or the value of debt when an investor is threatened with not getting expected interest and dividend payments. Hint, it isn’t good.
A last consideration here, which is far from last in order of importance, is a fund’s management fees and its total fees. The management fee is what the funds actually pay out to the money management team and firm that manages each fund. Then there is a total expense ratio to consider: the management fees plus items like commissions paid, auditing and regulatory fees, legal and custodian fees and other fees. Before bashing open-end and closed-end funds for these, note that ETFs have them too.
Again, the true trick to investing outside of Treasuries or indexes is not always just the market fluctuations you see each day in the financial media or on your quote screens and trading systems. Knowing exactly what you are investing is paramount and it is not as easy as it seems.
24/7 Wall St. has included the snapshot of the Merrill Lynch table showing its Buy-rated closed-end funds. Again, this is a two-part report which breaks out the municipal funds from the rest of the bond CEFs.
Over 40 funds were in that research and we narrowed the list down to about 10 closed-end funds based on a combination of their yields and their current discount to NAV versus their historical averages.
ALSO READ: How to Protect Yourself From a Summer Stock Market Correction
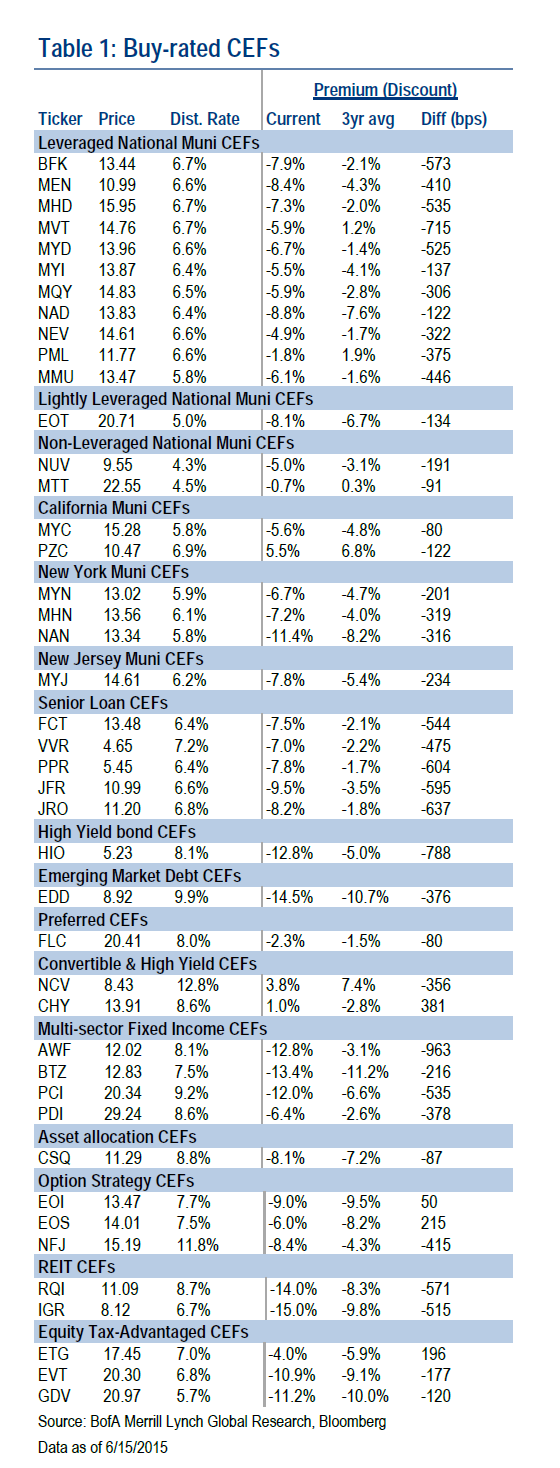 Source: Merrill Lynch research
Take the quiz below to get matched with a financial advisor today.
Each advisor has been vetted by SmartAsset and is held to a fiduciary standard to act in your best interests.
Here’s how it works:
1. Answer SmartAsset advisor match quiz
2. Review your pre-screened matches at your leisure. Check out the
advisors’ profiles.
3. Speak with advisors at no cost to you. Have an introductory call on the phone or introduction in person and choose whom to work with in the future
Take the retirement quiz right here.
Thank you for reading! Have some feedback for us?
Contact the 24/7 Wall St. editorial team.


