Merrill Lynch’s Top Thematic Chart Stocks to Buy for Q3 of 2017
July 1, 2017 by Jon C. OggThere are multiple types of investors and traders out there. Some are conservative and some are aggressive. Some investors look for companies with great growth, strong earnings, great product cycles or myriad other fundamental strengths to support owning a stock. Then there are the technical investors, investors who generally could not care less about the fundamentals and who only give weight to a stock’s trading trends and chart patterns.
The bull market is well over eight years old now. And it is hard to fathom that half of 2017 already has come and gone. Bank of America Merrill Lynch has released its thematic chart picks for further upside and breakouts in the third quarter of 2017.
24/7 Wall St. looked at the eight Merrill Lynch top technical stock ideas for the third quarter here. While some of these stock chart patterns are calling for near-term upside, some of them cited by the firm call for much higher stock prices over a longer period.
We also have included a separate notation on what the fundamental analysis team at the firm was calling for on their formal price objectives. After all, it is important for many investors to know if strong chart calls match up with strong fundamental expectations.
These are the eight top thematic breakout picks from Merrill Lynch for the third quarter of 2017.
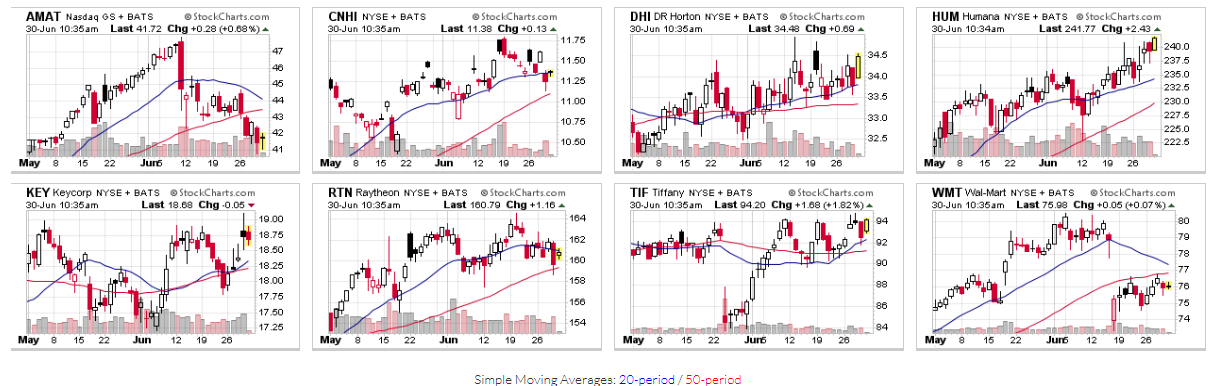
Applied Materials Inc. (NASDAQ: AMAT) was one of the top technology picks, and Merrill Lynch sees it correcting within a bullish channel. The firm noted that holding support at $40 to $39 would keep its rising channel intact with upside potential to a channel resistance level up at $50.00 to $52.50. The fundamental team’s call on Applied Materials has a $65 price objective, and that is about $15 higher than consensus and is the highest official price target in the Thomson Reuters universe.
Applied Materials shares were trading down 0.3% at $41.31 on Friday’s close, in a 52-week range of $23.49 to $47.86. The consensus analyst price target is $50.30.
CNH Industrial N.V. (NYSE: CNHI) was one of two industrial calls for technical strength for the third quarter. Merrill Lynch noted a pause within an uptrend, noting that holding a range of $10.78 on the high end to $10.08 on the low-end keeps the uptrend intact for a move beyond resistance at $11.80 to $11.95 toward a higher range of $13.00 to $13.85. Merrill Lynch’s fundamental team has a $15 price objective here.
CNH Industrial closed Friday up 1.1% at $11.38 a share, in a 52-week range of $6.26 to $11.79. Its consensus price target is $10.49.
D.R. Horton Inc. (NYSE: DHI) is said to be in a bullish one-year base, and a move above $34.50 or $34.60 would confirm for upside to the $41 to $43 area. That would be back at the pre–housing crisis highs. Even keeping the stock above $32.00 or $31.90 would maintain D.R. Horton’s pattern bullish. Merrill Lynch’s fundamental price target is $42.
D.R. Horton traded up 2.3% on Friday to $34.57, in a 52-week range of $26.69 to $34.94. Its consensus price target is $36.19.
Humana Inc. (NYSE: HUM) is a top health insurer that Merrill Lynch sees a two-year base breakout targeting $240 first and ultimately $280. Holding above the base breakout point at $217 to $220 would also keep Humana’s pattern bullish. Merrill Lynch’s fundamental team has a $270 price objective.
Humana was trading up 0.5% at $240.62 as of Friday close, in a 52-week range of $150.00 to $241.46. Its consensus price target is $241.63.
KeyCorp (NYSE: KEY) was the sole pure-play in financials for the top thematic charts in the third quarter of 2017. The firm sees a big base and bullish consolidation, with a trade above $19 completing a bullish consolidation up to $21.60, and ultimately $25 to $26 over a longer term. The key support is at $17.80 and down to $17.20. Merrill Lynch’s fundamental price objective is $22.
KeyCorp ended Friday at $18.74, about where it started the day. The 52-week range is $10.38 to $19.53, and the consensus analyst target is $20.54.
Raytheon Co. (NYSE: RTN) is the sole defense company within industrials for technical breakout picks in the third quarter. Merrill Lynch sees a rising channel from mid-2015 favoring further upside to $175 to $180, while dips that hold support at $155 or even $150 would keep the trend in a bullish pattern. Merrill Lynch’s fundamental price objective is $185 on Raytheon.
Raytheon traded up 1.1% at $161.48 on Friday’s close, in a 52-week range of $132.89 to $165.33. Its consensus price target is $173.47.
Tiffany & Co. (NYSE: TIF) was said to be in a bullish consolidation, and above $95 would confirm for further upside to $105 to $110. The firm thinks that the pattern remains bullish for Tiffany above $90, with additional support down in the $88.90 to $84.60 levels. The Merrill Lynch fundamental team has Tiffany’s price objective at $110.
Shares closed up 1.5% at $93.87 on Friday, in a 52-week range of $58.56 to $97.29. The consensus price target for Tiffany is $94.67.
Wal-Mart Stores Inc. (NYSE: WMT) is currently viewed as a bullish breakout and retest, where holding above $75.00 or even $72.50 would keep its pattern constructive for the stock to run up to $80 first and ultimately move up toward $85. Merrill Lynch’s fundamental analyst has an even more bullish $90 price objective for the world’s largest store retailer.
As Friday’s session came to a close, Wal-Mart shares were down 0.3% on the day to $75.68. The 52-week range is $65.28 to $80.47. The consensus price target is $80.38.
A montage of charts from StockCharts.com has been provided here for a reference.
Sponsored: Find a Qualified Financial Advisor
Finding a qualified financial advisor doesn’t have to be hard. SmartAsset’s free tool matches you with up to 3 fiduciary financial advisors in your area in 5 minutes. Each advisor has been vetted by SmartAsset and is held to a fiduciary standard to act in your best interests. If you’re ready to be matched with local advisors that can help you achieve your financial goals, get started now.