Where Do People Spend More: Wal-Mart, Costco or Whole Foods?
March 2, 2016 by Paul AusickThe joke that Whole Foods Market Inc. (NASDAQ: WFM) should actually be called Whole Paycheck reflects the fact that the organic grocer’s prices are on the high side. But how, exactly, do purchases at Whole Foods compare with purchases at Wal-Mart Stores Inc. (NYSE: WMT) or Costco Wholesale Corp. (NASDAQ: COST)?
A recent analysis by researchers at Perfect Price combed through billions of credit card transactions to find out how much shoppers actually spend on groceries when they buy at these stores. The research produced a list of the top 25 food retailers by the average amount spent per trip in May and June of 2015. The top 10 are:
- Costco, $136 average per trip
- Sam’s Club, $81
- Target, $62
- HEB, $59
- Stop & Shop, $56
- Wal-Mart, $55
- Meijer, $54
- Whole Foods, $54
- Trader Joe’s, $50
- Kroger, $50
That Costco tops the list is not surprising. After all a shopper can’t buy just a couple of containers of yogurt and a few peaches at a store where bulk sales are the only option. Sam’s Club operates on a similar model, and its average ticket per trip is about a third less than Costco’s average. Why that is the case in not a function of size: Costco has about 700 stores around the world compared with 655 Sam’s Club and nearly 11,000 Wal-Mart locations.
Conversely, when Perfect Price calculated the number of trips that averaged less than a $10 ticket, Costco finished last, with just 9.2% of tickets in that range. Sam’s Club was just a bit higher at 9.6%.
But the most interesting point in the research is best shown by a chart that compares Costco, Wal-Mart, Whole Foods and Trader Joe’s. The last three all have average tickets per trip in the range of $50 to $55. How similar is the distribution of the tickets at these stores and how do they compare to Costco?
To figure that out, Perfect Price charted spending per ticket in six groupings against the percentage of trips in each grouping. The six groups are $0 to $10, $10 to $25, $25 to $50, $50 to $100, $100 to $200 and over $200. Here’s the chart:
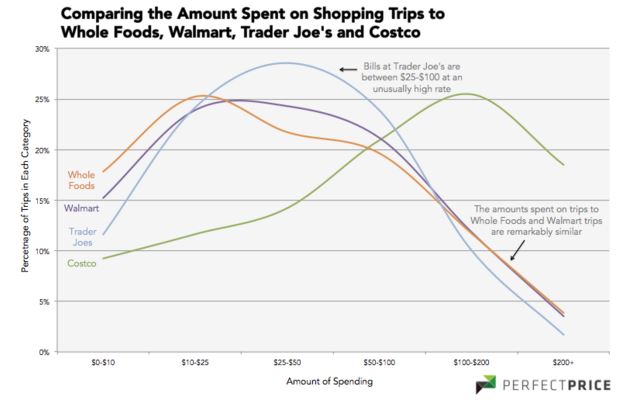
The distribution curves for Whole Foods (orange) and Wal-Mart (purple) are very similar, topping out with about 25% of all tickets at around $25 per ticket. Trader Joe’s tops out at around $50 for about 29% of all tickets. Costco rises to more than 25% of sales at about $200 and about 18.5% of all trips to Costco yield a ticket of more than $200.
Costco and Sam’s Club customers probably make fewer trips to the store than do Wal-Mart or Whole Foods customers. Unless you’re running a restaurant, you probably don’t need to buy mustard by the gallon more than once every few years.
Still, Whole Foods shoppers actually spend a dollar less per trip than do Wal-Mart shoppers. Why that is so is left as an exercise for the reader.
Perfect Price has also listed the 20 cities where people spend the most at Whole Foods.
Sponsored: Find a Qualified Financial Advisor
Finding a qualified financial advisor doesn’t have to be hard. SmartAsset’s free tool matches you with up to 3 fiduciary financial advisors in your area in 5 minutes. Each advisor has been vetted by SmartAsset and is held to a fiduciary standard to act in your best interests. If you’re ready to be matched with local advisors that can help you achieve your financial goals, get started now.