Special Report
States With the Highest (and Lowest) Voter Turnout
Published:
Last Updated:
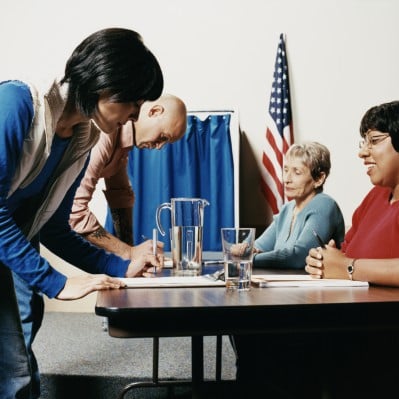
Just 71% of voting-age U.S. citizens are registered to vote, and an even smaller share actually makes it to the voting booth on election day. In the 2012 presidential election, 61.8% of eligible U.S. residents went to the polls. The nation’s voter turnout rate trails rates in most developed nations where voter turnout rates tend to be at least 80%.
24/7 Wall St. reviewed average voter turnout rates over the past four presidential election cycles in every state in the nation. Voter participation ranged from approximately three-quarters of eligible Minnesota residents, the highest nationwide, to half of potential voters in Hawaii, the lowest voter turnout rate in the country.
According to Elaine Kamarck, senior fellow at the Brookings Institution, there are two primary predictors of voter turnout. First, the more competitive a particular political contest is, the greater the turnout tends to be. “[If] everybody thinks their vote matters, you get a higher turnout,” Kamarck said. This explains why voter turnout is lower in elections in which candidates run unopposed, as well as why voter turnout rates during primary elections fall over time as candidates generate momentum and it becomes clear who the nominee will ultimately be.
Click here to see voter turnout in each state.
Kamarck explained that voter turnout is higher in competitive states due to another, related variable. States such as Iowa and New Hampshire, which have heated primary races, also tend to have high voter turnout during presidential elections. “The intense amount of politicking [in these states] has meant that they tend to go back and forth even in the presidential election because they tend to be states candidates campaign in,” Kamarck said.
The electoral college system means votes in some states are weighted more than in others. Compared to Texas or California, for example, a single electoral vote in Wyoming is earned with far fewer individual votes. “A vote in Rhode Island, Wyoming, Delaware, all the small states, is much more valuable than your vote is in California,” Kamarck said.
While voting in these smaller states may matter more, the larger weight has not necessarily resulted in higher turnout rates. The average voter turnout rates in Wyoming, Delaware, and Rhode Island — at 63.2%, 66.6%, and 64.4%, respectively — were only slightly higher than or just in line with the national average of 62.3%. That is likely because each of these three states are not especially competitive. Delaware and Rhode Island reliably vote for a Democrat, and a majority of Wyoming voters have supported the Republican candidate in all but eight presidential elections since 1892.
After competitiveness, the strongest predictor of voter turnout is the level of education of area residents, which in turn drives up incomes for participating members of the electorate. While states with above average college attainment rates do not necessarily have above average voter turnout rates, college-educated state residents in every state are more likely to participate in presidential elections than their less-educated peers in every state without exception.
Other democracies around the world typically hold elections on the weekend or declare election day a national holiday. By contrast, presidential elections in the United States are held on Tuesdays, during the work day. Largely because of how elections are held in the United States, individuals living in poverty are far less likely to vote than higher income individuals — not because of low education but rather, at this extreme low end of the income spectrum, due to lack of flexibility in the workplace.
Largely because of how elections are held in the United States, individuals living in poverty are far less likely to vote than higher income individuals due to lack of flexibility in the workplace. “People who are paid on an hourly basis can’t take off time to vote, so often they don’t vote,” Kamarck said. Indeed the most prevalent reason among voters for not going to the polls was conflicting work or school schedules.
To identify the states with the highest and lowest voter turnout rates,24/7 Wall St. reviewed the average percentage in each state of voting-age citizens who cast a ballot in the past four presidential elections, as well as the percentage of votes for the Republican and Democratic nominees in each of these races. All voter turnout data came from the Current Population Survey (CPS), conducted by the U.S. Census Bureau every month. Also from the CPS, we looked at reasons people cited for not voting, as well as average weekly wages per state and nationwide. The percentage of adults who have at least a bachelor’s degree and poverty rates came from the U.S Census Bureau’s 2014 American Community Survey (ACS). Unemployment rates came from the Bureau of Labor Statistics (BLS).
These are the states with the highest (and lowest) voter turnout.
1. Minnesota
> Voter turnout: 74.5%
> 2012 winning candidate’s party: Democrat
> Avg. weekly wage: $808
> Unemployment rate: 4.1%
Nearly three-quarters of eligible Minnesota residents cast a ballot on average over the past four general election cycles, the highest voter turnout rate of any state in the nation. By contrast, 62% of eligible Americans voted in presidential elections over that period. Minnesota is one of 13 states with a caucus system. Not only are delegate votes usually determined by the outcome, but also party meetings frequently attract highly influential party members. The fanfare generated by the caucuses each election cycle may contribute to the state’s high voter turnout.
One potential reason for the state’s high voter turnout is its decision to allow same-day voter registration. This policy, maintained by Minnesota and 14 other states, has been shown to boost turnout by 7% to 14%. Many states adopted this practice only after the 2012 election — the North Star State has maintained same-day registration since 1974.
2. Wisconsin
> Voter turnout: 73.0%
> 2012 winning candidate’s party: Democrat
> Avg. weekly wage: $832
> Unemployment rate: 5.5%
For the past quarter of a century, Wisconsin voters favored a Democrat during presidential elections. Wisconsin was one of only a handful of states to prefer Democratic presidential hopeful Michael Dukakis in the 1988 presidential election over George H.W. Bush. States that lean heavily in favor of one party often have lower turnout as a result of low competition. Wisconsin, however, has one of the best participation records in the country. In each of the last four presidential elections, more than 70% of Wisconsin’s eligible voters went to the polls — the only state to exceed 70% voter turnout in all four cycles.
3. Maine
> Voter turnout: 70.8%
> 2012 winning candidate’s party: Democrat
> Avg. weekly wage: $792
> Unemployment rate: 5.7%
In both Maine and the nation as a whole, college graduates are more likely to vote. However, despite the fact that Maine’s educational attainment rate is slightly below average, it still boasts one of the highest voter participation rates in the country. Voter turnout in Maine has been among the highest in the nation in the four most recent presidential elections. Political engagement peaked in Maine in 2004, when 73.1% of eligible voters came to the polls. Historically, Maine is a blue state, opting for the Democratic presidential candidate by at least 5 percentage points in each of the last four presidential elections.
4. New Hampshire
> Voter turnout: 69.8%
> 2012 winning candidate’s party: Democrat
> Avg. weekly wage: $935
> Unemployment rate: 4.3%
In the last four presidential elections, an average of 69.8% of eligible voters in New Hampshire cast a ballot. Historically, New Hampshire has been a swing state, and voter turnout is arguably more decisive in the state’s elective outcome than in the rest of the country. In the last four presidential elections, no candidate has won New Hampshire by a margin larger than 10 percentage points.
Like in most states, voter turnout among wealthier New Hampshire residents was greater than that of less wealthy residents. In the 2004 and 2008 presidential elections, an estimated 100% of eligible residents making between $130,000 and $150,000 a year voted.
5. Iowa
> Voter turnout: 69.6%
> 2012 winning candidate’s party: Democrat
> Avg. weekly wage: $727
> Unemployment rate: 4.4%
The Iowa caucuses are the first event in the election process for the President of the United States, setting the tone for the election season. The national attention given to the outcomes likely helps stimulate participation among Iowa’s potential voters. During the most recent caucus held February 1, observers reported crowded venues, extremely long lines, and insufficient numbers of ballots, indicating stronger than average participation. Over the past four general elections, an average of nearly 70% of eligible voters cast their ballot. The best turnout was in 2004, when 71.3% of the electorate cast a ballot. In three of the past four elections — 2000, 2008, and 2012 — a larger share of voters supported the Democratic presidential candidate than the Republican one.
6. Oregon
> Voter turnout: 69.1%
> 2012 winning candidate’s party: Democrat
> Avg. weekly wage: $876
> Unemployment rate: 6.9%
Presidential elections tends to yield a significantly higher voter turnout than midterms. Nationally, voter turnout gets a 16 percentage point bump during presidential elections. In Oregon, a higher share of residents vote during midterm elections than the voter turnout in many states during presidential election years. In the 2006 midterm election, nearly 60% of Oregon’s eligible voters went to the polls, more than eight states’ turnouts during the 2004 presidential election. During that election, 74% of Oregon’s electorate went to the polls, more than all but three other states.
7. North Dakota
> Voter turnout: 68.3%
> 2012 winning candidate’s party: Republican
> Avg. weekly wage: $828
> Unemployment rate: 2.8%
In the last four presidential elections, political engagement in North Dakota has been relatively high, averaging 68.3% participation among eligible voters. However, since 2004 when voter turnout peaked at 71.4%, participation has declined in each election cycle in North Dakota. In November 2012, only 63.9% of eligible voters made it to the polls.
A solidly conservative state, North Dakota preferred the Republican candidate in each of the last four presidential elections. Most recently, Mitt Romney defeated Barack Obama in North Dakota by nearly 20 percentage points.
8. Massachusetts
> Voter turnout: 68.1%
> 2012 winning candidate’s party: Democrat
> Avg. weekly wage: $956
> Unemployment rate: 5.8%
Highly educated individuals are among the most likely to vote in U.S. elections. The relatively well-educated Massachusetts population may partially explain the high voter turnout in the state. An estimated 41.2% of adults have at least a bachelor’s degree, well above the national college attainment rate of 30.1%. Massachusetts is also widely considered a Democratic stronghold, supporting the Democratic presidential candidate by a large margin in each of the past four elections.
9. Mississippi
> Voter turnout: 67.2%
> 2012 winning candidate’s party: Republican
> Avg. weekly wage: $717
> Unemployment rate: 7.8%
Voter turnout in Mississippi has increased in each presidential election since George W. Bush took office roughly a decade and a half ago. In 2000, only 60.6% of eligible voters in Mississippi cast a ballot, a considerably smaller share than the 74.5% that made it to the polls in November 2012.
As is the case in every other state, voter turnout dips considerably in Mississippi in non-presidential election years. In November 2014, only 42.3% of eligible voters made it to the polls. Of those who did not vote that year, 22.3% said they were too busy, and 13.2% claimed they simply forgot.
10. Louisiana
> Voter turnout: 66.7%
> 2012 winning candidate’s party: Republican
> Avg. weekly wage: $808
> Unemployment rate: 6.4%
Individuals who live in poverty are far less likely to vote than more affluent individuals. In Louisiana, nearly one in five residents lives in poverty, the third highest poverty rate in the country. Unlike most other states with relatively high poverty rates, however, more than two-thirds of eligible Louisianans vote in presidential elections, one of the higher voter turnout rates compared to other states.
Louisiana had an exceptionally strong turnout among low-income voters in the 2012 presidential election. Some 71.3% of eligible individuals earning between $13,000 and $26,000 annually voted, more than the 61.8% voter turnout nationwide among all income groups. To compare only 52.6% of Americans earning such low incomes voted in 2012.
11. Colorado
> Voter turnout: 66.6%
> 2012 winning candidate’s party: Democrat
> Avg. weekly wage: $926
> Unemployment rate: 5.0%
Voter turnout has increased in every presidential election in Colorado, from 57.2% participation in 2000 to 70.4% participation in the 2012 election. Of the last four elections, an average of 66.6% of eligible voters made it to the polls, a larger share than in the vast majority of states. Voter preferences in Colorado tend to match those of the country as a whole as the state went to Bush in 2000 and 2004 and to Obama in 2008 and 2012.
Last summer, after the Republican Party officially ruled that state delegates must support the candidate that wins the caucus vote, Colorado forfeited its role in selecting the GOP’s presidential candidate. States that hold caucuses tend to have higher voter turnouts in general elections, and since it opted entirely out of the nomination process, Colorado’s participation rate may take a hit in 2016.
12. Delaware
> Voter turnout: 66.6%
> 2012 winning candidate’s party: Democrat
> Avg. weekly wage: $824
> Unemployment rate: 5.7%
Since 2000, an increasingly large share of Delaware residents has gone to the polls than the U.S. has as a whole. Delaware also surpasses the nation in other measures typically associated with higher voter turnout. Wealthy, well-educated citizens are more likely to turn up at the polls on election day, and the $59,716 median household income and 30.6% collegiate attainment rate in the state are both higher than their corresponding national figures.
Delaware is a consistently blue state, and a Democrat has won there in the last four presidential elections. Of those elections, a Democrat won by the largest margin in 2008, when Obama beat Romney by 25.0% of the vote.
13. Missouri
> Voter turnout: 66.2%
> 2012 winning candidate’s party: Republican
> Avg. weekly wage: $781
> Unemployment rate: 6.1%
Averaged over the last four presidential elections, voter turnout in Missouri has been higher than the national voter turnout and among the highest of any state. Since 2004, however, that margin has narrowed. In the 2012 election, 63.9% of eligible state voters cast a ballot, just about 2 percentage points higher than the 61.8% national turnout rate.
Missouri is a traditionally Republican state, and a Republican candidate has won the state in the last four presidential elections. In the two elections where a Democrat won the national election, voter turnout in Missouri was the lowest.
14. Montana
> Voter turnout: 66.2%
> 2012 winning candidate’s party: Republican
> Avg. weekly wage: $750
> Unemployment rate: 4.7%
A traditionally red state, a Republican candidate has won Montana in the past four presidential elections. The state was won by a large margin in every year with the exception of 2008, when McCain beat Obama by just 2.4% of the vote.
Average voter turnout over the last four presidential elections was 66.2% in Montana, a larger share than most other states. Montana voters are also more likely to vote in midterm elections than most Americans. Voter participation in all non-presidential elections since 1998 exceeded 50% in Montana. Meanwhile, over the same time period, nationwide turnout never exceeded 50% during midterm elections, reaching the lowest point in 2014 when only 41.9% of eligible Americans made it to the polls.
15. Michigan
> Voter turnout: 66.1%
> 2012 winning candidate’s party: Democrat
> Avg. weekly wage: $804
> Unemployment rate: 7.3%
A Democratic candidate has won the majority vote in Michigan in the last four presidential elections. Michigan’s voter turnout has consistently been greater than the national overall turnout. Turnout amongst the state’s black voters peaked in 2008, when Obama won both the state and the national election.
Michigan was one of the states hit hardest by the recession, and in 2010 the unemployment rate had reached an abysmal 12.6%. In the midterm election that year, voter turnout among the state’s unemployed workers was the lowest it has been for at least 10 years.
16. Washington
> Voter turnout: 65.6%
> 2012 winning candidate’s party: Democrat
> Avg. weekly wage: $950
> Unemployment rate: 6.2%
In Washington, women are more likely to vote than men. In the last four presidential elections, the share of the female electorate going to the polls exceeded that of male eligible voters. In 2008, 63.5% of eligible men voted, compared to 70.0% of their female counterparts. Overall, Washingtonians are more likely to vote than most Americans, with an average turnout rate of 65.6% in presidential elections compared to 62.2% of Americans. Voter participation peaked in Washington in 2004, when 67.6% of eligible voters made it to the polls. Though Bush was elected to a second term that year, the majority of Washington voters supported Democratic candidate John Kerry.
17. Maryland
> Voter turnout: 65.2%
> 2012 winning candidate’s party: Democrat
> Avg. weekly wage: $980
> Unemployment rate: 5.8%
Educational attainment is as primary determinant of voter turnout. In Maryland, the 38.2% collegiate attainment rate is the third highest in the U.S. Not surprisingly, Maryland’s 65.2% average voter turnout rate over the last four presidential elections was higher than the 62.2% national voter turnout rate. Turnout in the state peaked in 2008, when Obama won Maryland by a 25.2 percentage point margin.
Maryland is typically a Democratic stronghold, and a Democratic candidate has won the state in each of the last four presidential elections. In the most recent gubernatorial election, however, low voter turnout among state Democrats resulted in a surprising victory for Republican candidate Larry Hogan.
18. Virginia
> Voter turnout: 65.0%
> 2012 winning candidate’s party: Democrat
> Avg. weekly wage: $921
> Unemployment rate: 5.2%
Virginia is by many measures a swing state. In 2012, 51.2% of state voters preferred Obama, the president’s third-smallest margin of victory that year. In more politically neutral states, potential voters may be more likely to go to the polls because they feel they have more of a say. Another factor potentially driving up Virginia’s voter turnout rate is the state’s relatively low incidence of poverty. Very low income individuals are less likely to have jobs that allow them the flexibility to take time off to cast a ballot. Just 11.8% of Virginia’s residents live below the poverty line, compared to 15.5% of the U.S. population.
19. Vermont
> Voter turnout: 64.9%
> 2012 winning candidate’s party: Democrat
> Avg. weekly wage: $827
> Unemployment rate: 4.1%
Home to U.S. Senator and presidential hopeful Bernie Sanders, Vermont will likely have a strong turnout in the upcoming primary elections. Over the past four presidential elections, however, the state’s voter turnout, at 65%, was only slightly higher than the national average turnout. Political systems vary considerably across U.S. regions. As in a number of other New England states, many Vermonters participate in Town Meeting Day each year, which is a state holiday in Vermont. Voters gather and help make decisions for their town or locality. A majority of voters in Vermont supported the Democratic candidate in each of the past four presidential elections.
20. Alaska
> Voter turnout: 64.6%
> 2012 winning candidate’s party: Republican
> Avg. weekly wage: $840
> Unemployment rate: 6.8%
Wealth is a strong determinant of voter turnout, and the median household income in Alaska of $71,583 a year is the third highest in the country. Not surprisingly, Alaska’s 64.6% average voter turnout rate is higher than the 62.2% national turnout rate overall.
Voter turnout dropped significantly in the most recent presidential election, when just 58.4% of eligible Alaskans voted — the lowest in the last four elections. Turnout amongst younger voters dropped even more, as 32.5% of eligible 18 to 24 year olds voted, more than 20 percentage points lower than the state’s youth turnout rate two elections ago. That decline in turnout may have benefitted Democrats, as Romney won the state by the smallest margin in at least the last four Alaska elections.
21. Rhode Island
> Voter turnout: 64.4%
> 2012 winning candidate’s party: Democrat
> Avg. weekly wage: $850
> Unemployment rate: 7.7%
While an average of 62.2% of eligible Americans voted in the past four presidential elections, 64.4% of eligible Rhode Islanders made it to the polls. A solid blue state, Rhode Islanders strongly preferred the Democratic presidential candidate in each of the past four presidential elections.
As is the case across the country, state residents with higher incomes were more likely to vote than those with lower incomes. In the last presidential election, only 52% of eligible Rhode Island voters earning $250 or less per week made it to the polls. Meanwhile, it is estimated that every eligible voter in the state earning between $1,750 and $2,000 a week participated in the election.
22. South Dakota
> Voter turnout: 64.3%
> 2012 winning candidate’s party: Republican
> Avg. weekly wage: $740
> Unemployment rate: 3.4%
South Dakota’s voter turnout has on the whole mirrored that of the U.S., not exceeding the national rate by more than five percentage points in the last four presidential elections. In 2012, 61.0% of eligible voters in the state went to the polls compared to a nationwide turnout rate of 61.8%. Those without work appear to be less inclined to go to the national polls, and the minimal political involvement among that group is certainly the case in South Dakota. Nationally, 41.9% of eligible Americans voted in the 2014 midterm election, while just 30.0% of those without jobs went to the polls. In South Dakota, just 14.3% of eligible unemployed residents voted that year.
23. North Carolina
> Voter turnout: 64.3%
> 2012 winning candidate’s party: Republican
> Avg. weekly wage: $799
> Unemployment rate: 6.1%
Since the 2000 election, an increasingly large share of eligible North Carolina voters went to the polls, and in 2008 the state’s voter turnout rate surpassed the U.S. turnout rate overall. In the most recent election, North Carolina’s 68.9% voter turnout was about 7 percentage points higher than the 61.8% national rate.
Even more dynamic is the increased voter turnout of young and black voters in the state during the last two presidential elections. In 2000, when Bush beat Democratic rival Al Gore, 30.6% of eligible 18 to 24 year olds cast a ballot. In the 2008, when Obama defeated John McCain, that figure increased to 52.9%. Similarly, voter turnout among black voters in North Carolina increased from 64.4% in the 2004 Bush Kerry election to 80.2% in the most recent Obama Romney election.
24. Nebraska
> Voter turnout: 63.8%
> 2012 winning candidate’s party: Republican
> Avg. weekly wage: $875
> Unemployment rate: 3.3%
Voter turnout in Nebraska has somewhat paralleled the national voter turnout rate in the last four elections. Political preferences, however, have not. A Republican candidate has won the state in the last four elections. Bush won by the largest margin of any Republican candidate in that time, beating Kerry in the state in the 2004 election by a margin of 33.2 percentage points. The smallest margin of victory occurred in 2008, when McCain beat Obama by 14.9 percentage points.
25. Ohio
> Voter turnout: 63.6%
> 2012 winning candidate’s party: Democrat
> Avg. weekly wage: $879
> Unemployment rate: 5.7%
A notorious swing state, Ohio was won by the Republican candidate in 2000 and 2004, and the Democratic candidate in 2008 and 2012. In those elections, the victorious candidate never won by a margin greater than 4.6 percentage points. The closest recent presidential race in Ohio was in 2004, when Bush beat Kerry by a slim 2.1 percentage points.
Despite the state’s importance and the relative significance of each individual vote, voter turnout in Ohio is only slightly higher than it is across the country. An average of 63.6% of eligible voters made it to the polls in the last four presidential elections, a slightly higher share than the 62.2% of American voters who did.
26. New Jersey
> Voter turnout: 63.5%
> 2012 winning candidate’s party: Democrat
> Avg. weekly wage: $1,004
> Unemployment rate: 6.6%
Compared to the average American, New Jersey residents are more educated and also wealthier. The average weekly wage in the state of more than $1,000 is well above the national average wage. Also, 37.4% of adults have at least a bachelor’s degree, higher than the national attainment rate of 30.1%. While more educated, more affluent individuals are the most likely to cast a vote in presidential elections, the average voter turnout rate in New Jersey of 63.5% is just in line with the national turnout rate. Of the eligible voters who did not participate in the most recent midterm election, 28.9% cited work or school schedule conflicts as their reason for not voting, similar to the national share of respondents who said the same.
27. South Carolina
> Voter turnout: 63.5%
> 2012 winning candidate’s party: Republican
> Avg. weekly wage: $719
> Unemployment rate: 6.4%
South Carolina is a Republican stronghold, and a Republican candidate has won the state in each of the past four presidential elections.
South Carolina was one of the states hit hardest by the Great Recession. In the 2006 midterm election, voter turnout among the state’s unemployed workers was just 25.4%. By the 2010 election, when unemployment peaked in the state, the unemployed voter turnout rate was 41.2%. A similar increase occurred in the state’s presidential elections, from a 49.1% unemployed turnout rate in 2008 to 65.5% in 2012.
28. Connecticut
> Voter turnout: 63.3%
> 2012 winning candidate’s party: Democrat
> Avg. weekly wage: $981
> Unemployment rate: 6.6%
Voter turnout in Connecticut is not especially high. An average of only 63.3% of eligible voters turned out to vote in the last four presidential elections, only a slightly larger share than the 62.2% of eligible Americans who did. Roughly one-quarter of survey respondents who failed to cast a ballot in the 2014 midterm elections claimed that they neglected to vote because they thought their vote would not make a difference. A solidly blue state, a Republican has not won Connecticut since Bush in 1988. Additionally, in each of the last four presidential elections, the Democratic presidential candidate won by at least 10 percentage points in the state.
29. Wyoming
> Voter turnout: 63.2%
> 2012 winning candidate’s party: Republican
> Avg. weekly wage: $973
> Unemployment rate: 4.3%
Wyoming is one of the most clearly conservative states in the country. In each of the past four presidential elections, a Republican earned at least 64.8% of the votes. In 2012, Romney won 68.6% of the votes, a higher margin of victory for the candidate in every state but Utah. While Wyoming’s presidential elections appear to be less competitive than in other states, this does not seem to curb political participation. In a survey distributed to those who did not vote, a lower share of respondents claimed political apathy — the feeling that their vote wouldn’t make a difference — as the reason for not going to the polls.
30. Kansas
> Voter turnout: 63.1%
> 2012 winning candidate’s party: Republican
> Avg. weekly wage: $785
> Unemployment rate: 4.5%
Over the last four presidential elections, voter turnout in Kansas peaked in 2004, when 64.2% of the electorate made it to the polls. Over the same four elections, average voter turnout in Kansas has been roughly line with the national average of 62.2%. In a survey distributed to those who did not vote in the most recent election, a bulk of respondents claimed disliking the candidates or being too busy with work or school as reasons for not going to the polls.
31. Illinois
> Voter turnout: 63.0%
> 2012 winning candidate’s party: Democrat
> Avg. weekly wage: $830
> Unemployment rate: 7.1%
Illinois’ voter participation rate was in line with that of the nation in each of the last two midterm elections and slightly below the national turnout in the 2008 and 2012 presidential elections. This might be surprising to some, given President Obama’s political history in the state. He served in the Illinois State Senate from 1997 through 2004, and then in the U.S. Congress as an Illinois senator from 2004 until his presidency. It may actually be the president’s home field advantage — as well as the state’s Democratic leaning — that kept voter turnout so low in Illinois. Nearly 22% of those who did not vote in 2012 said they did not think their vote would matter, compared to 16.2% of U.S. non-voters who said the same.
32. Florida
> Voter turnout: 62.2%
> 2012 winning candidate’s party: Democrat
> Avg. weekly wage: $858
> Unemployment rate: 6.3%
The entire outcome of the presidential election in 2000 came down to Florida, where an incredibly close vote merited a recount that dragged on for weeks. In that year, voter turnout was 59.6%, the lowest of the last four presidential elections. Bush was ultimately declared winner by a Supreme Court decision, securing Florida’s 25 electoral votes as well as the presidency.
Florida is a swing state, and the candidate to win it has gone on to win the general election in the last four elections. In 2004, Bush won by 5 percentage points, the most commanding victory compared to the general elections in 2000, 2008 and 2012. On average, voter turnout in the state is similar to the national voter turnout rate.
33. Alabama
> Voter turnout: 62.0%
> 2012 winning candidate’s party: Republican
> Avg. weekly wage: $803
> Unemployment rate: 6.8%
A Democratic presidential candidate has not won Alabama since Jimmy Carter beat Gerald Ford in 1976. In each of the last four presidential elections, the Republican candidate won the state by at least 14.9 percentage points. A consistently conservative state, it is perhaps no surprise that one of the most common reasons cited for not voting was that people felt their vote would not make a difference. Average voter turnout in the state in the last four presidential elections was 62.0%, a marginally smaller share than the 62.2% voter turnout across the country.
Higher educational attainment rates typically correlate with higher rates of voter engagement. Just as voter turnout is lower in Alabama than it is across the nation, so is educational attainment. Only 23.5% of adults in Alabama have at least a bachelor’s degree compared to the 30.1% national college attainment rate.
34. Pennsylvania
> Voter turnout: 61.6%
> 2012 winning candidate’s party: Democrat
> Avg. weekly wage: $825
> Unemployment rate: 5.8%
Higher educational attainment typically leads to increased participation in the the democratic process. In Pennsylvania, 29.0% of adults have at least a bachelor’s degree, roughly in line with the 30.1% of adults nationwide with similar educational attainment. Voter turnout in the state is also similar to national voter turnout. In the past four presidential elections, an average of 61.6% of eligible Pennsylvanians went to the polls compared to 62.2% of the country-wide electorate. Like in most of the country, younger and poorer voters in Pennsylvania are less likely to vote than the state population overall.
35. New Mexico
> Voter turnout: 61.1%
> 2012 winning candidate’s party: Democrat
> Avg. weekly wage: $753
> Unemployment rate: 6.5%
New Mexico’s average voter turnout rate over the last four presidential elections was lower than in the majority of states. Participation bottomed out in the 2000 election when less than 55% of the state electorate went to the polls compared to just under 60% of the U.S. electorate. In the last three cycles, the state’s turnout rate has been within a percentage point of the national voter turnout rate. New Mexico’s turnout may be bolstered by its status as a swing state. Though the largest share of voters preferred Gore, the Democratic candidate, in 2000, the state went to Bush, the Republican candidate, four years later.
New Mexico voters appear to recognize their impact on the election. Only 5.7% of those who did not vote in the state in 2012 said they abstained because they did not think their vote would make a difference, compared to a national share of 16.2%.
36. Kentucky
> Voter turnout: 61.1%
> 2012 winning candidate’s party: Republican
> Avg. weekly wage: $821
> Unemployment rate: 6.5%
Like in most states, younger Kentuckians are less likely to vote than the voting-age population as a whole. While total eligible voter participation ranged from 56.4% to 65.0% in the last four presidential elections, participation was considerably lower among 18-24 year olds. Only 34.1% to 55.8% of the age group made it to the polls.
Kentucky is a traditionally red state, and a Republican candidate has won there in each of the past four presidential elections. The election in 2000, when Bush won by a 15.1 percentage point margin. While this was a commanding victory, it was actually the closest in the state’s recent history.
37. Idaho
> Voter turnout: 61.1%
> 2012 winning candidate’s party: Republican
> Avg. weekly wage: $732
> Unemployment rate: 4.8%
Idaho’s voter turnout rate over the past four presidential elections has been, on average, lower than that of the nation. In the 2012 presidential elections, however, a higher share of the state electorate actually went to the polls, at 63.9% of eligible Idaho residents compared to 61.8% of eligible Americans. Those with an advanced education are more likely to participate in the democratic process. In 2012, more than 77% of Americans with a college degree voted. This may partially explain the state’s below average voter turnout. In Idaho, just 25% of the adult population has a college degree, more than 5 percentage points below the national share.
38. California
> Voter turnout: 60.3%
> 2012 winning candidate’s party: Democrat
> Avg. weekly wage: $922
> Unemployment rate: 7.5%
An average of just over 60% of eligible California voters cast a ballot in the past four presidential elections, lower than the turnout rate in most states. Americans who believe their vote matters are far more likely to participate in elections than others. This explains the higher turnout rates during highly competitive political contests, and it could partially account for the relatively low turnout rate in California. Despite having the most electoral votes of any state, Californians, along with New Yorkers and Floridians, actually have one of the weakest votes of any state when adjusting the number of electoral votes to the state’s population. Also, California almost always votes Democrat. Since the general election outcome in the state could be a forgone conclusion for many Californians, the motivation to vote could be lower as a result.
39. Utah
> Voter turnout: 59.6%
> 2012 winning candidate’s party: Republican
> Avg. weekly wage: $834
> Unemployment rate: 3.8%
Utah is one of only 11 states where the average voter turnout rate was below 60%. Voter participation in the state, which is right-leaning, peaked in 2004. That year, 67.8% of the electorate made it to the polls, the majority of whom voted Republican. As has been the case across the country, Utah residents with a bachelor’s degree vote at a higher rate than residents with lower educational attainment. In the 2012 general election, 73.5% of eligible Utah voters with at least a bachelor’s degree made it to the polls, versus the statewide turnout rate of 57.0%.
Among eligible voters in Utah who did not vote, 34.7% cited a work or school schedule conflict as their reason for not voting in the most recent election year.
40. Indiana
> Voter turnout: 59.5%
> 2012 winning candidate’s party: Republican
> Avg. weekly wage: $786
> Unemployment rate: 6.0%
Indiana’s voting-age population is slightly less likely to vote than eligible Americans nationwide. While an average of only 59.5% of the electorate made it to the polls in Indiana, a higher share of college educated state residents voted than was typical across the nation. In 2012, 80.6% of eligible Indiana voters with a college degree voted compared to 77.1% of voters across the country with similar educational attainment.
Indiana voters tend to prefer conservative candidates. Both in 2000 and in 2004, more than half of all ballots cast in the state went to Bush. The state shifted to the left in 2008 as Obama won by a single percentage point. However, four years later Obama lost to Romney by more than 10 percentage points during the 2012 general election.
41. Georgia
> Voter turnout: 59.3%
> 2012 winning candidate’s party: Republican
> Avg. weekly wage: $793
> Unemployment rate: 7.2%
An average of only 59.3% of eligible voters in Georgia turned out to vote in the past four presidential elections, and more than half of voters preferred the Republican presidential candidate every time. Georgia has not always gone to the conservative candidate, however. Bill Clinton beat Bush, the incumbent candidate, in the the Peach State in 1992.
While voter turnout in Georgia is relatively low in presidential elections, as in every other state, an even smaller share of eligible voters turnout for midterm elections. The lowest participation rate in the last 18 years was in the 1998 midterms, when only 38.6% of the electorate made it to the polls.
42. New York
> Voter turnout: 59.2%
> 2012 winning candidate’s party: Democrat
> Avg. weekly wage: $924
> Unemployment rate: 6.3%
An average of just 59.2% of eligible New York voters have gone to the polls in the past four presidential elections, one of the lower turnout rates in the country. With the Democratic candidate winning New York State in each of the last four elections by a margin of no less than 18.3 percentage points, New York is reliably a blue state.
In late October 2012, Hurricane Sandy ravaged the East Coast and ultimately became the second costliest storm in U.S. history. In the election that followed a week later, a relatively large share of New Yorkers who did not vote cited bad weather as their reason for not voting. The only state to ever report a larger share of potential voters deterred by bad weather in the last four elections was neighboring New Jersey, also in 2012.
43. Arizona
> Voter turnout: 58.4%
> 2012 winning candidate’s party: Republican
> Avg. weekly wage: $836
> Unemployment rate: 6.9%
With the exception of Clinton in 1996, a majority of Arizona voters have preferred the Republican candidate in every presidential election since 1952. In the last four presidential elections, voters in the state preferred the Republican nominee over the Democratic candidate by at least 6.3 percentage points.
Voter turnout among younger residents has improved in both Arizona and the country overall since 2000. In the Bush Gore election, just 25.6% of eligible 18 to 24 year olds in Arizona went to the polls. In the most recent election, that figure was 43.0%. Nationally, youth voter turnout in presidential elections has increased from 36.1% in 2000 to 41.2% in 2012.
44. Oklahoma
> Voter turnout: 58.3%
> 2012 winning candidate’s party: Republican
> Avg. weekly wage: $813
> Unemployment rate: 4.5%
Since a majority vote for Democrat Lyndon B. Johnson in 1964, Oklahoma has had an uninterrupted history of voting for the Republican presidential candidate. In the last four elections, a Republican won the state with at least 60% of the votes.
Educational attainment is one of the strongest predictors of voter participation. Just 24.2% of Oklahoma adults have at least a bachelor’s degree, a smaller share than the 30.1% of adults nationwide. Perhaps as a result, Oklahoma’s voter turnout is only 58.3%, the seventh lowest in the country.
45. Nevada
> Voter turnout: 57.7%
> 2012 winning candidate’s party: Democrat
> Avg. weekly wage: $765
> Unemployment rate: 7.8%
Nevada has one of the lowest voter participation rates in the United States with just 57.7% of voting-age citizens going to the polls on average over the past four presidential elections. As is the case nationwide, participation in the state is even worse during non-presidential elections. During the 2014 midterm election, just 37.3% of eligible Nevadans voted, one of the lower shares that year and among the lowest of any state during a midterm or presidential election in the past 20 years. Education often leads to higher political involvement, and those with bachelor’s degrees are significantly more likely to vote than those with less education. Only 23.1% of Nevada’s adult population has graduated from college compared to 30.1% of all U.S. adults.
46. Texas
> Voter turnout: 55.3%
> 2012 winning candidate’s party: Republican
> Avg. weekly wage: $901
> Unemployment rate: 5.1%
An average of just about 55% of the Texas electorate managed to make it to the polls in the last four presidential contests. Voter turnout was even lower in the Lone Star State in the midterm elections. Participation bottomed out in November 2014, when only 34.6% of the state electorate made it to the polls. That year, 31.7% of those who did not vote in Texas cited a conflicting work or school schedule.
A solidly red state, the Republican presidential nominee has won Texas by at least an 11.8 percentage point margin in each of the last four elections. A Democratic candidate has not won the state since Carter beat Ford in 1976.
47. Tennessee
> Voter turnout: 54.9%
> 2012 winning candidate’s party: Republican
> Avg. weekly wage: $732
> Unemployment rate: 6.7%
In each of the last four presidential elections, Tennessee has never had more than 55.7% of eligible voters go to the polls. During the 2000 presidential election, just 53.7% of the Tennessee electorate voted compared to a national turnout rate of slightly less than 60%. This is particularly surprising given the fact that former Vice President Gore — who ran that year opposite eventual winner Bush — had been a legislator in the state for years. Gore was also a U.S. senator representing the state from 1984 until his assumption of the vice presidency after the 1992 election. Education often leads to higher political involvement, and those with bachelor’s degrees are significantly more likely to vote than those with less education. Just 25.3% of Tennessee residents 25 and older have graduated from college compared to 30.1% of all U.S. adults, which could partially explain the low voter turnout rate.
48. Arkansas
> Voter turnout: 54.3%
> 2012 winning candidate’s party: Republican
> Avg. weekly wage: $715
> Unemployment rate: 6.1%
Education is one of the best predictors of voter turnout. In Arkansas, the collegiate attainment rate of 21.4%, which is well below the 30.1% national figure, may partially explain the low voter turnout in the state. Political races in Arkansas are not especially competitive either, as the state has consistently supported the Republican nominee in general elections. In the last four presidential elections, a Republican won the state by an average margin of about 15 percentage points. Americans tend to vote when they feel their vote will matter, and the strong Republican base in Arkansas may cause residents to feel their votes are less influential. Of the voting-age population who did not vote in the 2012 election, 21.7% said they were too busy with work or school conflicts on voting day.
49. West Virginia
> Voter turnout: 52.9%
> 2012 winning candidate’s party: Republican
> Avg. weekly wage: $777
> Unemployment rate: 6.5%
With the exception of Hawaii, no state in the country has a lower average voter turnout rate than West Virginia. An average of only 52.9% of the electorate managed to make it to the polls in the four most recent presidential elections. As was the case across the country, voter turnout was even lower in midterm elections. Over the course of the last 18 years, participation bottomed out in the state in the 2014 midterm elections, when only 33.6% of eligible voters in the state made it to the polls. That year, a conflicting work or school schedule was the most commonly cited reason for not voting.
Though a majority of voters in West Virginia preferred the Republican presidential candidate in each of the last four races, before that, the state did not always side with the GOP. In 1988, West Virginia went to Dukakis, the Democratic nominee, and in both 1992 and 1996, West Virginia voters preferred Clinton, also a Democrat.
50. Hawaii
> Voter turnout: 50.0%
> 2012 winning candidate’s party: Democrat
> Avg. weekly wage: $844
> Unemployment rate: 4.4%
Americans are less likely to vote when they believe their vote will not make a difference in the final outcome. As a result, the least contested states tend to have lower turnout rates, while the most politically polarized states often have higher voter turnout rates. In Hawaii, where Obama beat Romney by nearly 43 percentage points in the most recent election, voter turnout is the lowest in the country. Hawaii has almost always been a strongly Democratic state.
To improve voter turnout, Hawaii lawmakers have recently passed legislation that will allow residents to register to vote on Election Day. Numerous academic studies have claimed such legislation can increase voter turnout by 7 to 14 percentage points.
Want retirement to come a few years earlier than you’d planned? Or are you ready to retire now, but want an extra set of eyes on your finances?
Now you can speak with up to 3 financial experts in your area for FREE. By simply clicking here you can begin to match with financial professionals who can help you build your plan to retire early. And the best part? The first conversation with them is free.
Click here to match with up to 3 financial pros who would be excited to help you make financial decisions.
Thank you for reading! Have some feedback for us?
Contact the 24/7 Wall St. editorial team.


 24/7 Wall St.
 24/7 Wall St.
 24/7 Wall St.