Source: Thinkstock
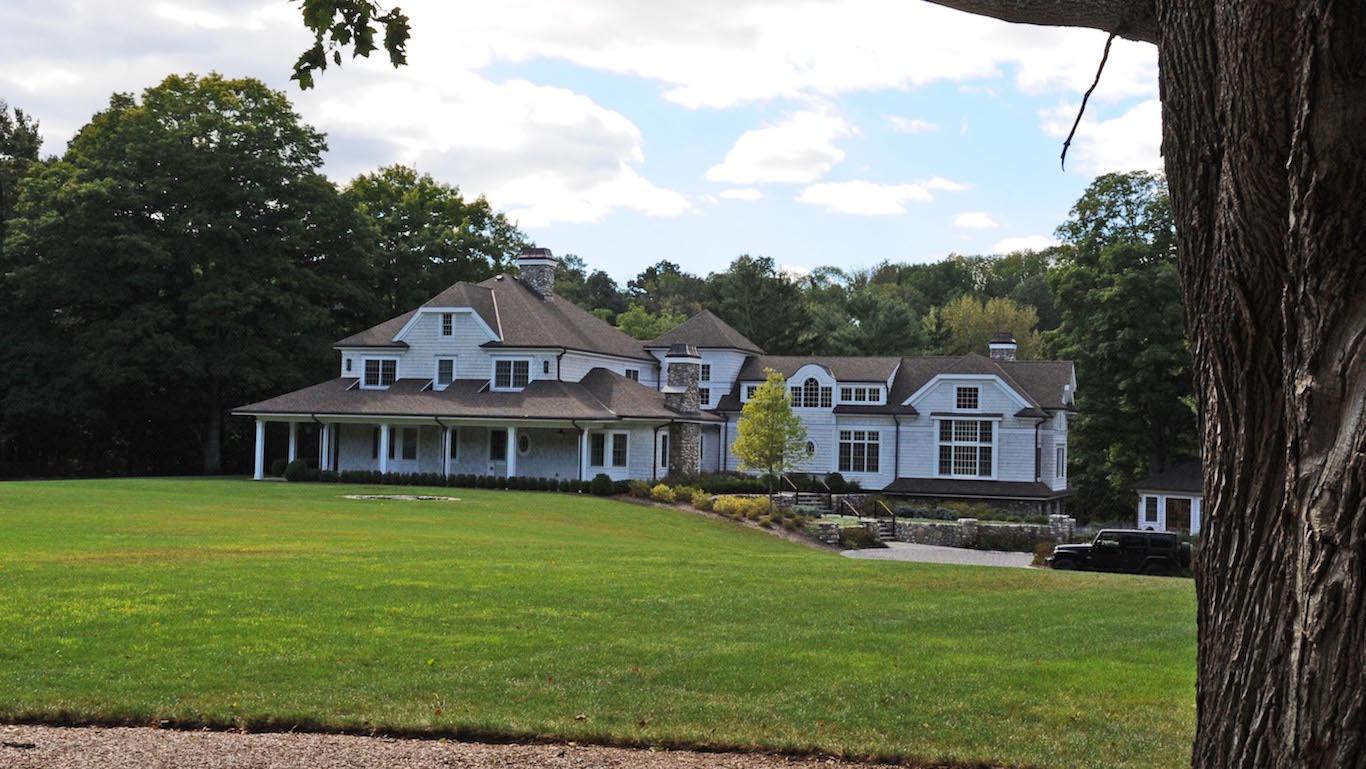
While the nation lags behind many higher-income nations in longevity, there are parts of the country where the typical person will live to be significantly longer than the nationwide average. Residents born in 17 counties across the U.S. can expect to live to be at least 82 years old. The average person born today in Montgomery County, Maryland, will live 83.3 years, the longest life expectancy of any county in the United States.
A number of factors contribute to life expectancy, but by far the strongest indicator is affluence. In all but one of the 17 counties with life expectancies of at least 82 years, the median household income is higher than the national median of $53,482. Virginia’s Loudoun and Fairfax counties, the two wealthiest U.S. counties, have among the longest-lived residents.
Click here to see the 17 counties where people die old.
Click here to see the 37 counties where people die young.
Individuals born into wealthier families can afford healthier food, have more exercise opportunities and medical treatment available to them, and are likely less exposed to physical and mental stress.
The benefits granted to life expectancy by higher incomes are not limited to personal wealth. Lower-income residents living in more affluent communities have been shown to live longer. This may be due at least in part to these individuals having access to better schools, healthy food choices, and medical facilities.
These counties all share very low infant mortality rates, which is closely tied to high overall longevity. None of the 17 counties have an infant mortality rate higher than the national annual rate of 616 infant deaths — before the age of one — for every 1,000 live births. In many of these counties, the infant mortality rate is barely half this.
While a number of factors contribute to infant mortality — many of which are not preventable — the health and habits of the mother are are chief among these. For this reason, the previously mentioned factors that result in a generally healthier population of adults in these areas also likely result in lower infant mortality.
To determine the counties where the most people live the longest, 24/7 Wall St. reviewed life expectancy data on a county level from the Institute for Health Metrics and Evaluation for 2010. Additionally, we considered median household incomes, from the United States Census Bureau’s 5-year American Community Survey. Infant mortality figures, as well as mortality data for various age groups, were based on five-year estimates from 2009-2013, and are from the Centers for Disease Control and Prevention’s National Center for Health Statistics.

Source: Wikimedia Commons
17. Arlington County, VA
> Life expectancy: 82.0 years
> Annual deaths per 100,000 people 65 and older: 3,676
> Median household income: $105,120
> Pct. of pop. over 65: 8.8%

Source: Thinkstock
16. Orange County, CA
> Life expectancy: 82.0 years
> Annual deaths per 100,000 people 65 and older: 3,625
> Median household income: $75,998
> Pct. of pop. over 65: 12.0%

Source: Wikimedia Commons
15. Westchester County, NY
> Life expectancy: 82.0 years
> Annual deaths per 100,000 people 65 and older: 3,491
> Median household income: $83,422
> Pct. of pop. over 65: 14.9%

Source: Thinkstock
14. Teton County, WY
> Life expectancy: 82.0 years
> Annual deaths per 100,000 people 65 and older: 3,008
> Median household income: $73,572
> Pct. of pop. over 65: 10.3%

Source: Wikimedia Commons
13. Somerset County, NJ
> Life expectancy: 82.0 years
> Annual deaths per 100,000 people 65 and older: 3,871
> Median household income: $100,903
> Pct. of pop. over 65: 12.9%

Source: Wikimedia Commons
12. Lincoln County, SD
> Life expectancy: 82.1 years
> Annual deaths per 100,000 people 65 and older: 3,168
> Median household income: $75,877
> Pct. of pop. over 65: 9.2%

Source: Wikimedia Commons
11. Eagle County, CO
> Life expectancy: 82.1 years
> Annual deaths per 100,000 people 65 and older: 2,224
> Median household income: $73,774
> Pct. of pop. over 65: 6.2%

Source: Wikimedia Commons
10. San Mateo County, CA
> Life expectancy: 82.3 years
> Annual deaths per 100,000 people 65 and older: 3,343
> Median household income: $91,421
> Pct. of pop. over 65: 13.8%

Source: Wikimedia Commons
9. Collier County, FL
> Life expectancy: 82.4 years
> Annual deaths per 100,000 people 65 and older: 2,684
> Median household income: $56,250
> Pct. of pop. over 65: 27.4%

Source: Wikimedia Commons
8. Bergen County, NJ
> Life expectancy: 82.5 years
> Annual deaths per 100,000 people 65 and older: 3,642
> Median household income: $83,686
> Pct. of pop. over 65: 15.4%

Source: Wikimedia Commons
7. Loudoun County, VA
> Life expectancy: 82.6 years
> Annual deaths per 100,000 people 65 and older: 3,490
> Median household income: $123,966
> Pct. of pop. over 65: 6.9%

Source: Wikimedia Commons
6. Santa Clara County, CA
> Life expectancy: 82.7 years
> Annual deaths per 100,000 people 65 and older: 3,276
> Median household income: $93,854
> Pct. of pop. over 65: 11.4%

Source: Wikimedia Commons
5. Douglas County, CO
> Life expectancy: 82.8 years
> Annual deaths per 100,000 people 65 and older: 3,455
> Median household income: $102,626
> Pct. of pop. over 65: 7.9%

Source: Wikimedia Commons
4. Gunnison County, CO
> Life expectancy: 82.8 years
> Annual deaths per 100,000 people 65 and older: 3,718
> Median household income: $51,371
> Pct. of pop. over 65: 9.5%

Source: Wikimedia Commons
3. Fairfax County, VA
> Life expectancy: 83.1 years
> Annual deaths per 100,000 people 65 and older: 3,286
> Median household income: $112,102
> Pct. of pop. over 65: 10.3%

Source: Thinkstock
2. Marin County, CA
> Life expectancy: 83.2 years
> Annual deaths per 100,000 people 65 and older: 3,182
> Median household income: $91,529
> Pct. of pop. over 65: 17.5%

Source: Wikimedia Commons
1. Montgomery County, MD
> Life expectancy: 83.3 years
> Annual deaths per 100,000 people 65 and older: 3,096
> Median household income: $98,704
> Pct. of pop. over 65: 12.7%
Sponsored: Find a Qualified Financial Advisor
Finding a qualified financial advisor doesn’t have to be hard. SmartAsset’s free tool matches you with up to 3 fiduciary financial advisors in your area in 5 minutes. Each advisor has been vetted by SmartAsset and is held to a fiduciary standard to act in your best interests. If you’re ready to be matched with local advisors that can help you achieve your financial goals, get started now.
Thank you for reading! Have some feedback for us?
Contact the 24/7 Wall St. editorial team.

