Source: Thinkstock
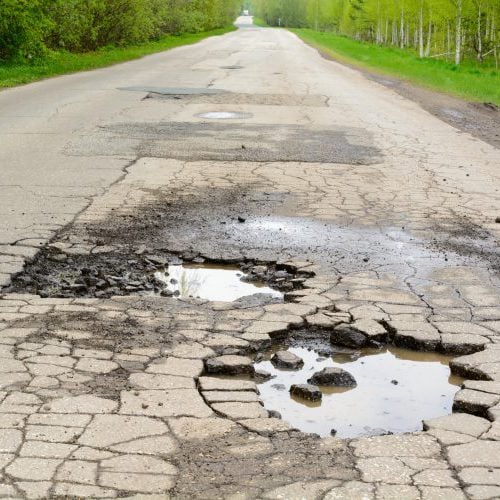
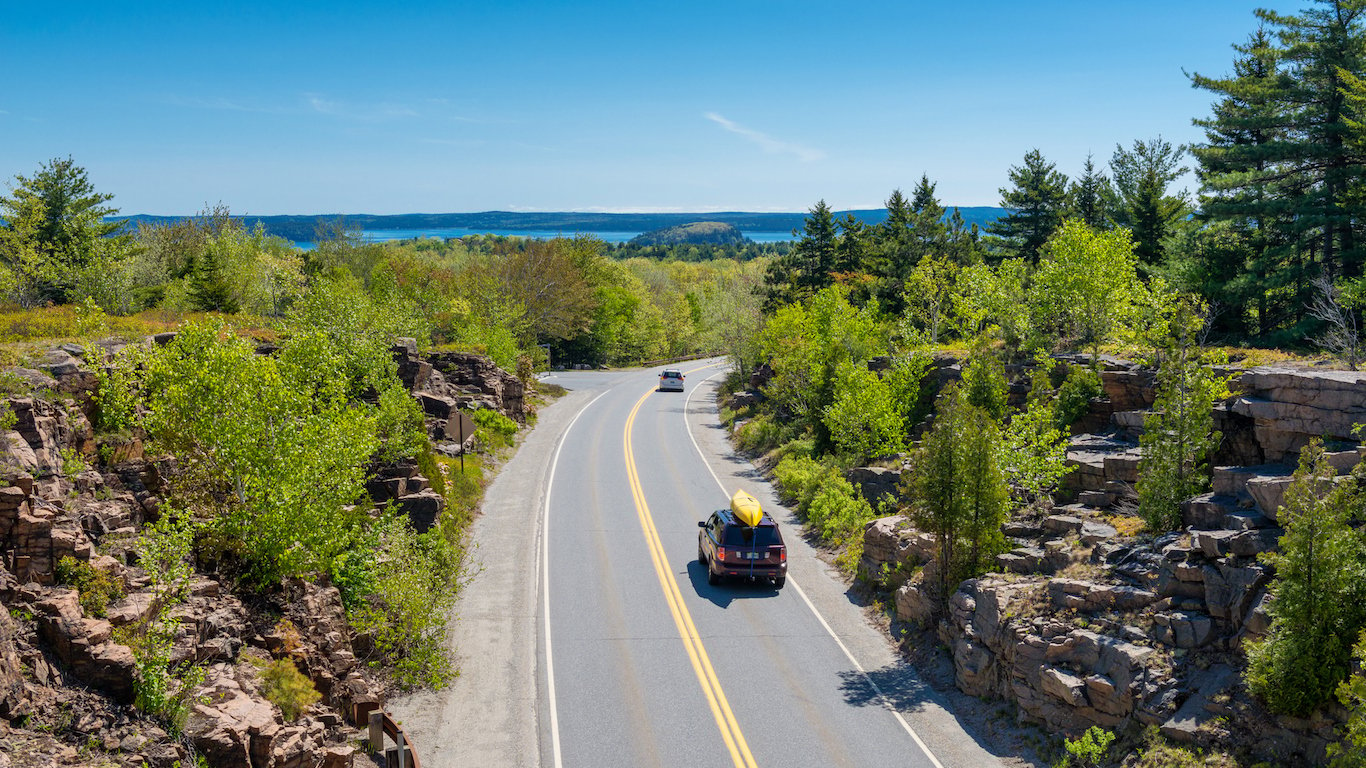
To determine the states with the worst roads, 24/7 Wall St. reviewed statistics from the Federal Highway Administration. The worst roads are in Rhode Island, where 52% of major roadways are in poor condition. By contrast, less than 5% of the roads tested in Idaho are in need of repair, the lowest share of any state.
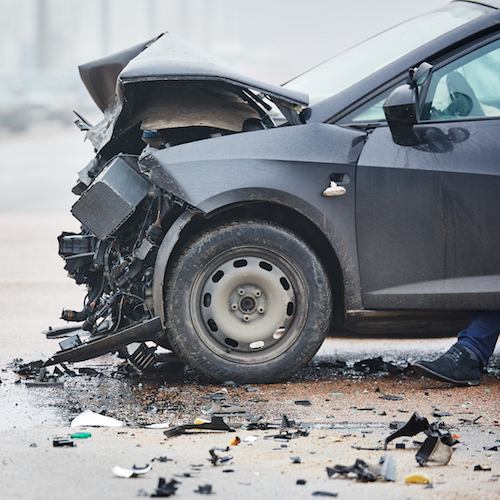
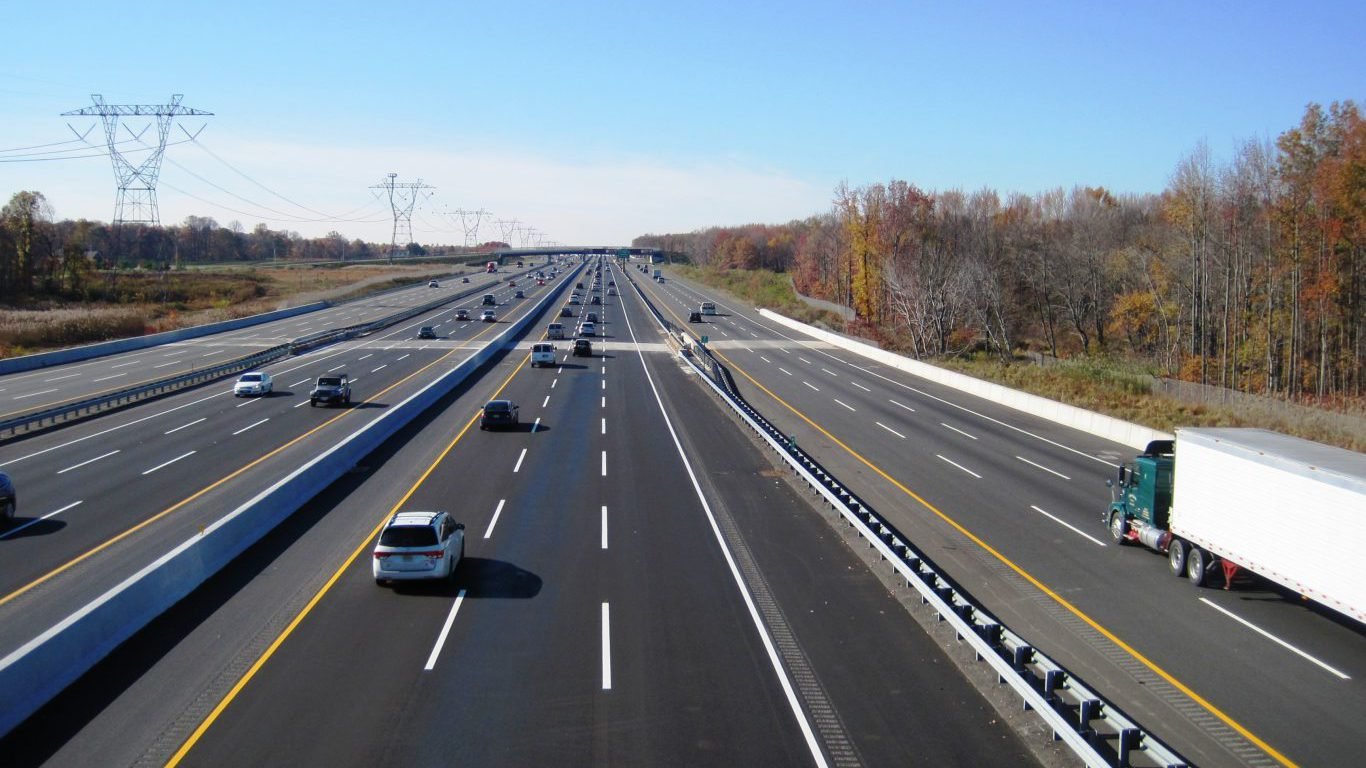
Driving on rough, damaged roads can be unpleasant, dangerous, and often leads to additional vehicle operating and repair costs, including flat tires and general tire wear, deterioration of a vehicle’s shock absorption, extra fuel costs, and so on. These additional costs are highest in New Jersey, where on average each motorist spends an extra $601 annually on vehicle operating and repair costs. Nationwide, roads in disrepair cost motorists an extra $66.6 billion, or $324 per motorist each year.
Click here to see the states with the worst roads.
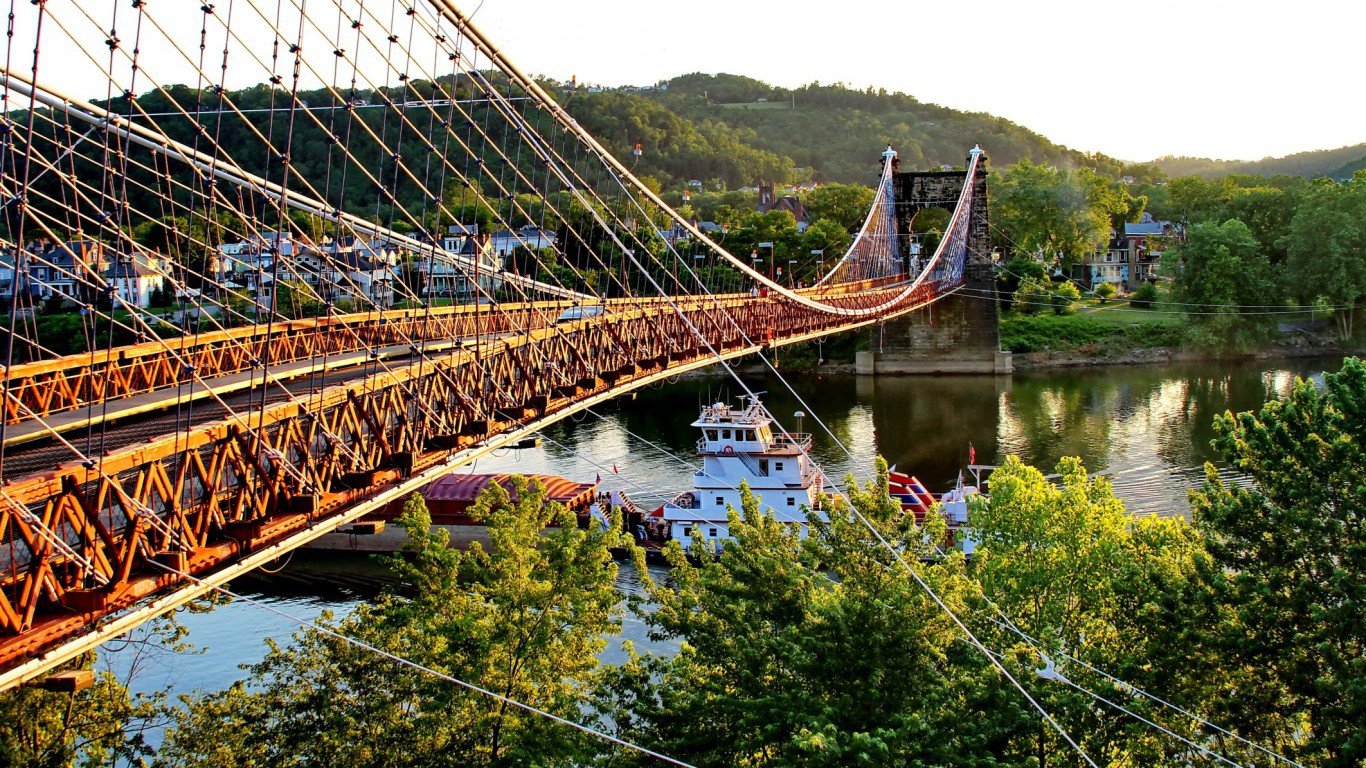
Bridges are another way to assess a state’s public road system. Nearly one in four bridges in America do not meet the standards set by the federal government. While the vast majority of these bridges are still safe to use, they must be monitored and eventually repaired or modernized. Travel on some are restricted to certain weight limits. States with more roads in poor condition tend to have a higher share of bridges that are deficient. Rhode Island, the state with the worst roads, also has the highest share of deficient bridges, at 56%.
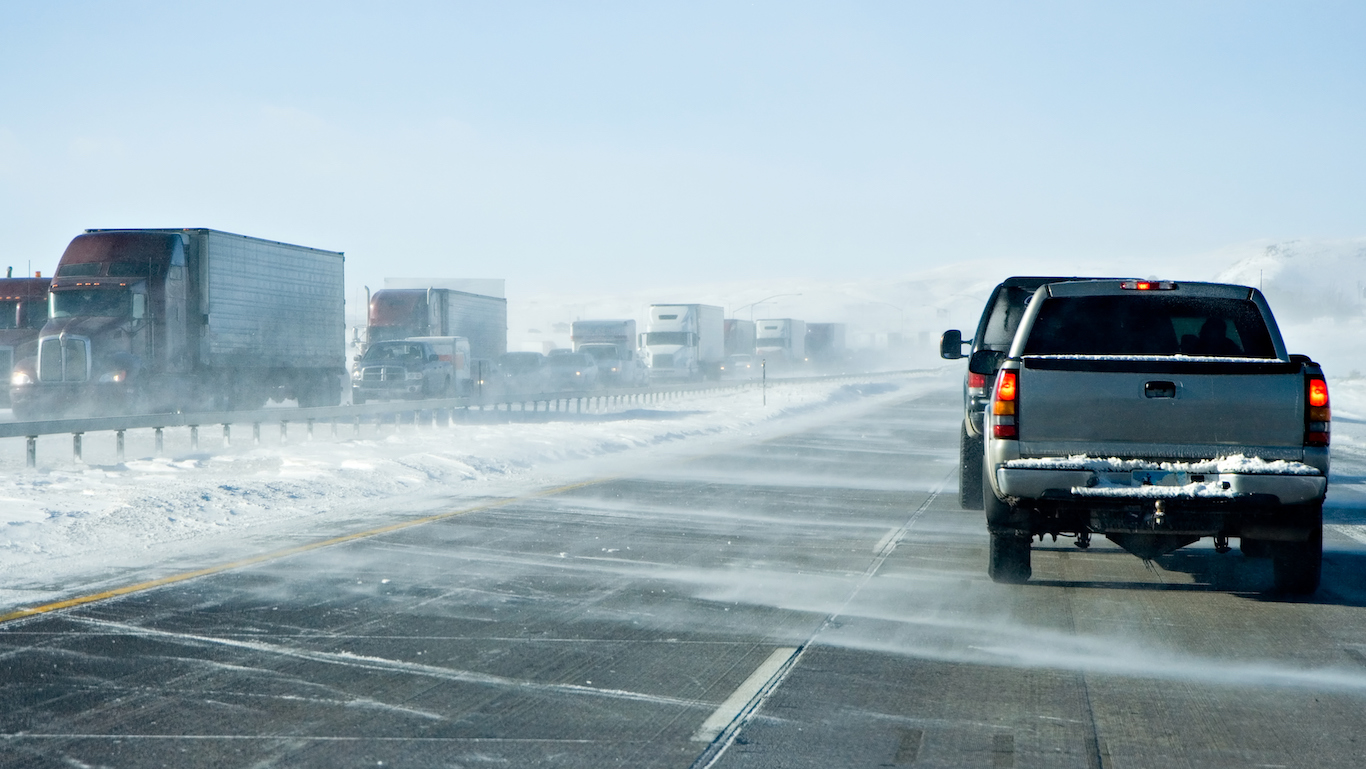
Geographical features and weather conditions can make road construction and maintenance much more challenging. It is both cheaper and easier to build and maintain roads in a flat state like Kansas than in neighboring mountainous Colorado. In states such as Wisconsin, road pavement expands and contracts due to large temperature differences in winter and summer. Because this expansion and contraction damages the pavement, extra maintenance costs are required — costs not required in states with more even temperatures.
To identify the states with the worst roads, 24/7 Wall St. reviewed pavement roughness data from the U.S. Federal Highway Administration’s 2014 Highway Statistics report. Also from the report are the share of deficient bridges and total lane-miles. The share of deficient bridges is the sum of bridges categorized as either structurally deficient or functionally obsolete. Extra vehicle operating and repair costs are from the American Society of Civil Engineers 2013 Report Card for America’s Infrastructure. Because 2014 pavement roughness data was unavailable for Massachusetts, 2013 data was used. All data is from the most recent period available.
These are the states with the worst roads.
Source: Thinkstock
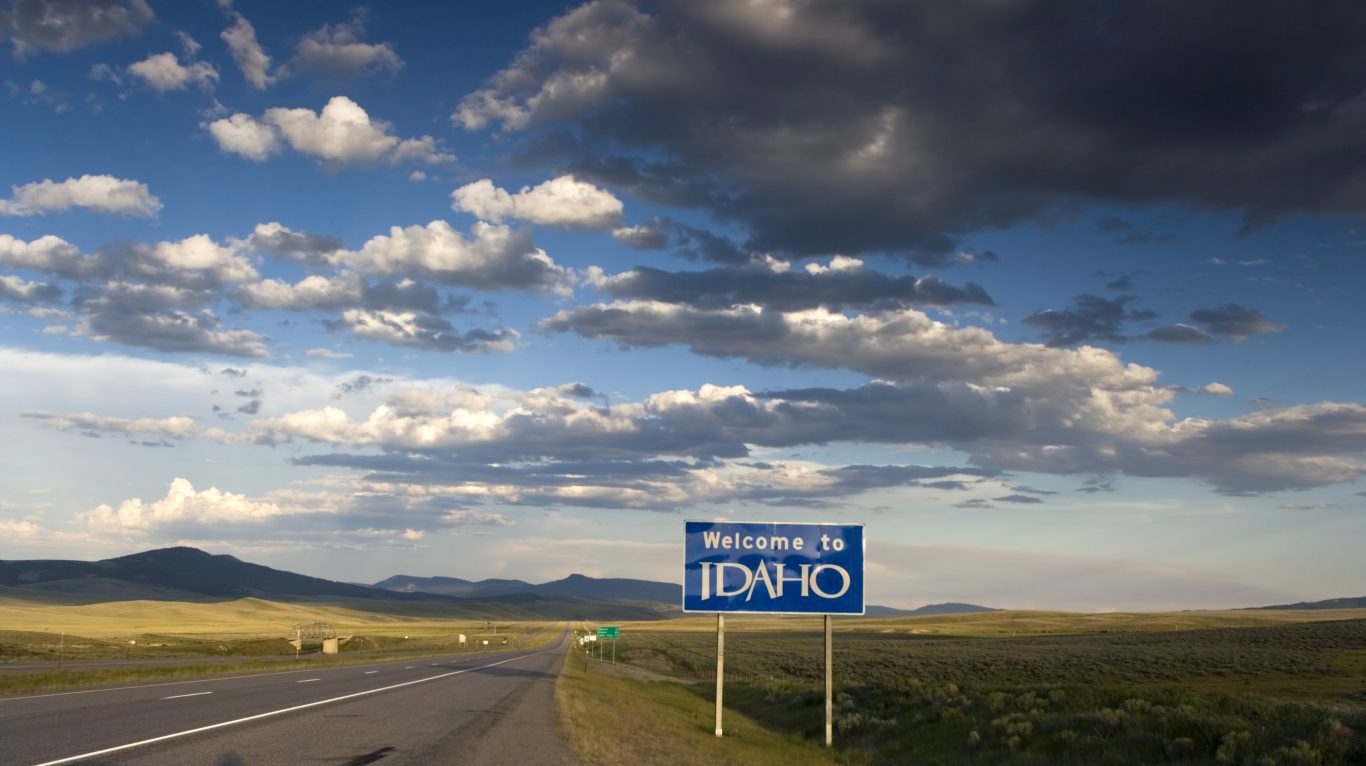
50. Idaho
> Public roads in poor condition: 4.7% (the lowest)
> Deficient bridges: 19.8% (16th lowest)
> Added vehicle costs: $305 per motorist (21st highest)
> Size of road system: 100,317 lane-miles (16th smallest)
Source: Thinkstock
49. North Dakota
> Public roads in poor condition: 4.9% (2nd lowest)
> Deficient bridges: 21.3% (19th lowest)
> Added vehicle costs: $237 per motorist (14th lowest)
> Size of road system: 176,613 lane-miles (23rd largest)
Source: Thinkstock
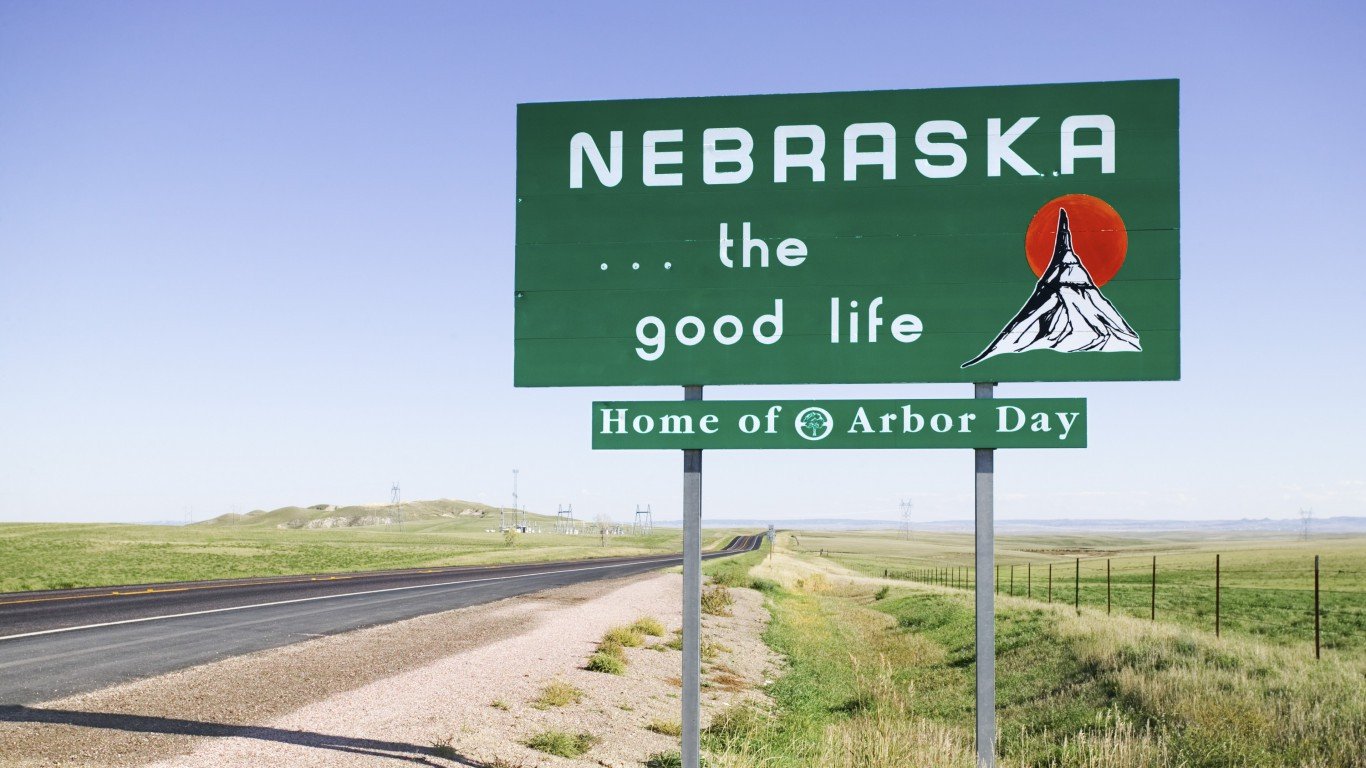
48. Nebraska
> Public roads in poor condition: 5.4% (3rd lowest)
> Deficient bridges: 23.7% (25th highest)
> Added vehicle costs: $282 per motorist (25th lowest)
> Size of road system: 190,932 lane-miles (21st largest)
Source: Thinkstock
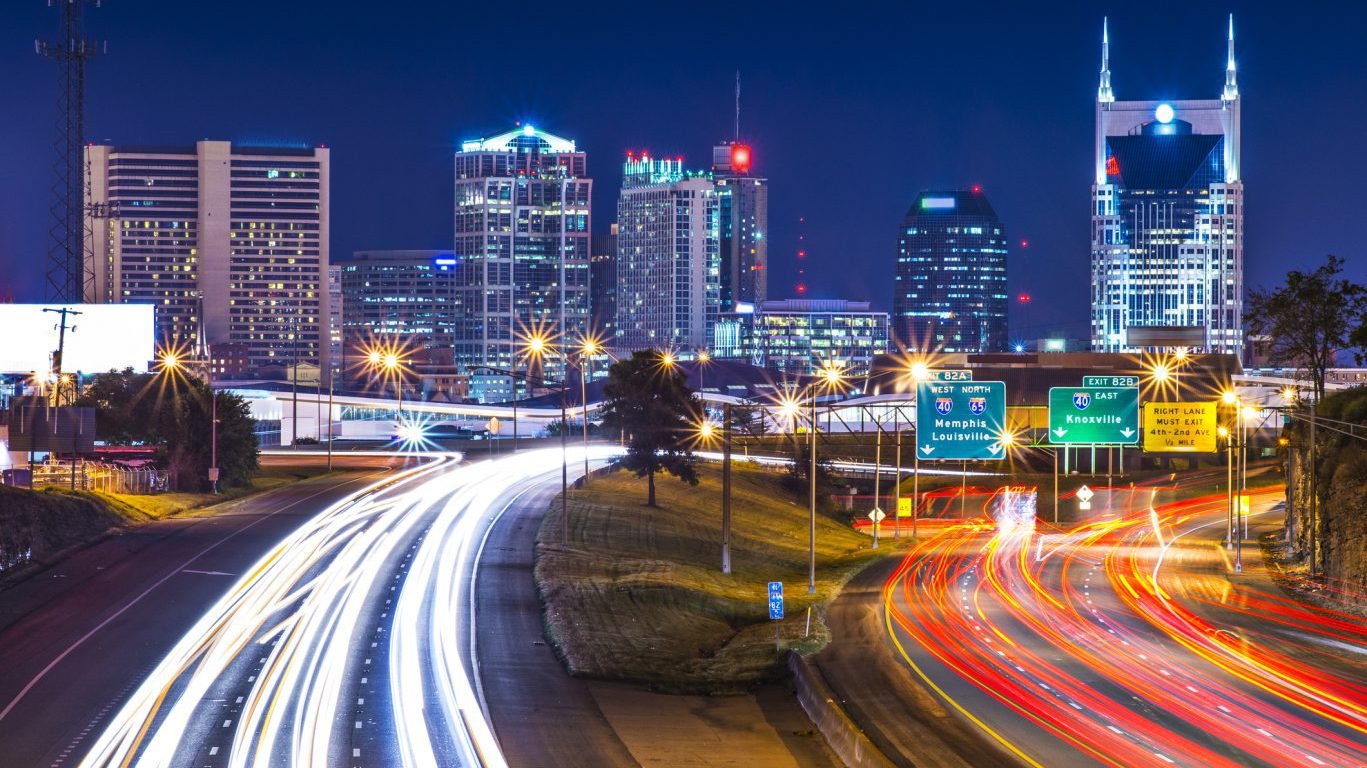
47. Tennessee
> Public roads in poor condition: 5.9% (4th lowest)
> Deficient bridges: 19.7% (14th lowest)
> Added vehicle costs: $182 per motorist (5th lowest)
> Size of road system: 202,310 lane-miles (19th largest)
Source: Thinkstock
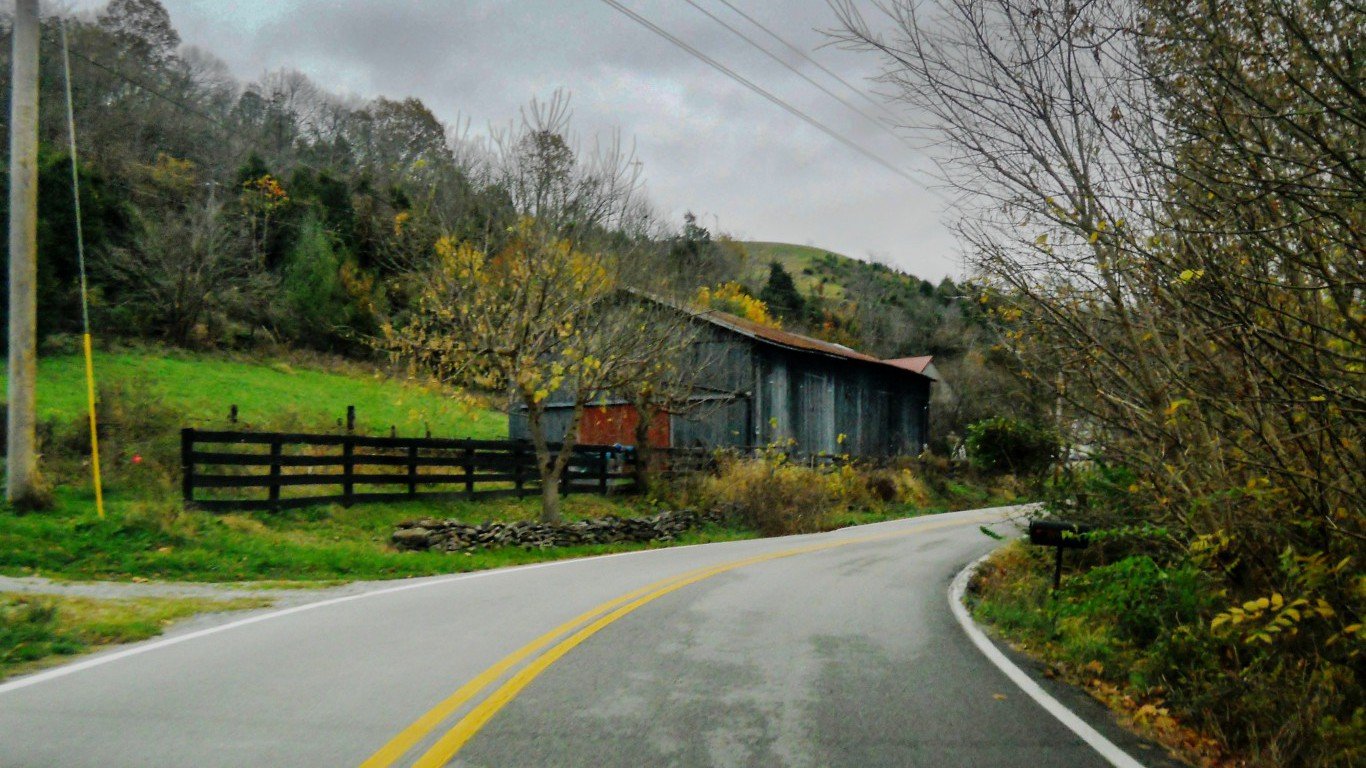
46. Kentucky
> Public roads in poor condition: 7.4% (5th lowest)
> Deficient bridges: 31.3% (12th highest)
> Added vehicle costs: $185 per motorist (7th lowest)
> Size of road system: 166,286 lane-miles (25th smallest)
Source: Thinkstock
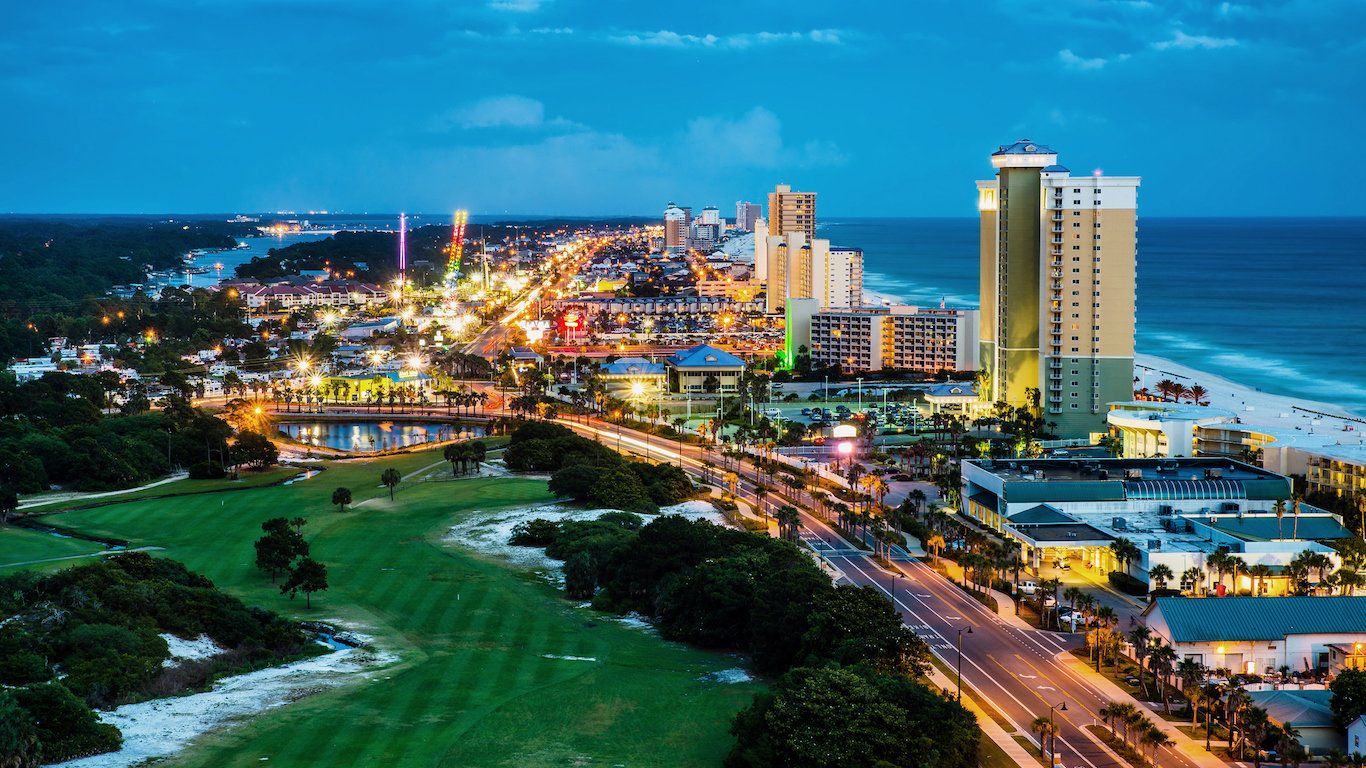
45. Florida
> Public roads in poor condition: 8.0% (6th lowest)
> Deficient bridges: 16.5% (10th lowest)
> Added vehicle costs: $128 per motorist (2nd lowest)
> Size of road system: 272,435 lane-miles (7th largest)
Source: Thinkstock
44. Wyoming
> Public roads in poor condition: 8.2% (7th lowest)
> Deficient bridges: 22.6% (23rd lowest)
> Added vehicle costs: $236 per motorist (13th lowest)
> Size of road system: 60,381 lane-miles (9th smallest)
Source: Thinkstock
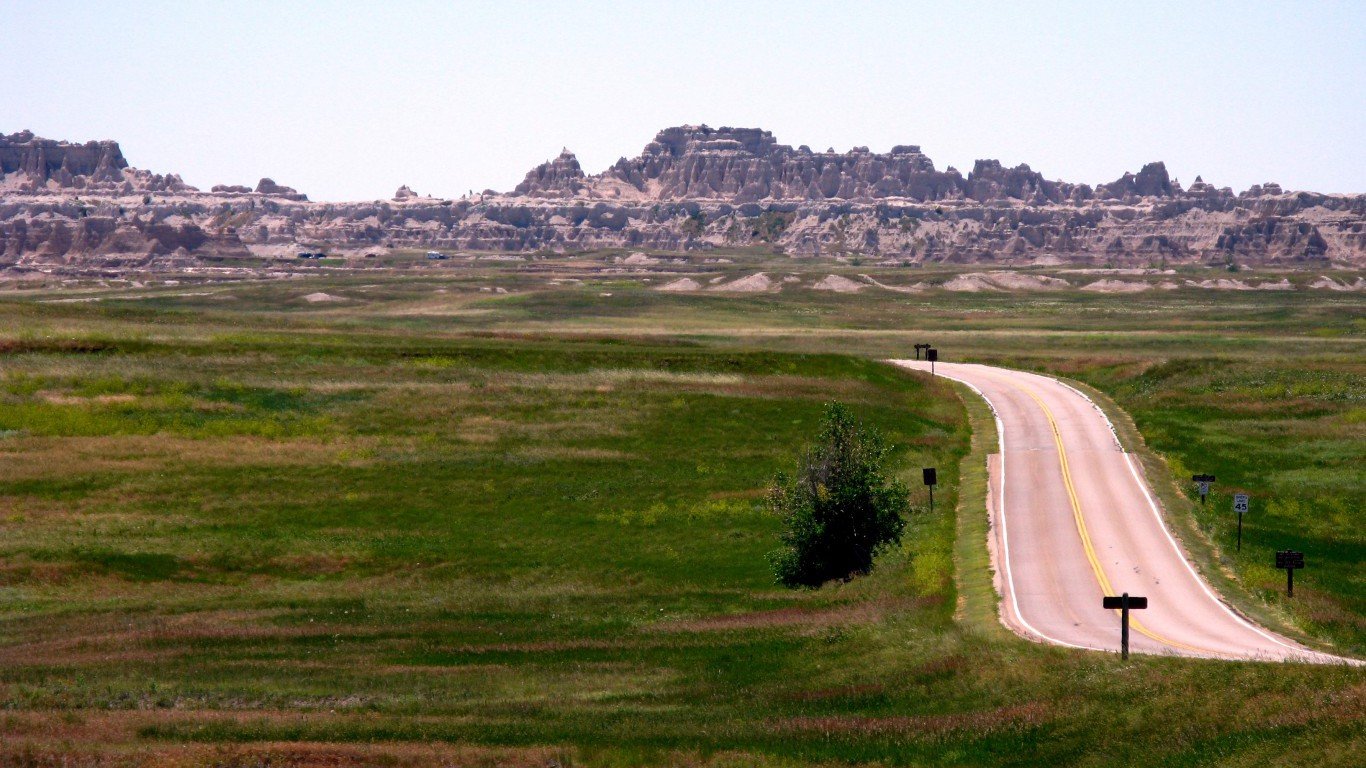
43. South Dakota
> Public roads in poor condition: 8.3% (8th lowest)
> Deficient bridges: 24.0% (24th highest)
> Added vehicle costs: $324 per motorist (17th highest)
> Size of road system: 167,800 lane-miles (25th largest)
Source: Thinkstock
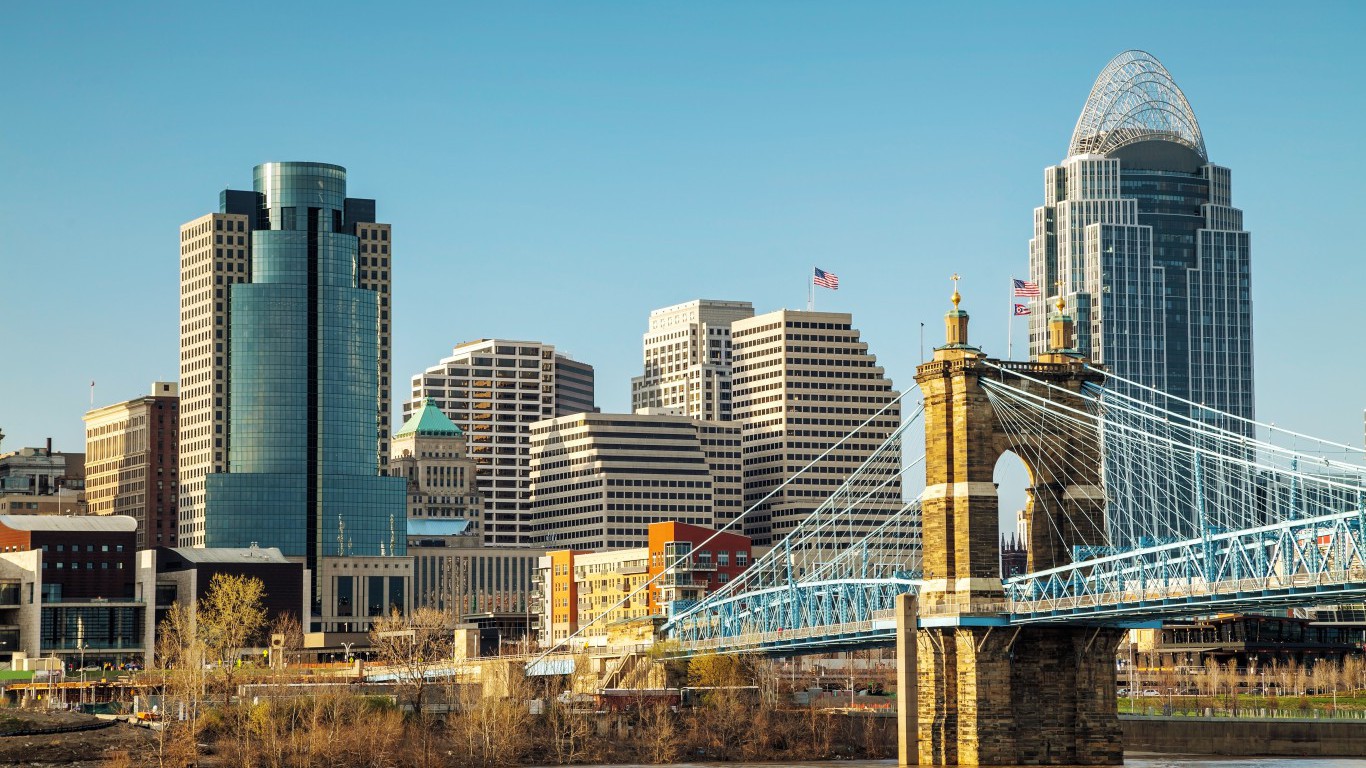
42. Ohio
> Public roads in poor condition: 9.2% (9th lowest)
> Deficient bridges: 24.2% (23rd highest)
> Added vehicle costs: $212 per motorist (10th lowest)
> Size of road system: 262,166 lane-miles (9th largest)
Source: Wikimedia Commons
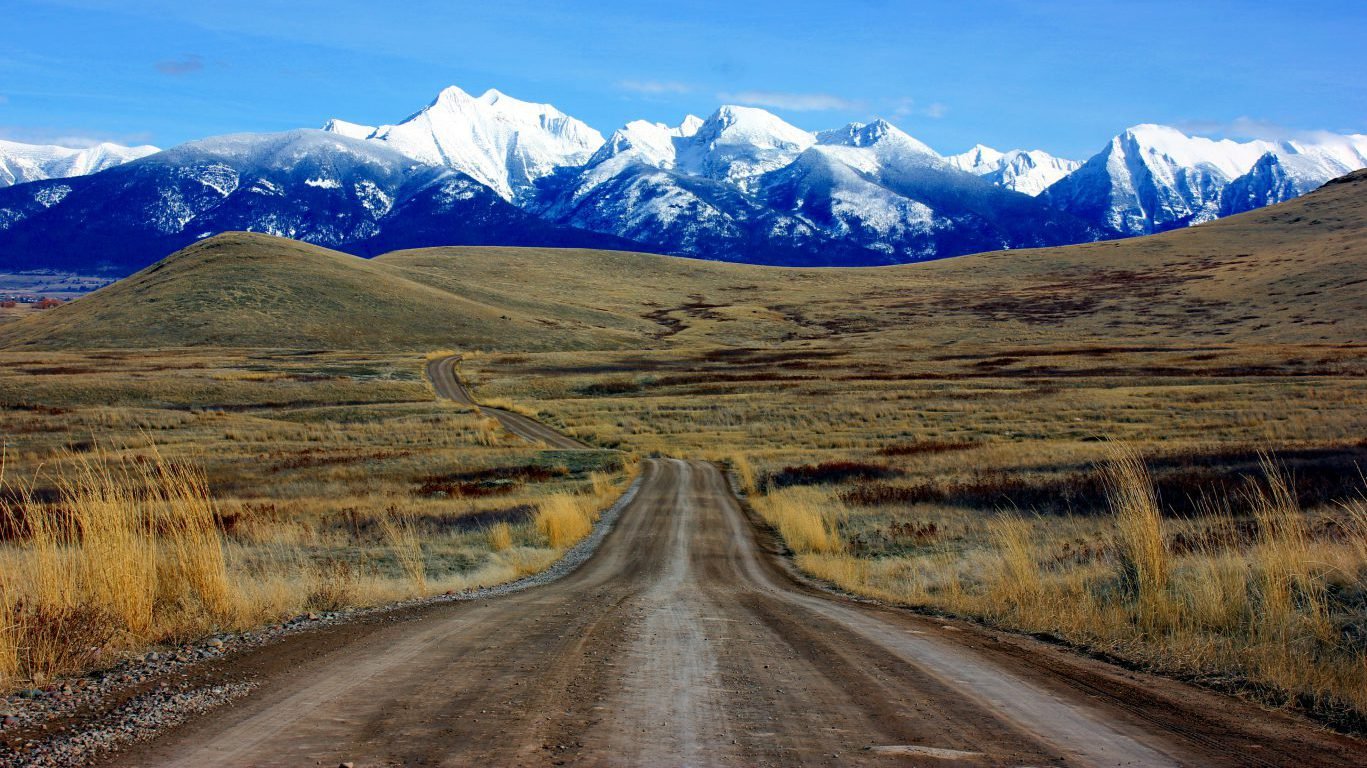
41. Montana
> Public roads in poor condition: 9.2% (10th lowest)
> Deficient bridges: 17.4% (12th lowest)
> Added vehicle costs: $184 per motorist (6th lowest)
> Size of road system: 153,061 lane-miles (21st smallest)
Source: Thinkstock
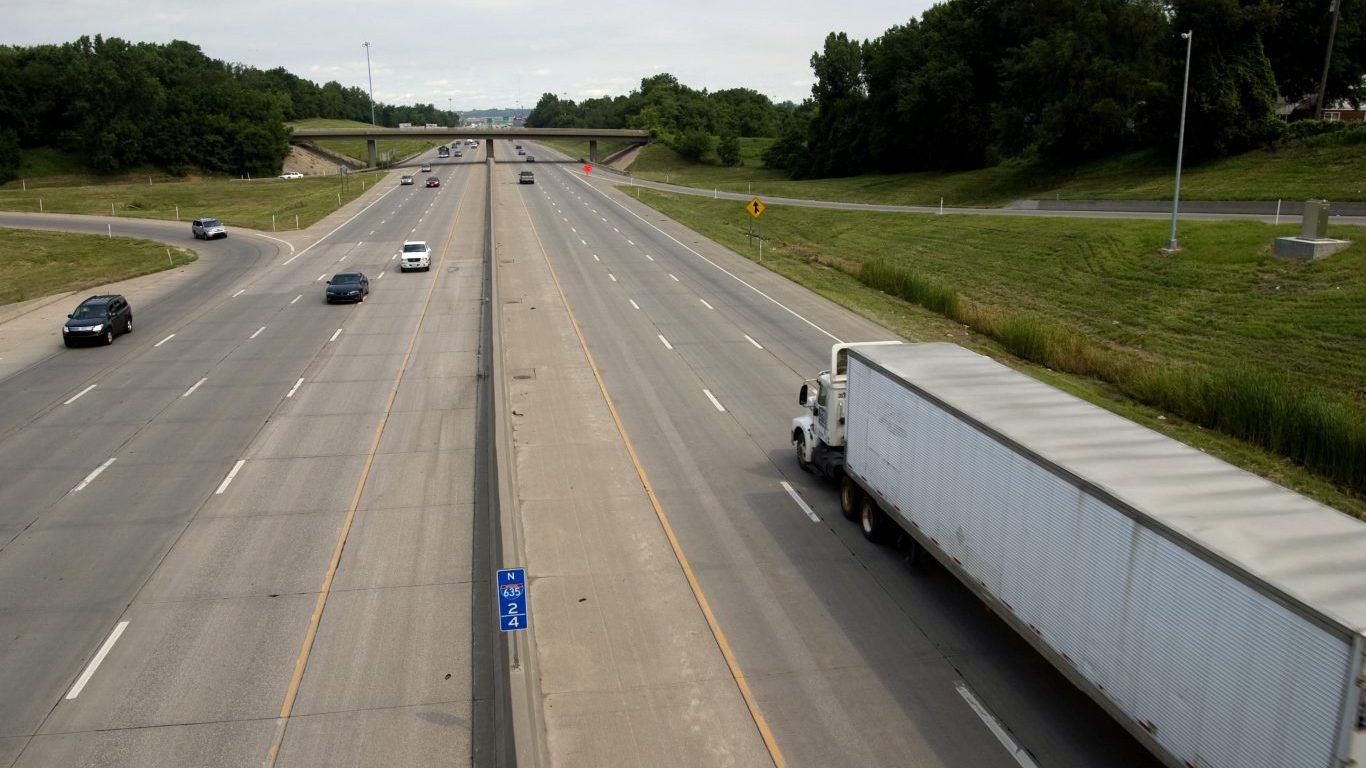
40. Kansas
> Public roads in poor condition: 9.7% (11th lowest)
> Deficient bridges: 16.9% (11th lowest)
> Added vehicle costs: $319 per motorist (18th highest)
> Size of road system: 286,701 lane-miles (4th largest)
Source: Thinkstock
39. Alabama
> Public roads in poor condition: 9.9% (12th lowest)
> Deficient bridges: 22.0% (21st lowest)
> Added vehicle costs: $141 per motorist (3rd lowest)
> Size of road system: 213,075 lane-miles (17th largest)
 24/7 Wall St.
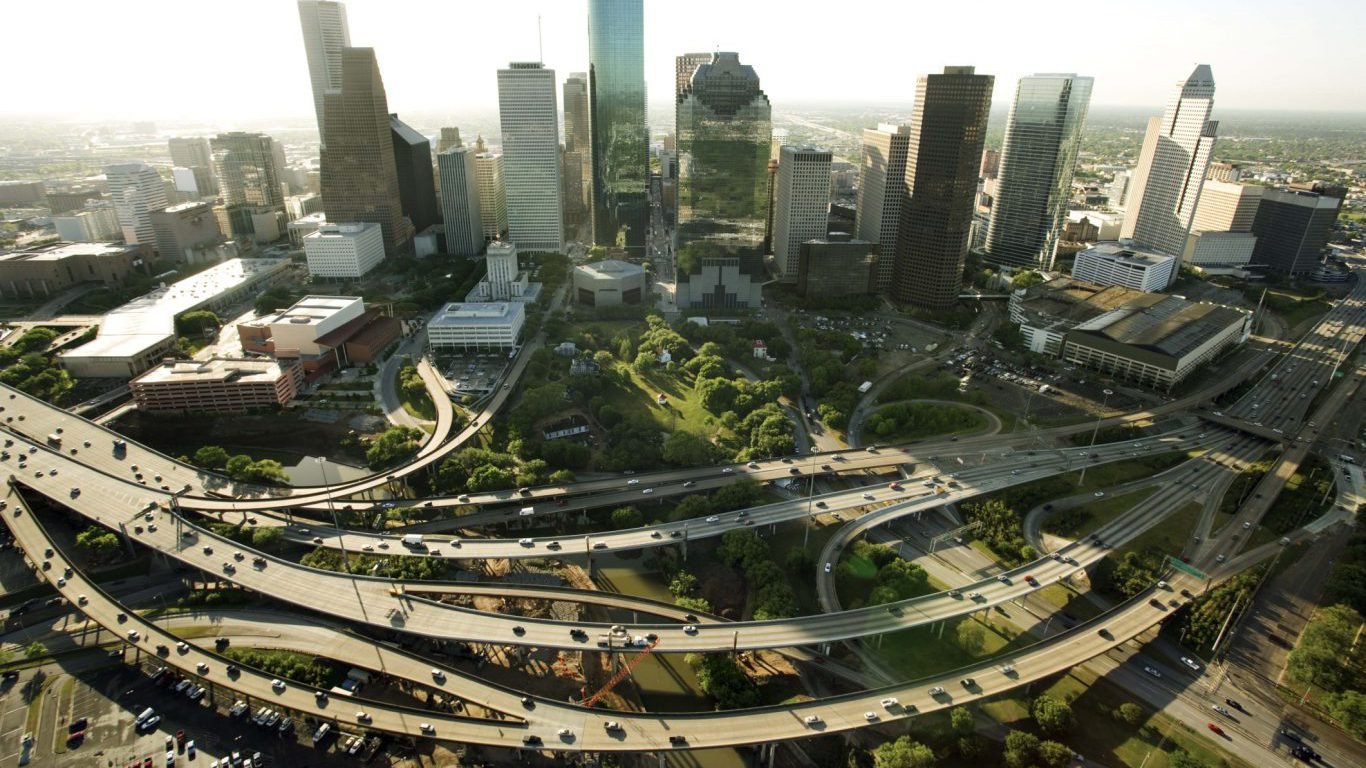
Source: Thinkstock
38. Texas
> Public roads in poor condition: 10.2% (13th lowest)
> Deficient bridges: 18.9% (13th lowest)
> Added vehicle costs: $343 per motorist (15th highest)
> Size of road system: 677,575 lane-miles (the largest)
Source: Thinkstock
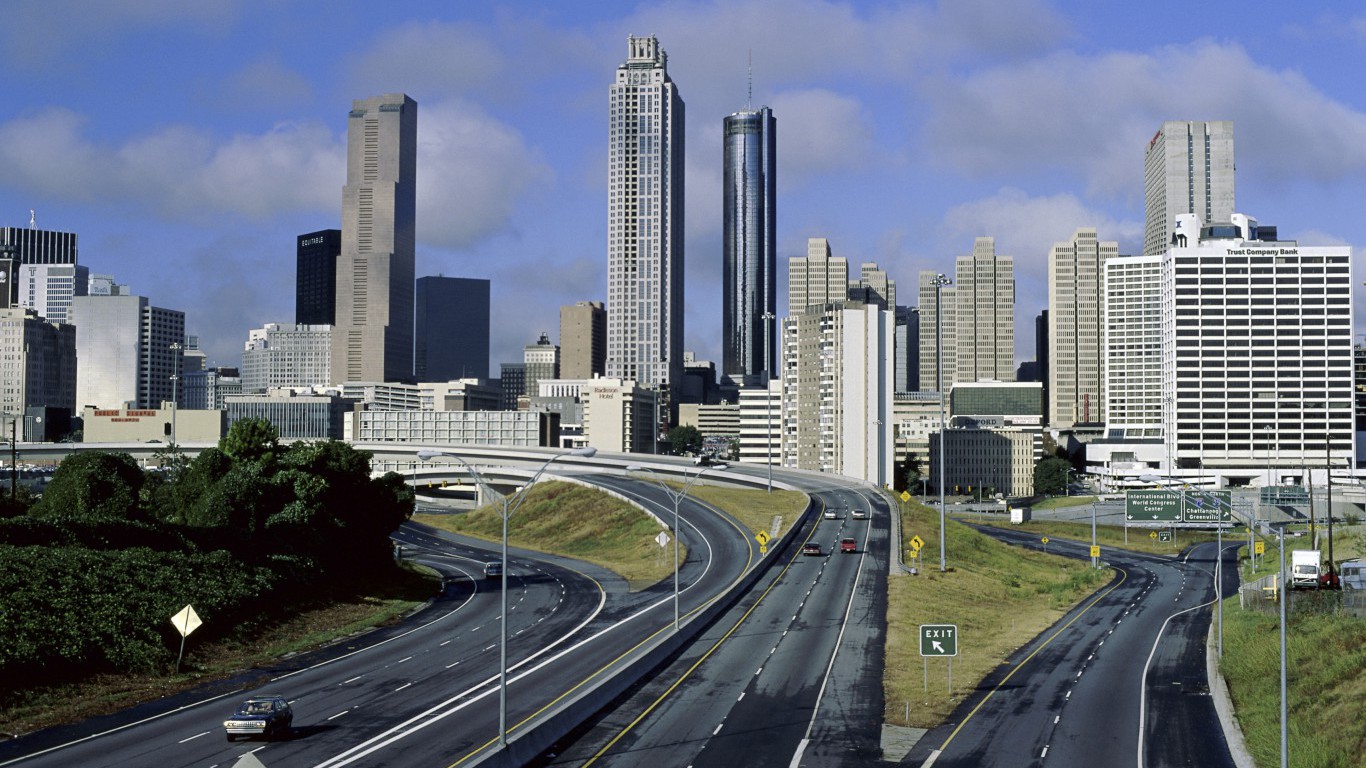
37. Georgia
> Public roads in poor condition: 11.3% (14th lowest)
> Deficient bridges: 16.3% (9th lowest)
> Added vehicle costs: $60 per motorist (the lowest)
> Size of road system: 270,335 lane-miles (8th largest)
Source: Thinkstock
36. Oregon
> Public roads in poor condition: 11.6% (15th lowest)
> Deficient bridges: 23.1% (25th lowest)
> Added vehicle costs: $173 per motorist (4th lowest)
> Size of road system: 150,973 lane-miles (20th smallest)
Source: Thinkstock
35. Arizona
> Public roads in poor condition: 12.2% (16th lowest)
> Deficient bridges: 11.7% (2nd lowest)
> Added vehicle costs: $205 per motorist (9th lowest)
> Size of road system: 142,790 lane-miles (18th smallest)
Source: Thinkstock
34. Michigan
> Public roads in poor condition: 12.2% (17th lowest)
> Deficient bridges: 27.5% (15th highest)
> Added vehicle costs: $357 per motorist (14th highest)
> Size of road system: 256,747 lane-miles (10th largest)
Source: Thinkstock
33. North Carolina
> Public roads in poor condition: 12.5% (18th lowest)
> Deficient bridges: 29.4% (13th highest)
> Added vehicle costs: $241 per motorist (15th lowest)
> Size of road system: 225,973 lane-miles (16th largest)
Source: Wikimedia Commons
32. New Hampshire
> Public roads in poor condition: 13.4% (19th lowest)
> Deficient bridges: 31.4% (11th highest)
> Added vehicle costs: $259 per motorist (21st lowest)
> Size of road system: 33,243 lane-miles (6th smallest)
Source: Thinkstock
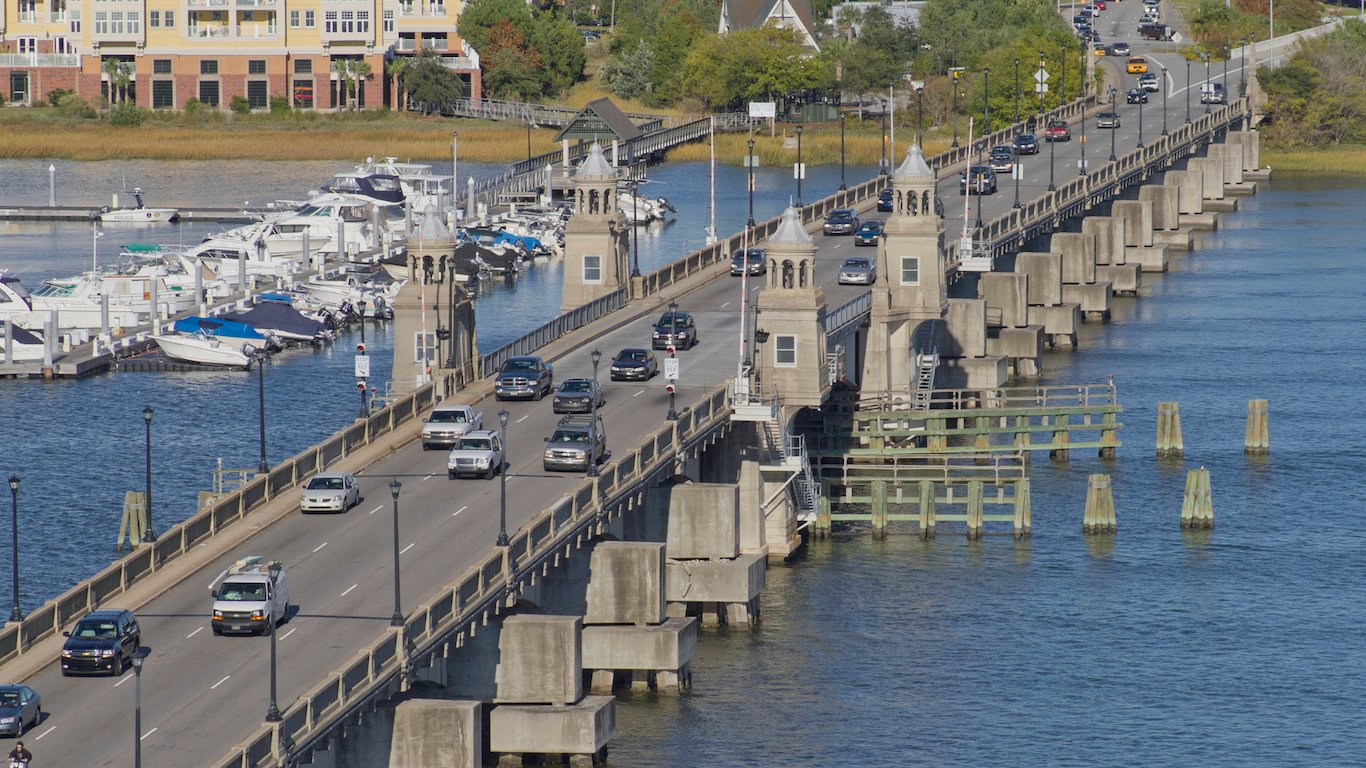
31. South Carolina
> Public roads in poor condition: 13.6% (20th lowest)
> Deficient bridges: 20.6% (17th lowest)
> Added vehicle costs: $255 per motorist (19th lowest)
> Size of road system: 160,359 lane-miles (23rd smallest)
Source: Thinkstock
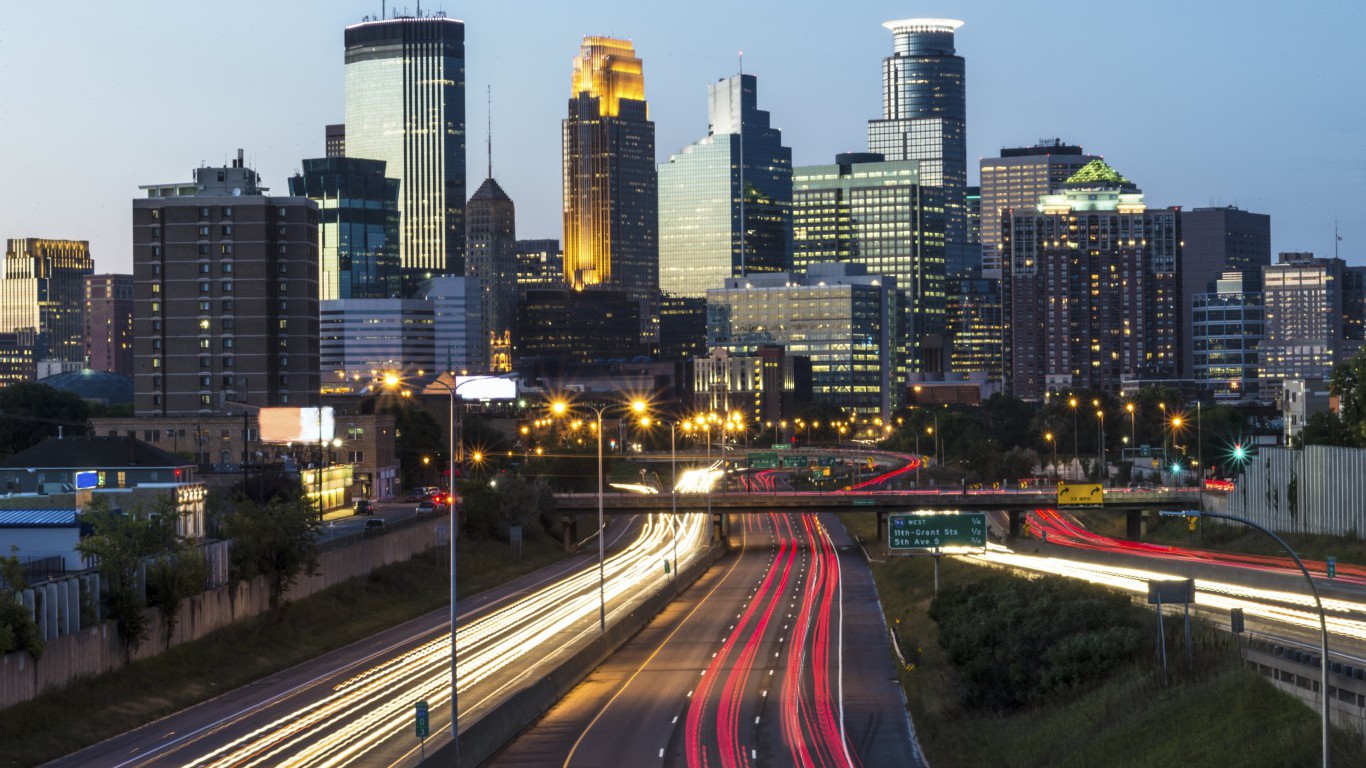
30. Minnesota
> Public roads in poor condition: 14.0% (21st lowest)
> Deficient bridges: 9.2% (the lowest)
> Added vehicle costs: $250 per motorist (17th lowest)
> Size of road system: 285,083 lane-miles (5th largest)
Source: Wikimedia Commons
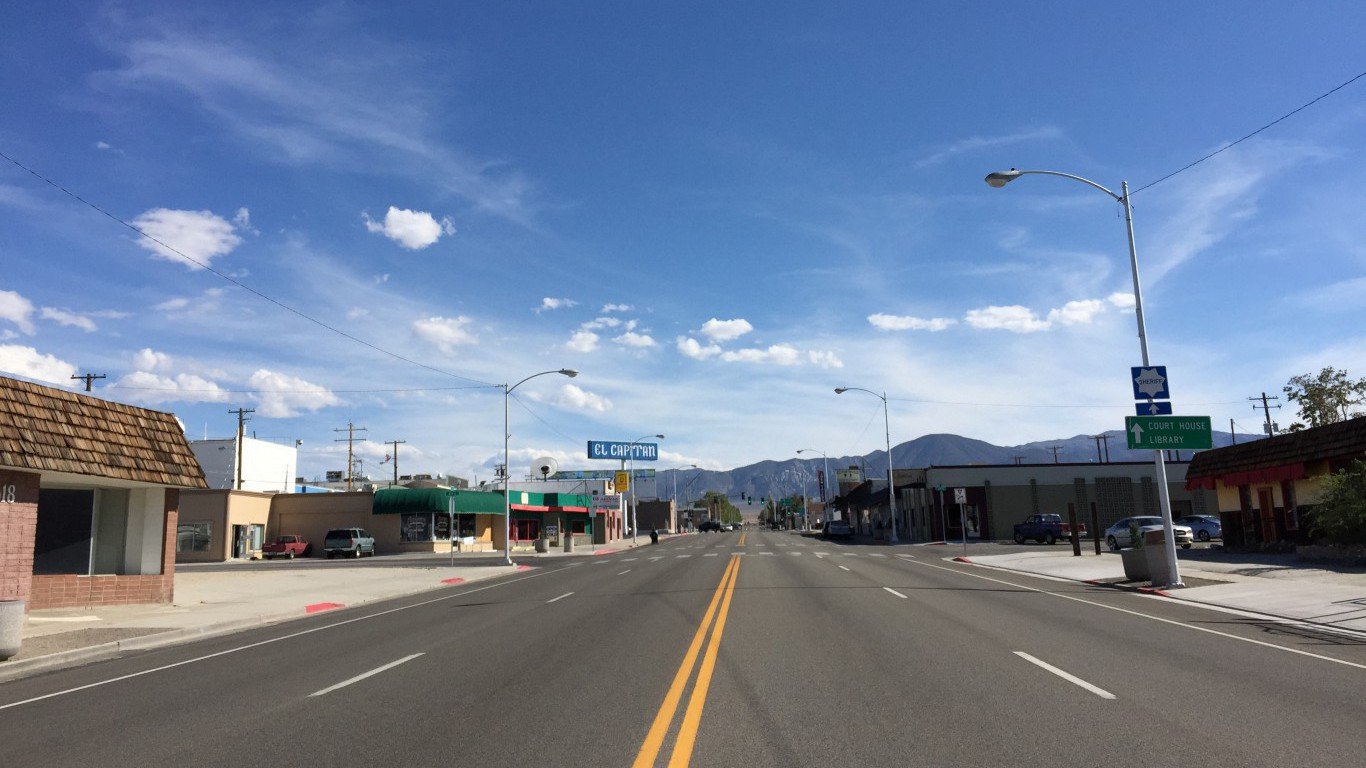
29. Nevada
> Public roads in poor condition: 14.4% (22nd lowest)
> Deficient bridges: 13.1% (3rd lowest)
> Added vehicle costs: $233 per motorist (12th lowest)
> Size of road system: 90,813 lane-miles (14th smallest)
Source: Thinkstock
28. Indiana
> Public roads in poor condition: 15.0% (23rd lowest)
> Deficient bridges: 21.6% (20th lowest)
> Added vehicle costs: $225 per motorist (11th lowest)
> Size of road system: 201,924 lane-miles (20th largest)
Source: Thinkstock
27. Maine
> Public roads in poor condition: 18.1% (24th lowest)
> Deficient bridges: 32.9% (9th highest)
> Added vehicle costs: $245 per motorist (16th lowest)
> Size of road system: 46,947 lane-miles (8th smallest)
 24/7 Wall St.
Source: Thinkstock
26. Arkansas
> Public roads in poor condition: 18.2% (25th lowest)
> Deficient bridges: 22.3% (22nd lowest)
> Added vehicle costs: $308 per motorist (20th highest)
> Size of road system: 210,304 lane-miles (18th largest)
Source: Thinkstock
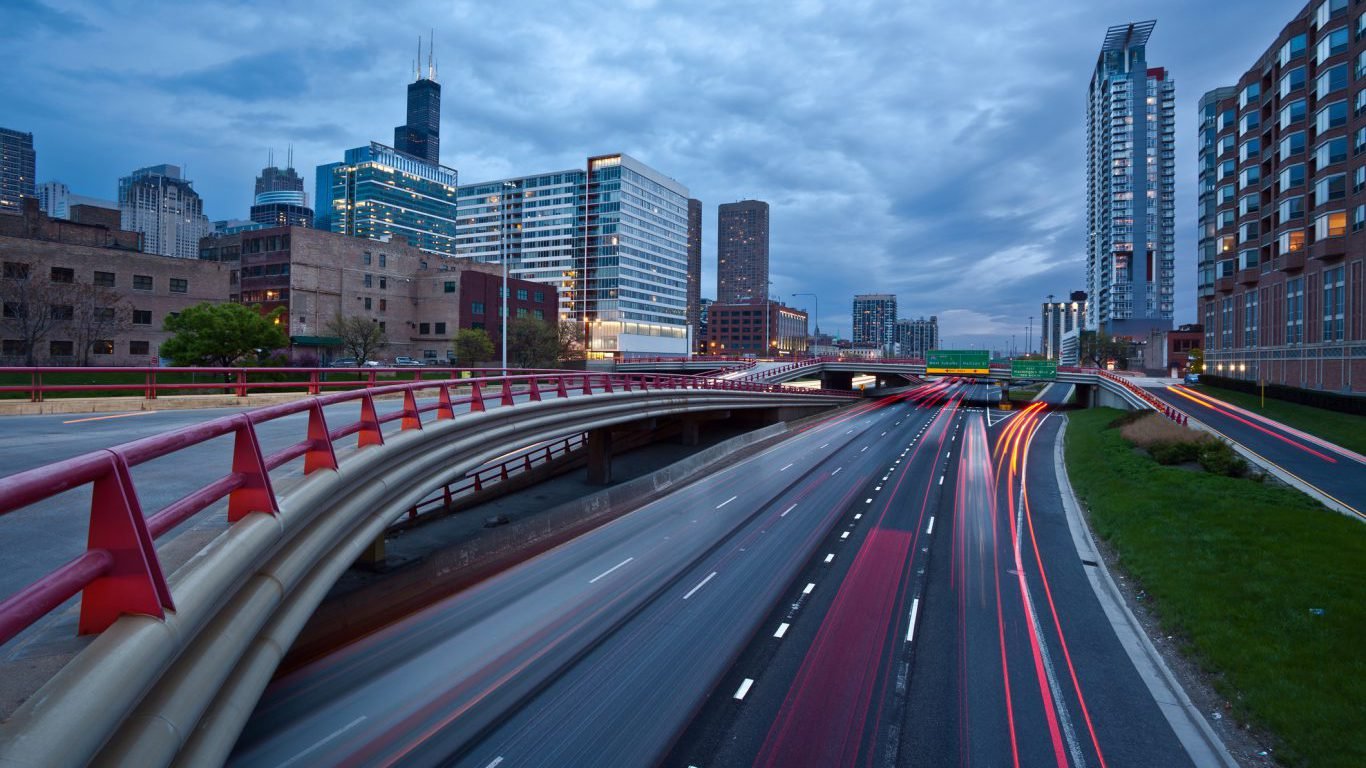
25. Illinois
> Public roads in poor condition: 18.8% (25th highest)
> Deficient bridges: 15.7% (6th lowest)
> Added vehicle costs: $292 per motorist (23rd highest)
> Size of road system: 306,086 lane-miles (3rd largest)
Source: Wikimedia Commons
24. Delaware
> Public roads in poor condition: 19.1% (24th highest)
> Deficient bridges: 19.8% (15th lowest)
> Added vehicle costs: $257 per motorist (20th lowest)
> Size of road system: 13,876 lane-miles (3rd smallest)
Source: Thinkstock
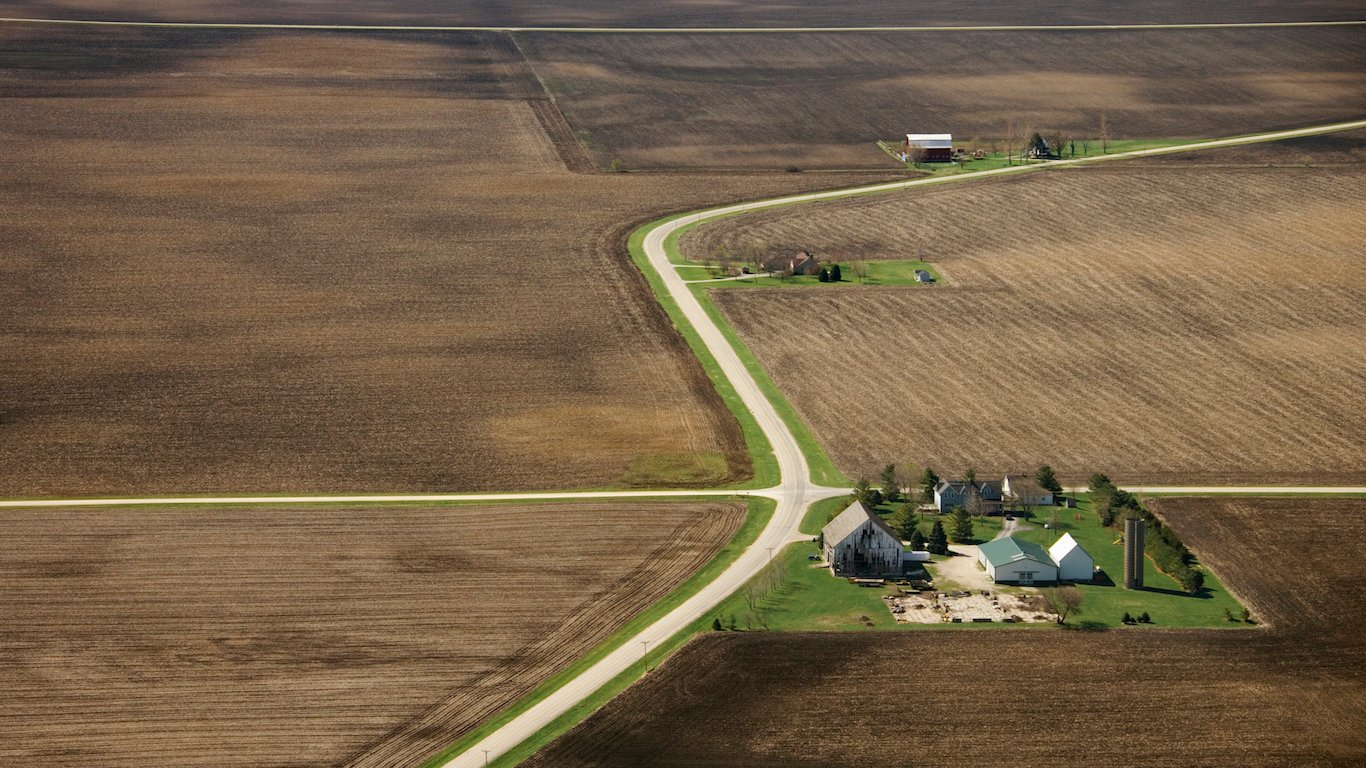
23. Iowa
> Public roads in poor condition: 19.2% (23rd highest)
> Deficient bridges: 25.5% (21st highest)
> Added vehicle costs: $381 per motorist (11th highest)
> Size of road system: 234,073 lane-miles (15th largest)
Source: Thinkstock
22. Utah
> Public roads in poor condition: 20.1% (22nd highest)
> Deficient bridges: 13.9% (4th lowest)
> Added vehicle costs: $197 per motorist (8th lowest)
> Size of road system: 97,273 lane-miles (15th smallest)
Source: Wikimedia Commons
21. Colorado
> Public roads in poor condition: 21.5% (21st highest)
> Deficient bridges: 16.0% (7th lowest)
> Added vehicle costs: $287 per motorist (25th highest)
> Size of road system: 184,666 lane-miles (22nd largest)
Source: Thinkstock
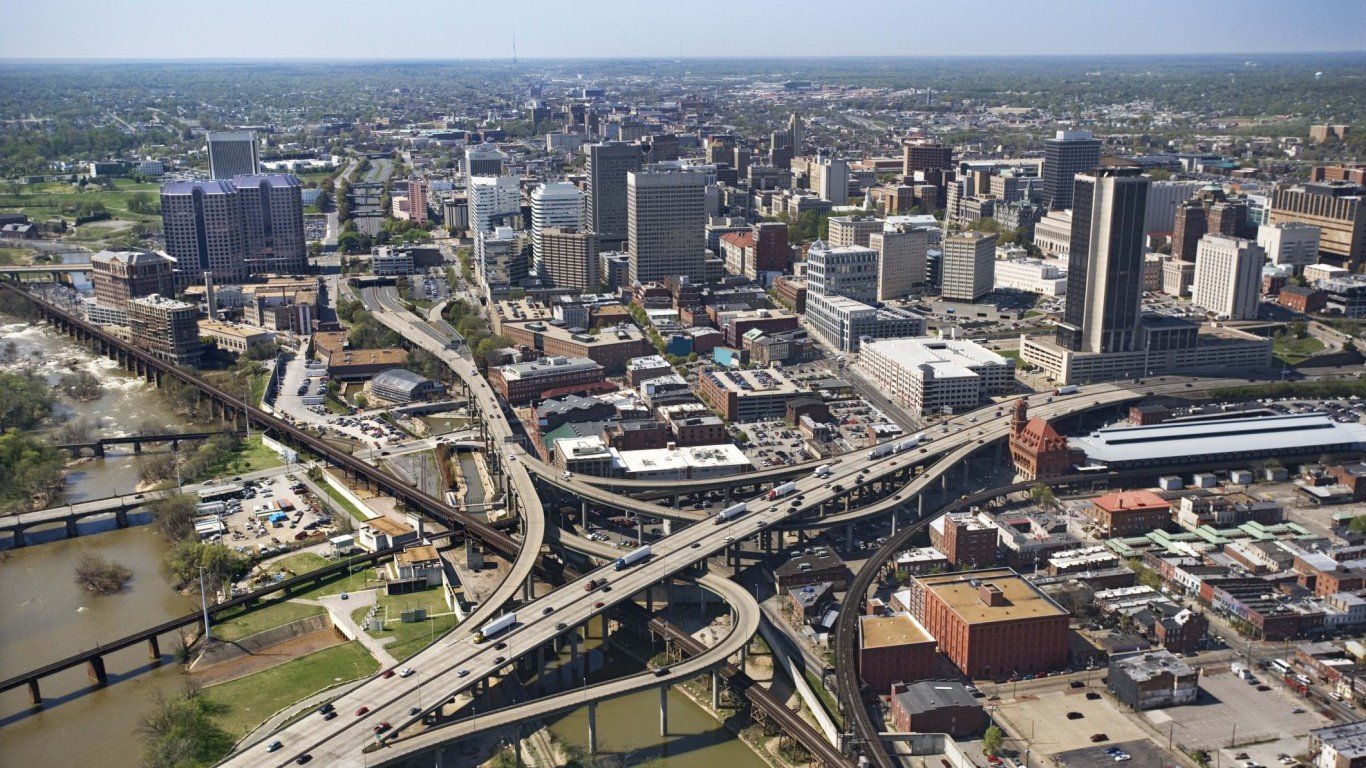
20. Virginia
> Public roads in poor condition: 21.9% (20th highest)
> Deficient bridges: 25.9% (19th highest)
> Added vehicle costs: $254 per motorist (18th lowest)
> Size of road system: 162,592 lane-miles (24th smallest)
Source: Thinkstock
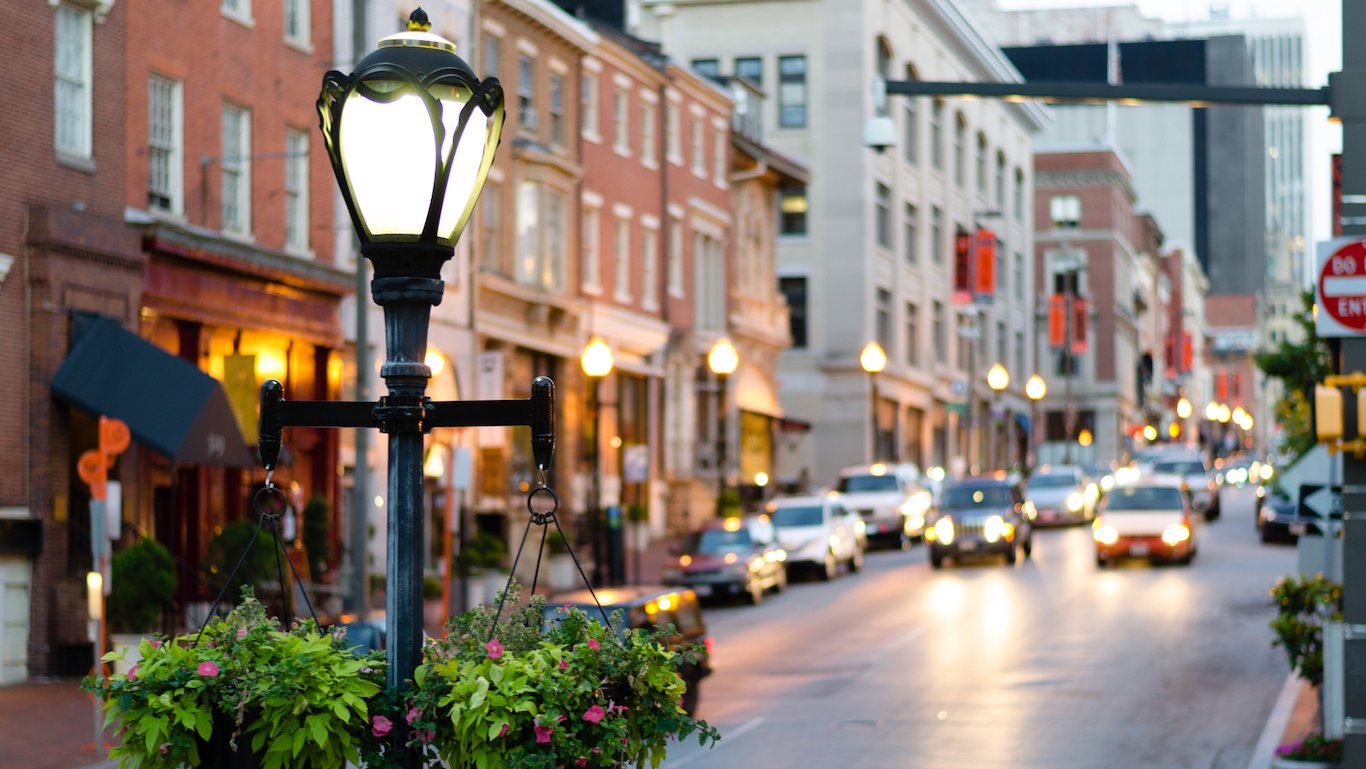
19. Maryland
> Public roads in poor condition: 22.2% (19th highest)
> Deficient bridges: 26.8% (17th highest)
> Added vehicle costs: $422 per motorist (7th highest)
> Size of road system: 70,303 lane-miles (10th smallest)
Source: Thinkstock
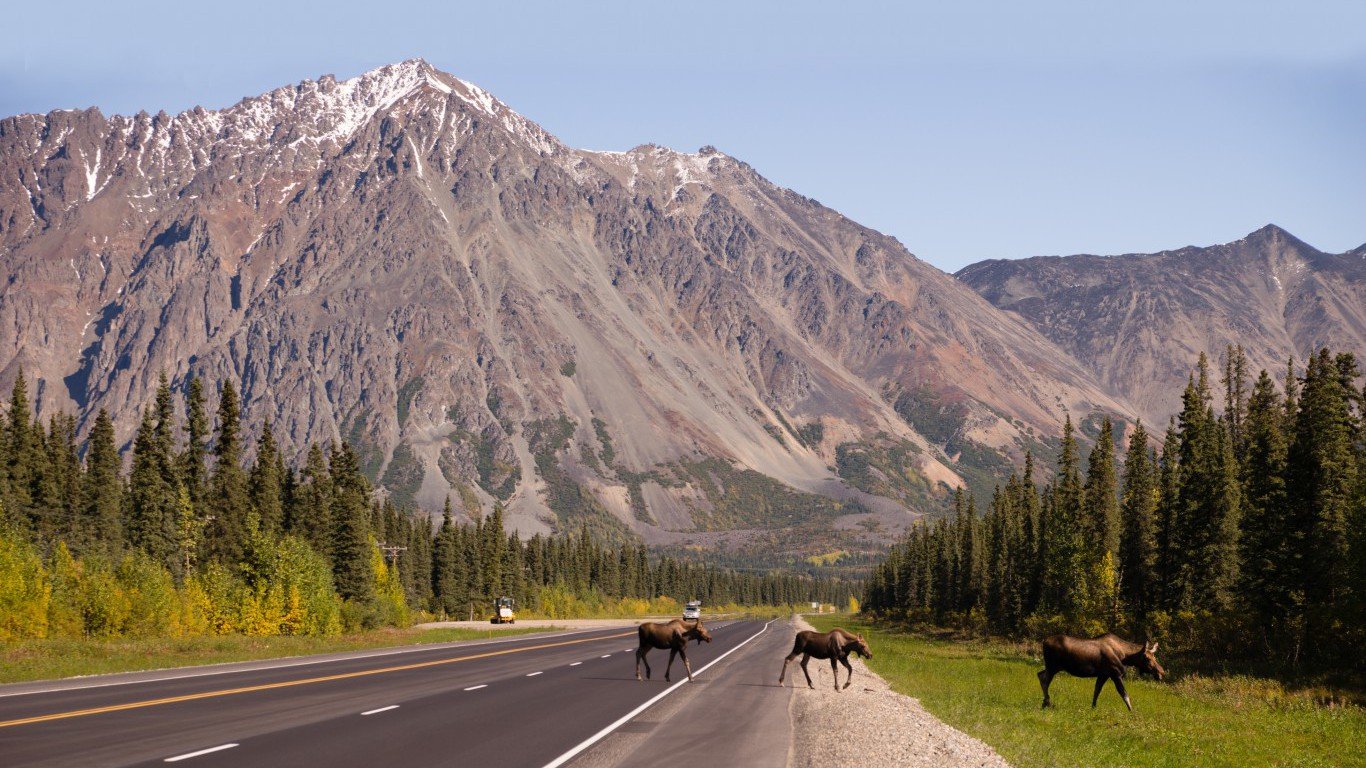
18. Alaska
> Public roads in poor condition: 23.2% (18th highest)
> Deficient bridges: 22.7% (24th lowest)
> Added vehicle costs: $359 per motorist (13th highest)
> Size of road system: 31,716 lane-miles (5th smallest)
Source: Thinkstock
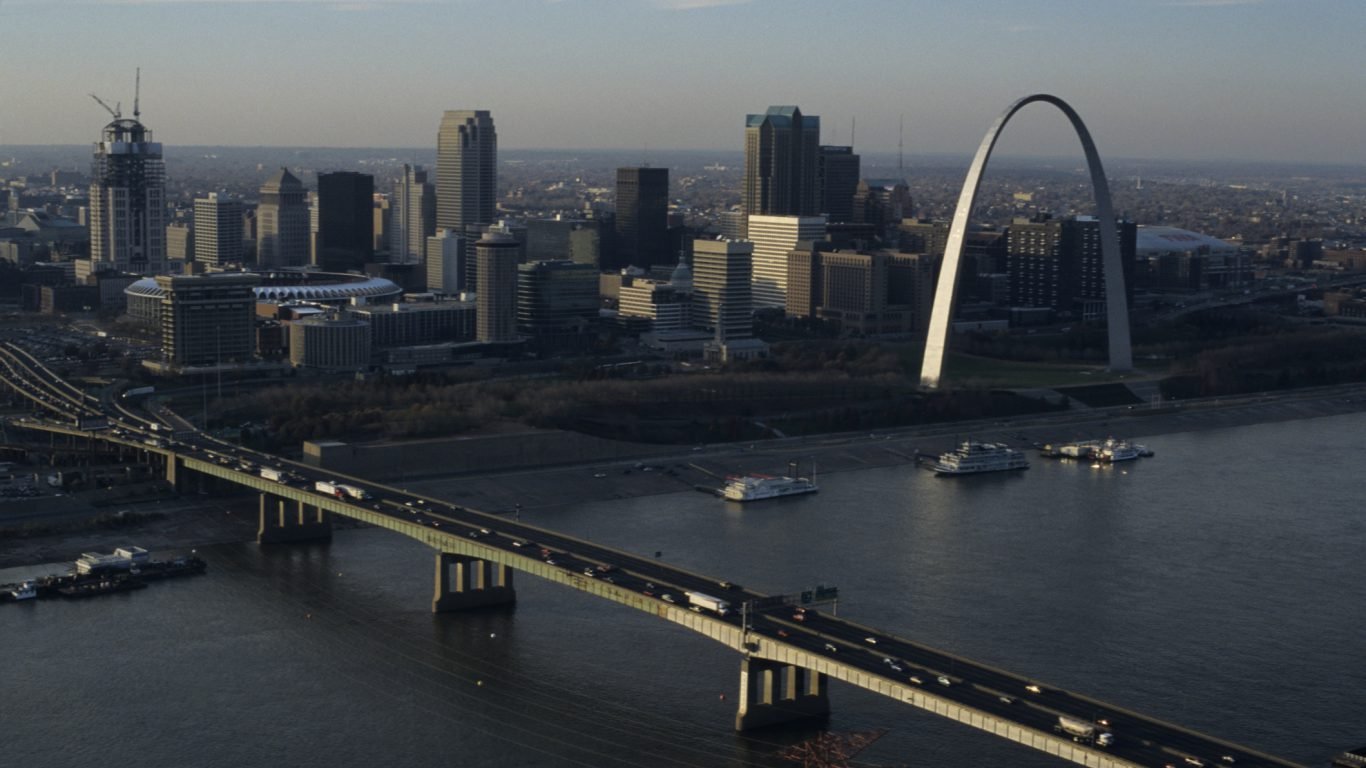
17. Missouri
> Public roads in poor condition: 23.7% (17th highest)
> Deficient bridges: 26.5% (18th highest)
> Added vehicle costs: $380 per motorist (12th highest)
> Size of road system: 272,976 lane-miles (6th largest)
Source: Thinkstock
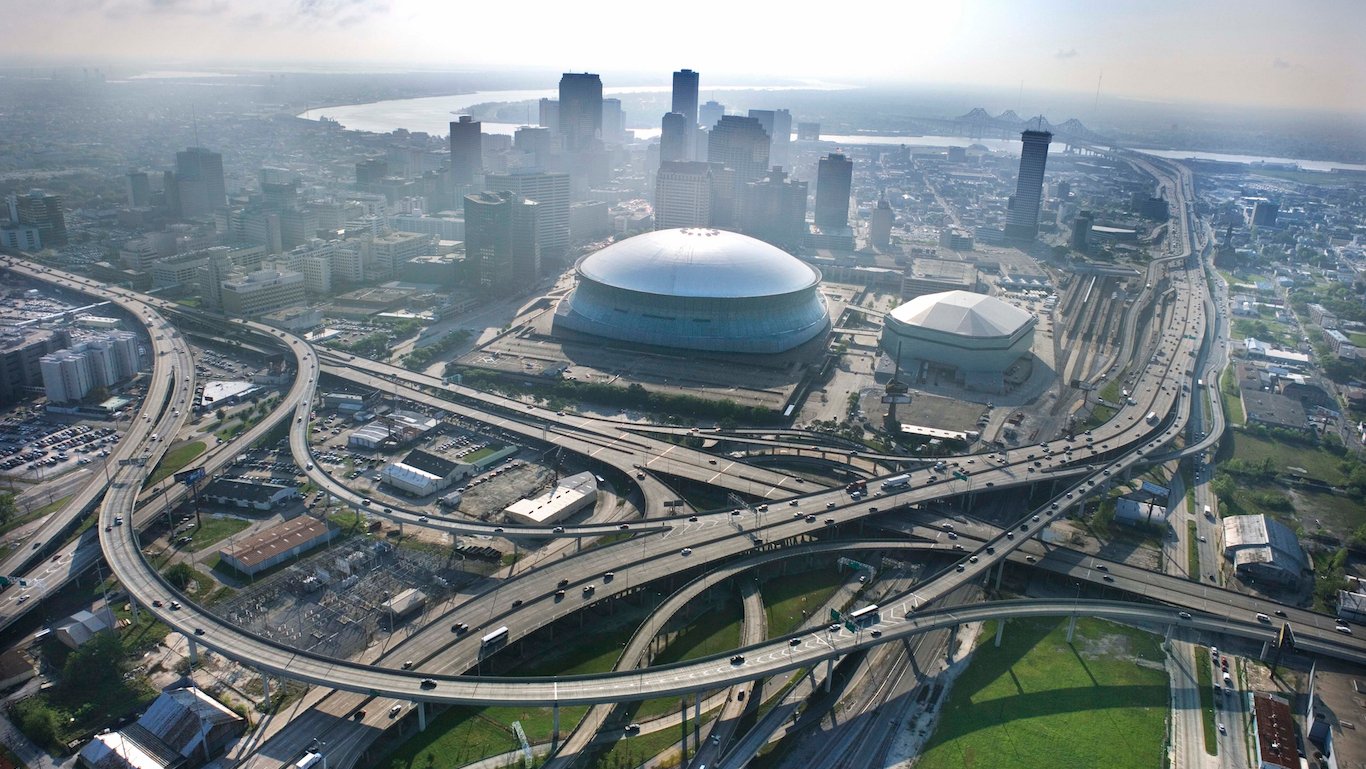
16. Louisiana
> Public roads in poor condition: 23.9% (16th highest)
> Deficient bridges: 29.1% (14th highest)
> Added vehicle costs: $408 per motorist (9th highest)
> Size of road system: 130,024 lane-miles (17th smallest)
Source: Wikimedia Commons
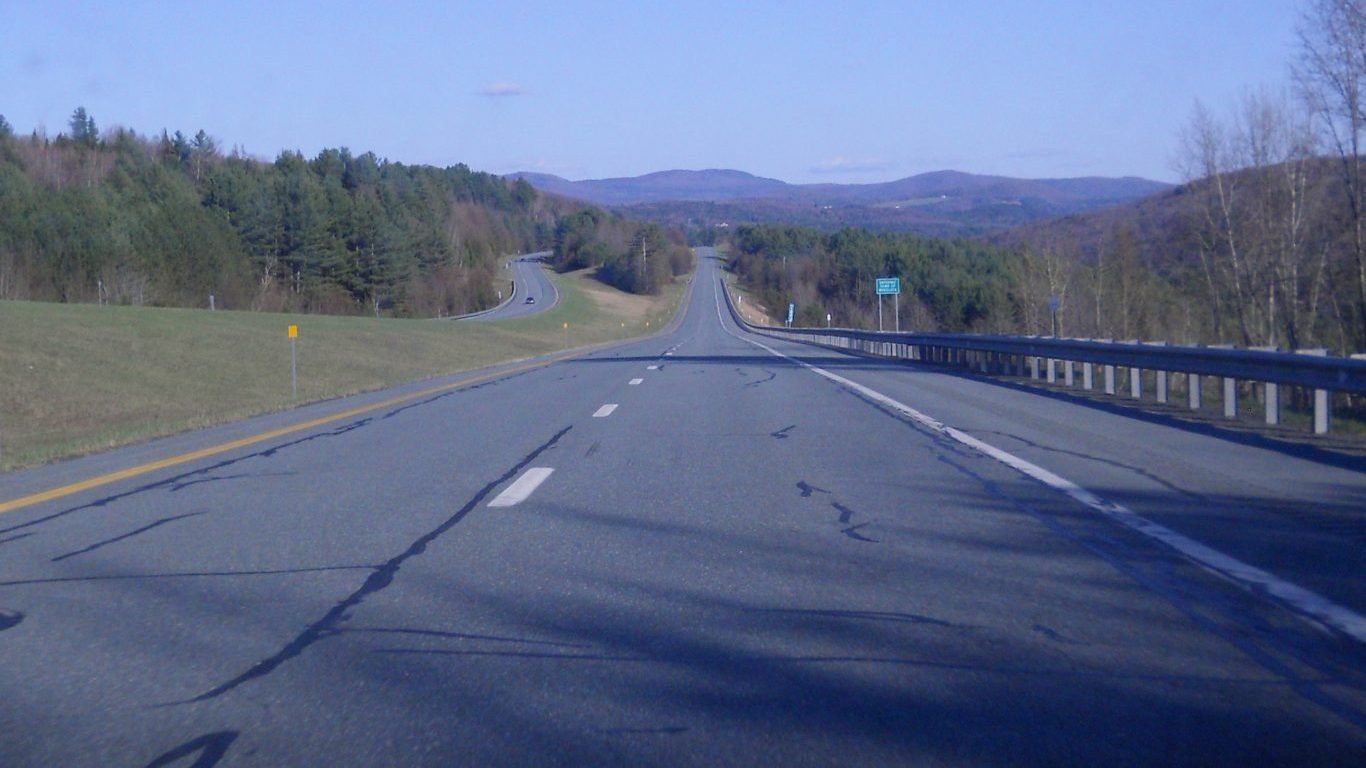
15. Vermont
> Public roads in poor condition: 24.6% (15th highest)
> Deficient bridges: 32.1% (10th highest)
> Added vehicle costs: $424 per motorist (6th highest)
> Size of road system: 29,219 lane-miles (4th smallest)
Source: Thinkstock
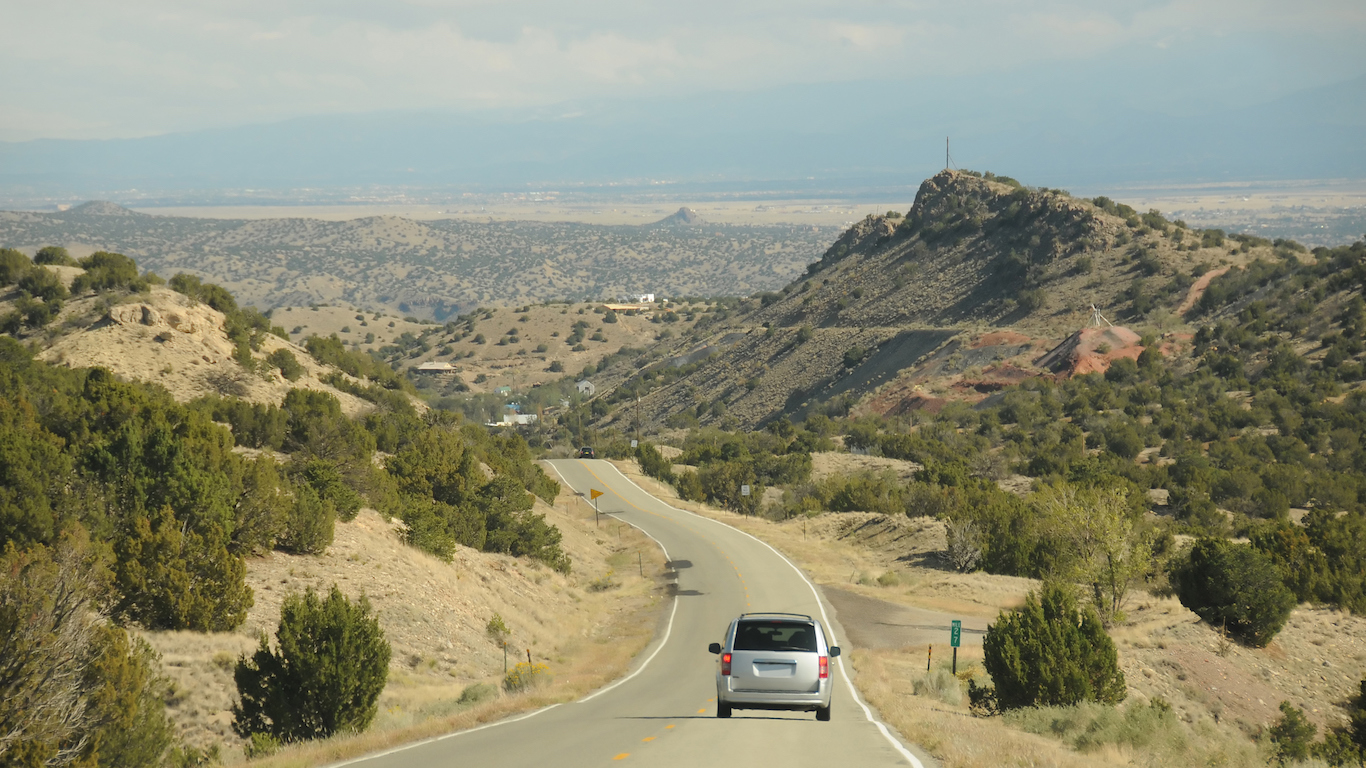
14. New Mexico
> Public roads in poor condition: 24.7% (14th highest)
> Deficient bridges: 16.3% (8th lowest)
> Added vehicle costs: $291 per motorist (24th highest)
> Size of road system: 143,255 lane-miles (19th smallest)
Source: Thinkstock
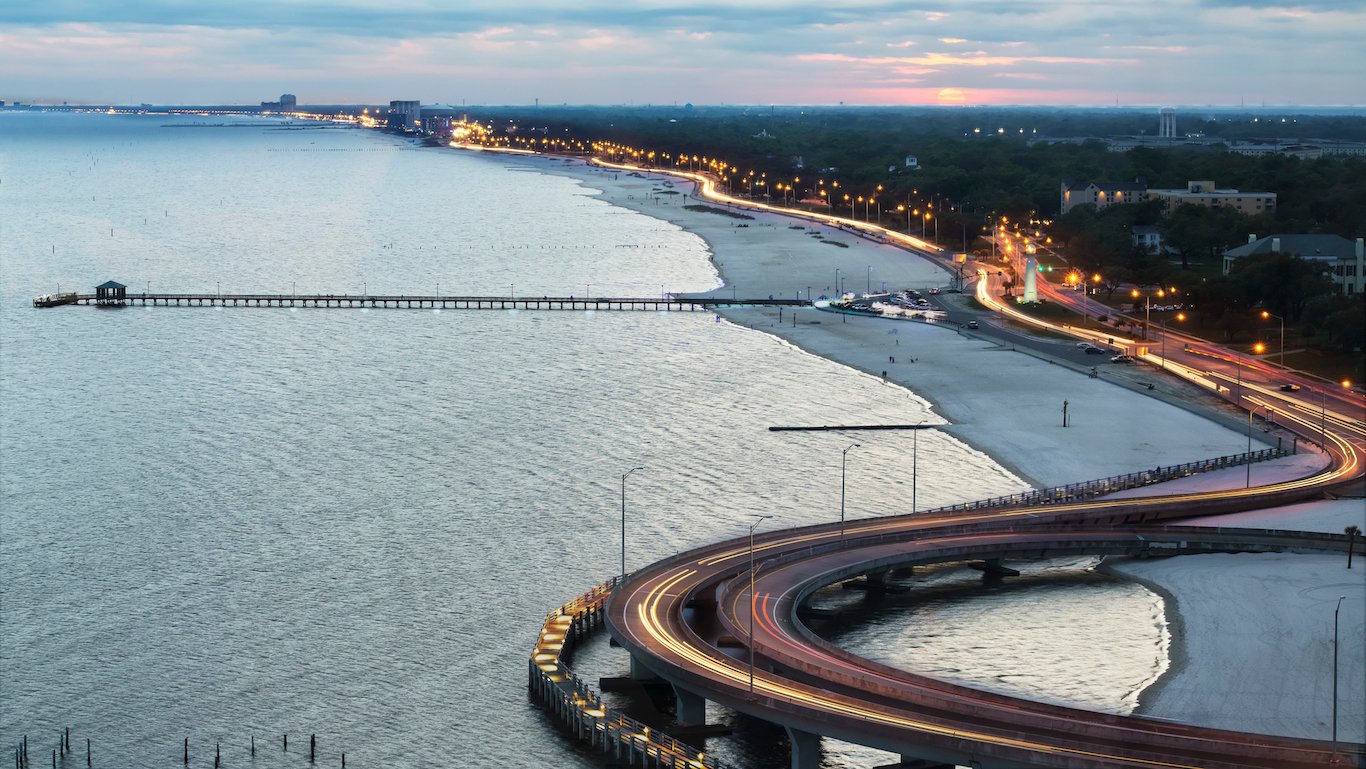
13. Mississippi
> Public roads in poor condition: 25.7% (13th highest)
> Deficient bridges: 20.9% (18th lowest)
> Added vehicle costs: $419 per motorist (8th highest)
> Size of road system: 158,491 lane-miles (22nd smallest)
Source: Thinkstock
12. West Virginia
> Public roads in poor condition: 28.5% (12th highest)
> Deficient bridges: 34.8% (7th highest)
> Added vehicle costs: $273 per motorist (23rd lowest)
> Size of road system: 79,934 lane-miles (12th smallest)
Source: Thinkstock
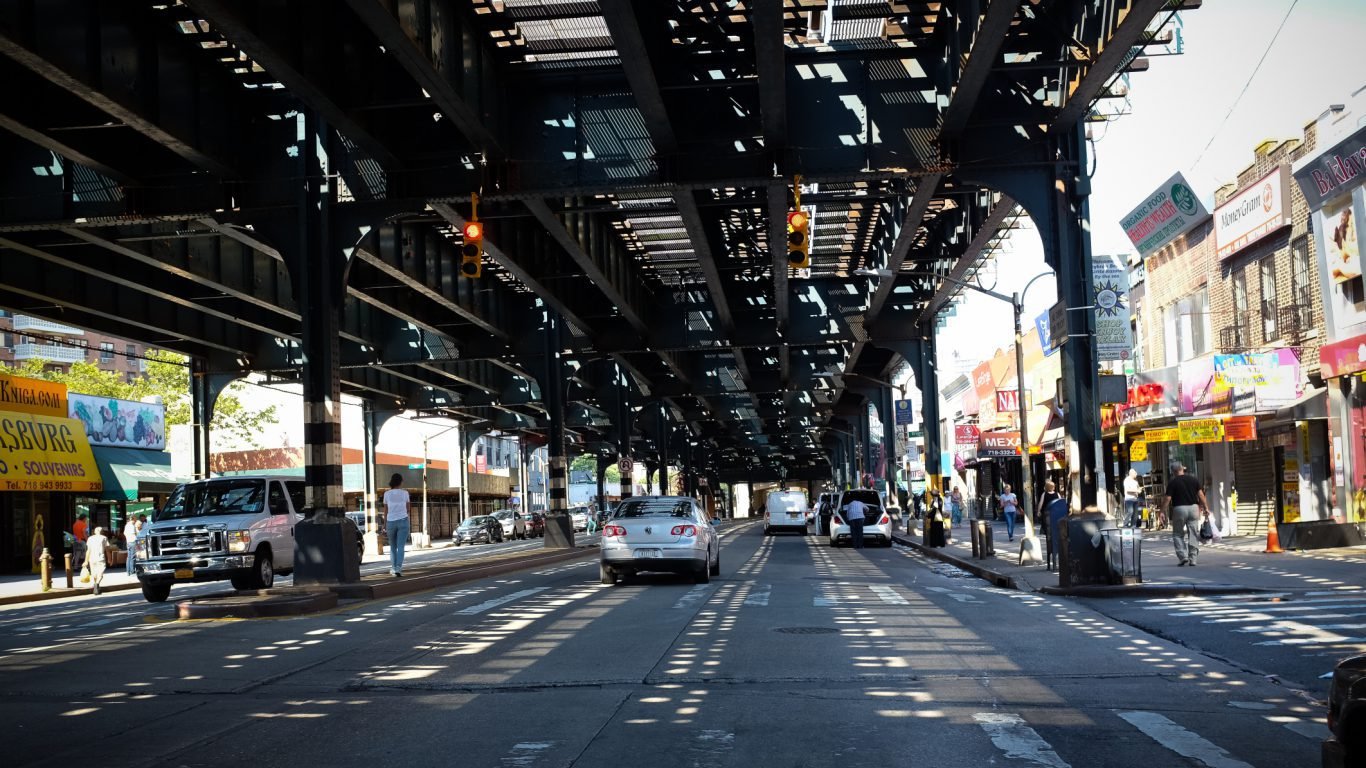
11. New York
> Public roads in poor condition: 28.6% (11th highest)
> Deficient bridges: 38.6% (5th highest)
> Added vehicle costs: $403 per motorist (10th highest)
> Size of road system: 242,447 lane-miles (12th largest)
Source: Thinkstock
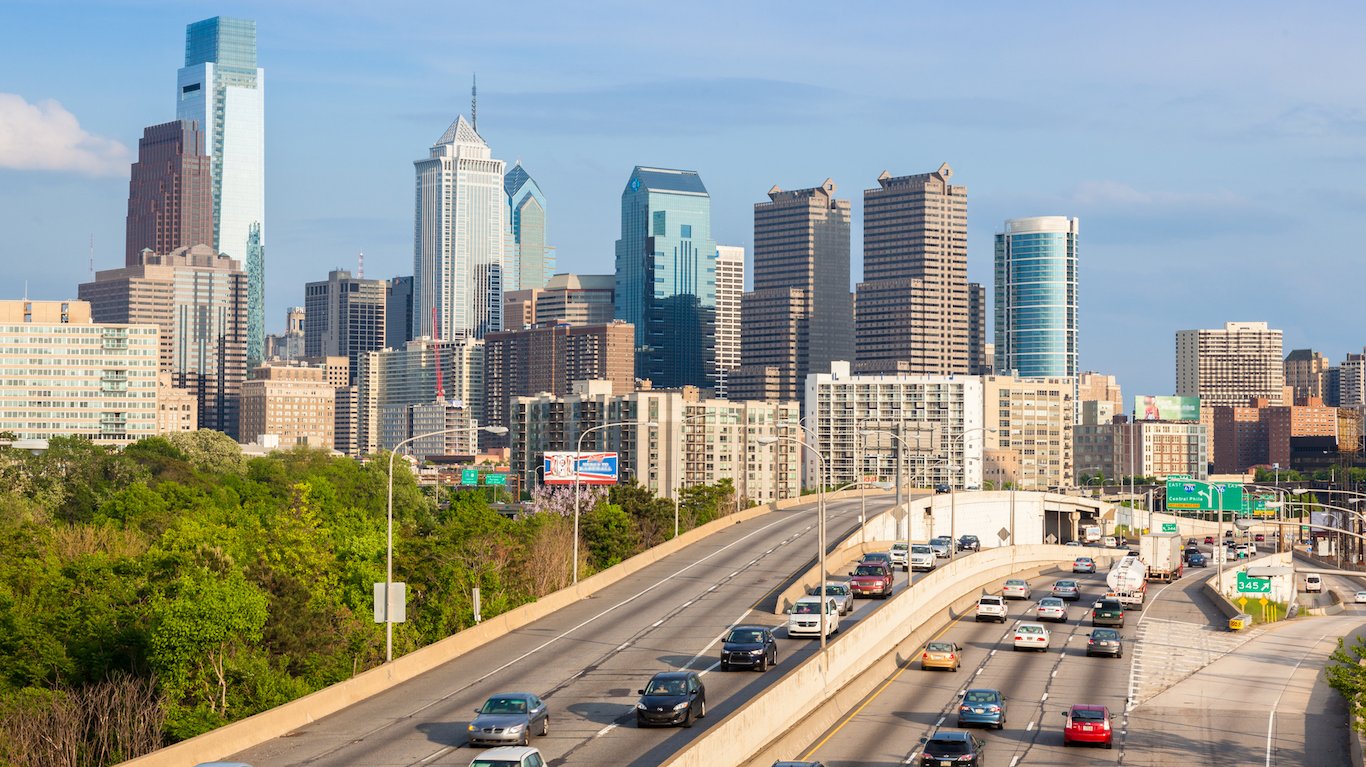
10. Pennsylvania
> Public roads in poor condition: 28.7% (10th highest)
> Deficient bridges: 41.6% (4th highest)
> Added vehicle costs: $341 per motorist (16th highest)
> Size of road system: 250,380 lane-miles (11th largest)

Source: Thinkstock
9. Massachusetts
> Public roads in poor condition: 30.1% (9th highest)
> Deficient bridges: 52.2% (2nd highest)
> Added vehicle costs: $313 per motorist (19th highest)
> Size of road system: 76,873 lane-miles (11th smallest)
Source: Wikimedia Commons
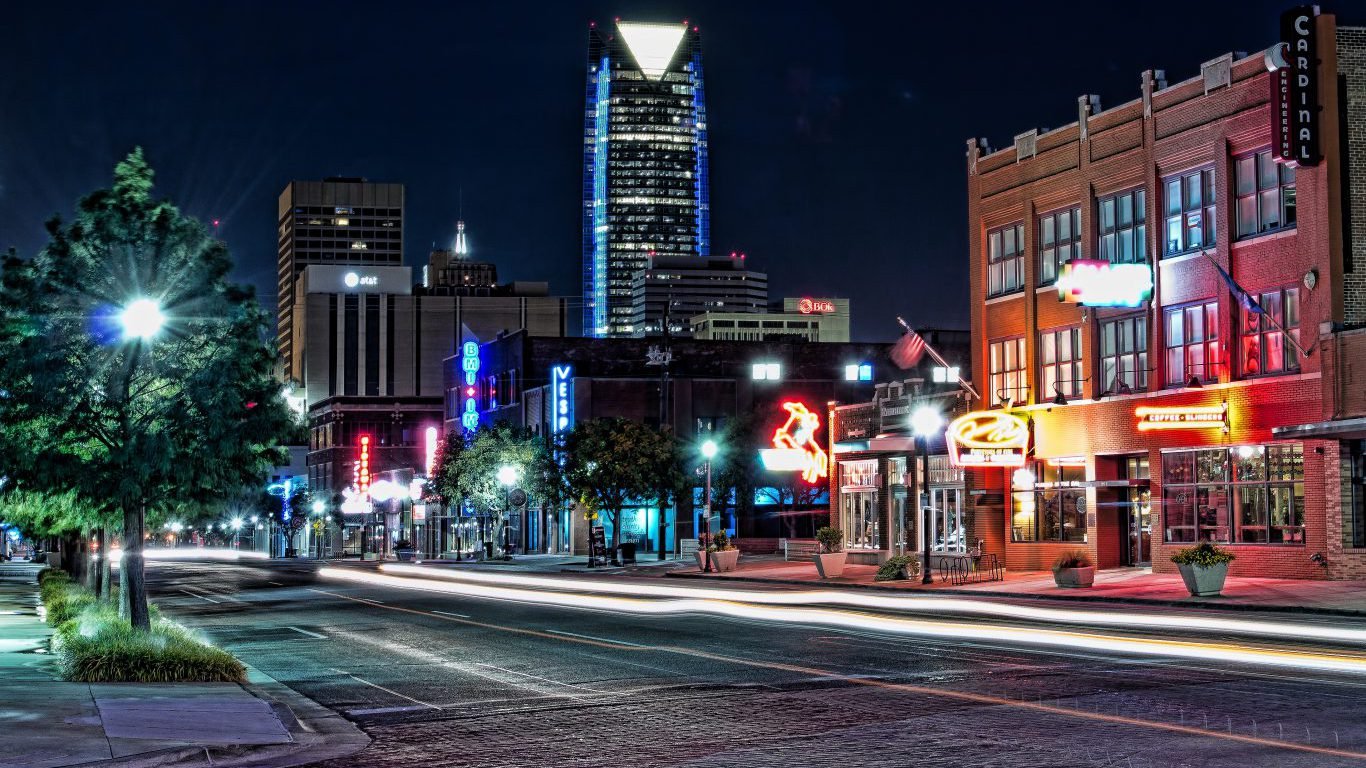
8. Oklahoma
> Public roads in poor condition: 30.1% (8th highest)
> Deficient bridges: 25.0% (22nd highest)
> Added vehicle costs: $425 per motorist (5th highest)
> Size of road system: 234,129 lane-miles (14th largest)
Source: Thinkstock
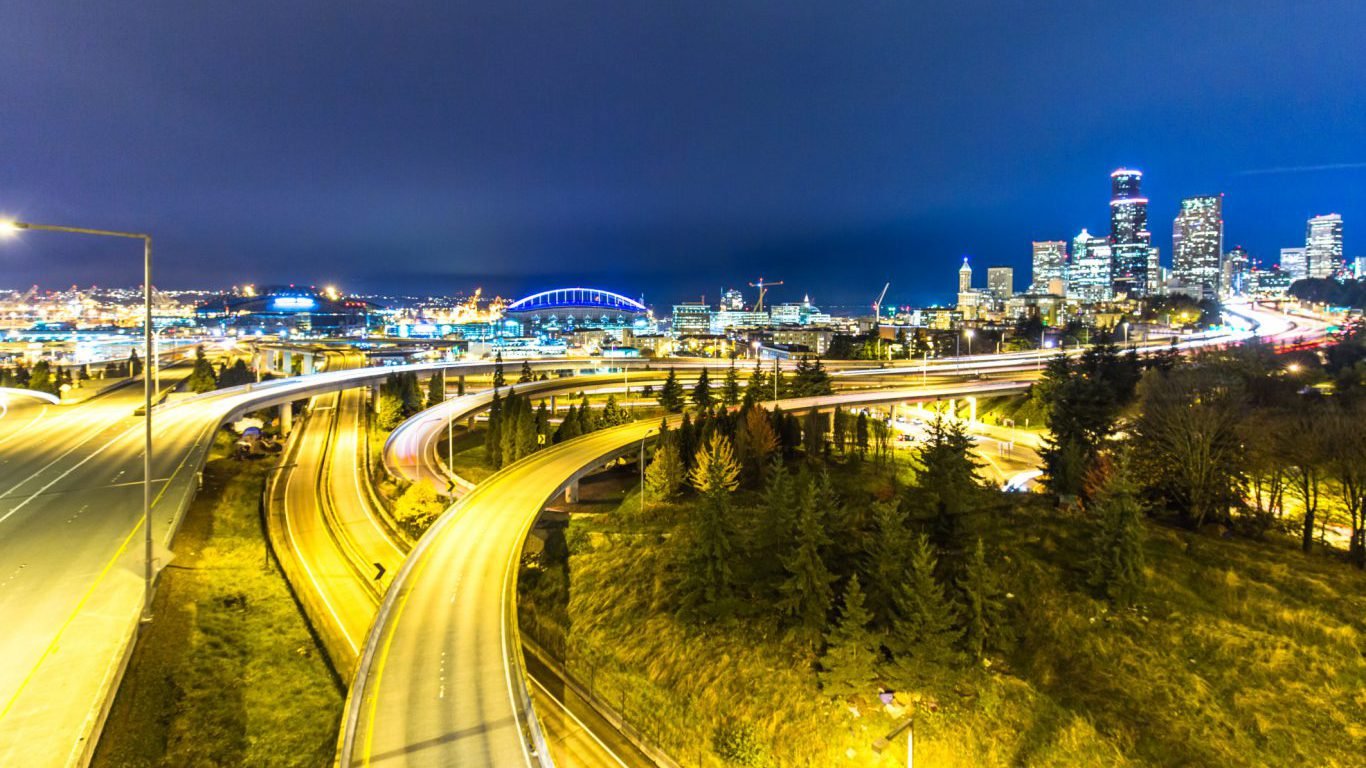
7. Washington
> Public roads in poor condition: 31.1% (7th highest)
> Deficient bridges: 25.8% (20th highest)
> Added vehicle costs: $272 per motorist (22nd lowest)
> Size of road system: 169,011 lane-miles (24th largest)
 24/7 Wall St.
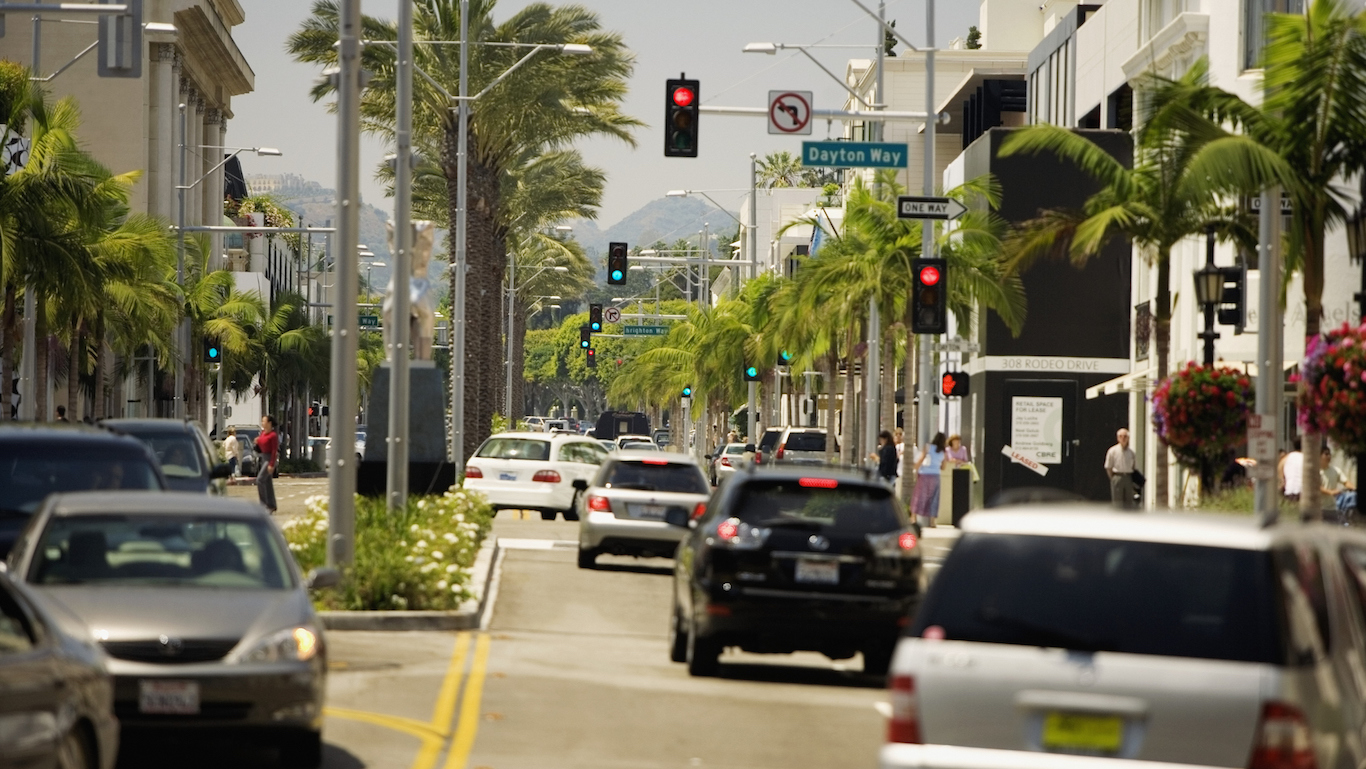
Source: Thinkstock
6. California
> Public roads in poor condition: 37.0% (6th highest)
> Deficient bridges: 26.8% (16th highest)
> Added vehicle costs: $586 per motorist (2nd highest)
> Size of road system: 478,377 lane-miles (2nd largest)
Source: Thinkstock
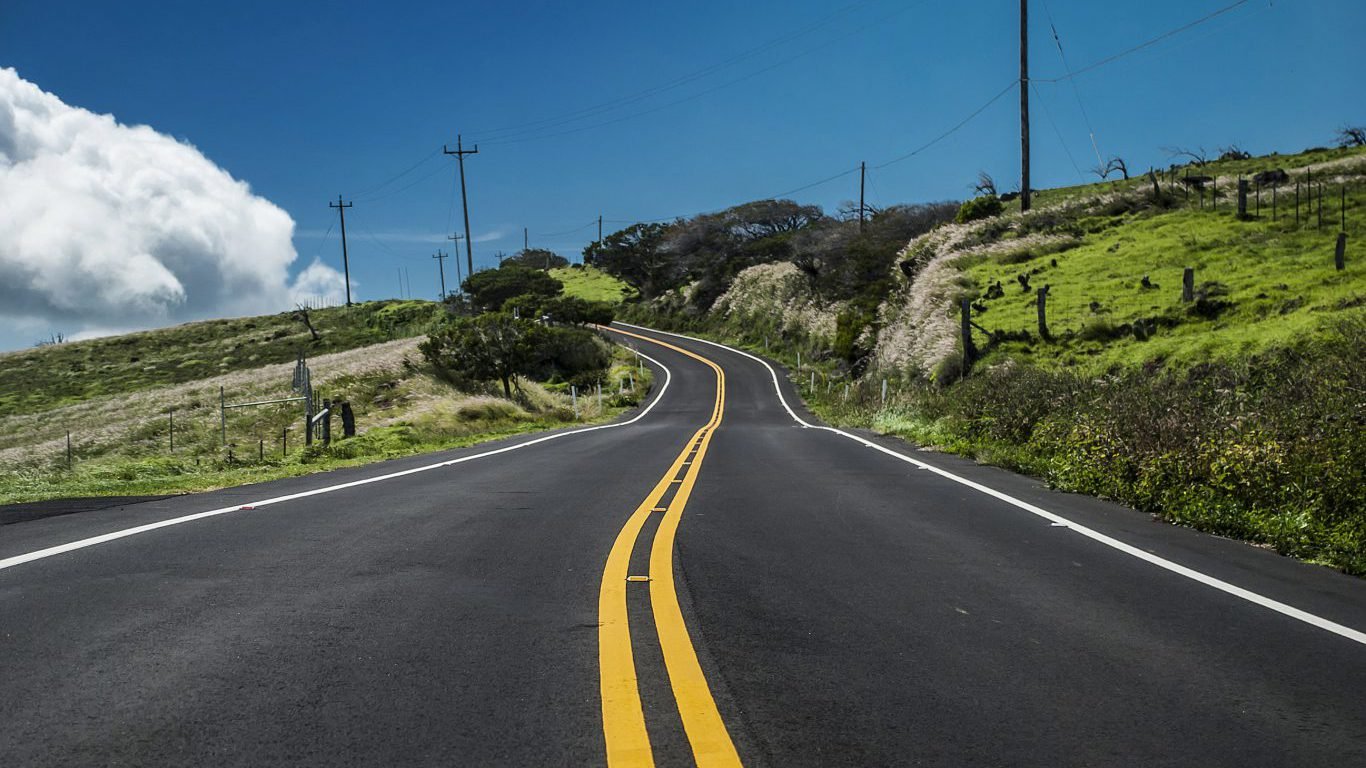
5. Hawaii
> Public roads in poor condition: 38.3% (5th highest)
> Deficient bridges: 42.5% (3rd highest)
> Added vehicle costs: $515 per motorist (3rd highest)
> Size of road system: 9,698 lane-miles (the smallest)
Source: Wikimedia Commons
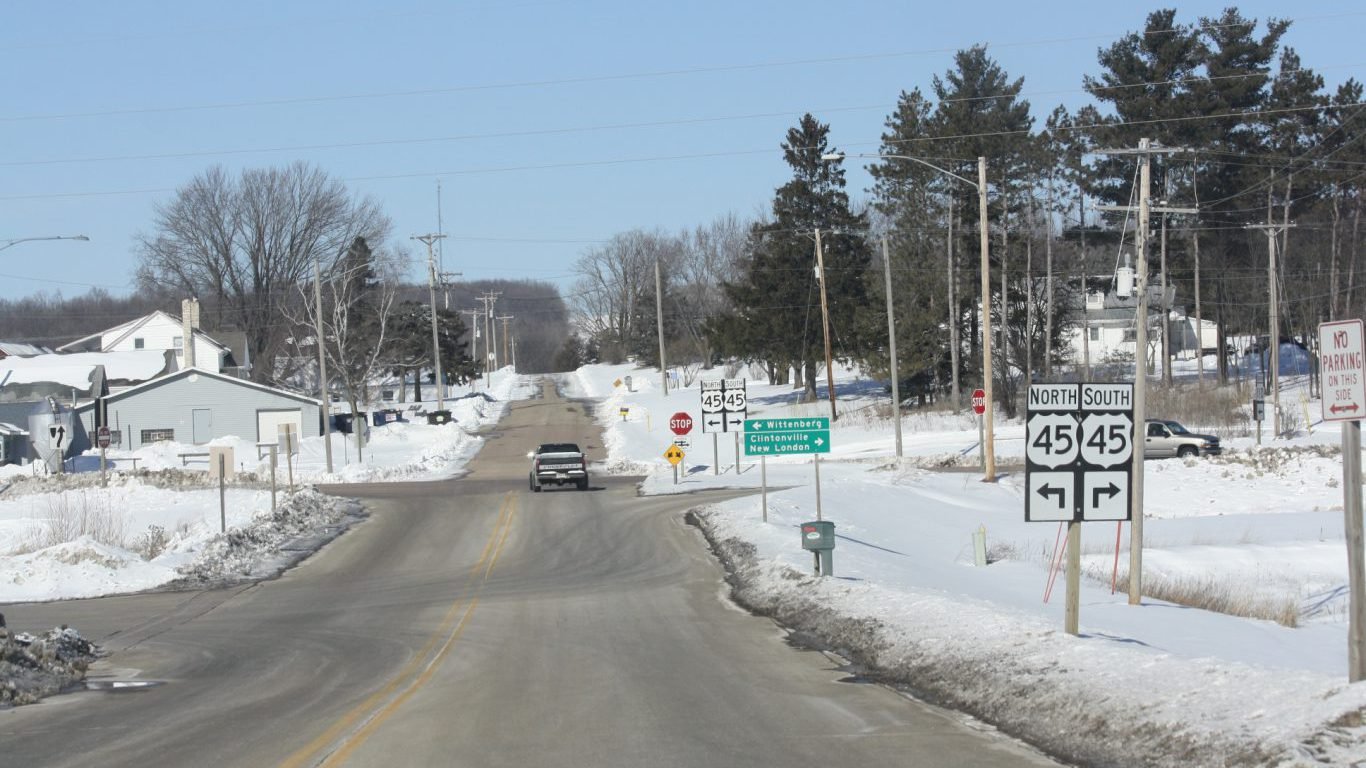
4. Wisconsin
> Public roads in poor condition: 42.0% (4th highest)
> Deficient bridges: 14.0% (5th lowest)
> Added vehicle costs: $281 per motorist (24th lowest)
> Size of road system: 238,240 lane-miles (13th largest)

Source: Thinkstock
3. Connecticut
> Public roads in poor condition: 44.5% (3rd highest)
> Deficient bridges: 34.5% (8th highest)
> Added vehicle costs: $294 per motorist (22nd highest)
> Size of road system: 45,809 lane-miles (7th smallest)
Source: Wikimedia Commons
2. New Jersey
> Public roads in poor condition: 48.7% (2nd highest)
> Deficient bridges: 35.5% (6th highest)
> Added vehicle costs: $601 per motorist (the highest)
> Size of road system: 85,266 lane-miles (13th smallest)
Source: Thinkstock
1. Rhode Island
> Public roads in poor condition: 52.0% (the highest)
> Deficient bridges: 56.0% (the highest)
> Added vehicle costs: $467 per motorist (4th highest)
> Size of road system: 12,762 lane-miles (2nd smallest)
Essential Tips for Investing: Sponsored
A financial advisor can help you understand the advantages and disadvantages of investment properties. Finding a qualified financial advisor doesn’t have to be hard. SmartAsset’s free tool matches you with up to three financial advisors who serve your area, and you can interview your advisor matches at no cost to decide which one is right for you. If you’re ready to find an advisor who can help you achieve your financial goals, get started now.
Investing in real estate can diversify your portfolio. But expanding your horizons may add additional costs. If you’re an investor looking to minimize expenses, consider checking out online brokerages. They often offer low investment fees, helping you maximize your profit.
Thank you for reading! Have some feedback for us?
Contact the 24/7 Wall St. editorial team.
Editors' Picks

