Special Report
The Worst Counties to Live In

Published:
Last Updated:
The U.S. population reached 316.5 million in 2015, an increase of 12.5 million from five years ago. In some areas of the country, however, the population declined substantially over that time. These counties have suffered from decades-long economic decline and job losses, and today struggle with severe unemployment, poverty, and public health issues.
To determine the worst counties to live in, 24/7 Wall St. developed an index based on three social measures — educational attainment, poverty rate, and life expectancy — and ranked counties based on their well-being. Most of the lowest ranked counties — reporting the lowest educational attainment, highest poverty, and lowest life expectancy — are in the rural South, concentrated within the Mississippi Delta and Eastern Kentucky Coalfield regions.
[in-text-ad]
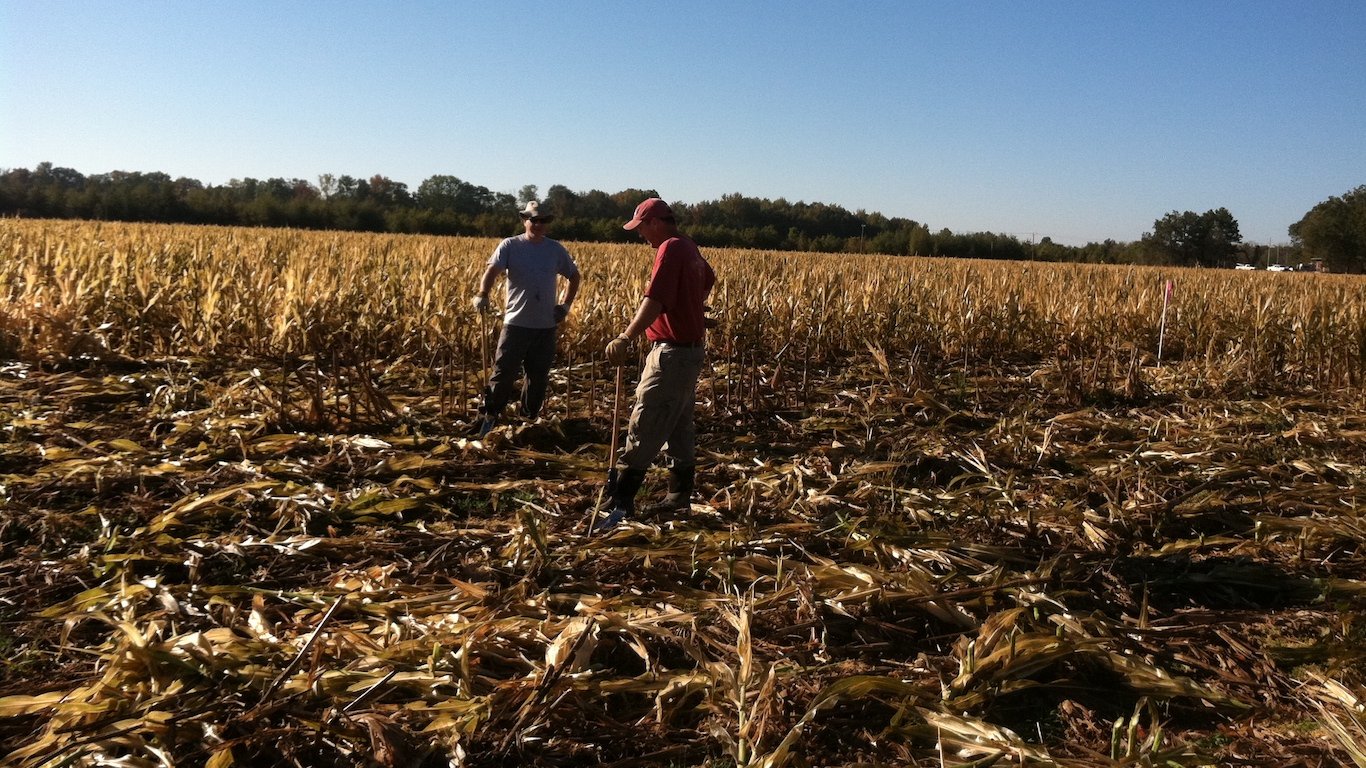
Once a dominant power in U.S. manufacturing, the Mississippi Delta has endured a steep economic decline for most of the 20th century. The populations of many counties in the Mississippi Delta peaked in 1940 or earlier. The declines in these counties’ populations was largely due to job losses, the result of the mechanization in the agriculture and manufacturing industries. Of the 25 counties on this list, six are in the Mississippi Delta region.
Click here to see the worst counties to live in.
Click here to see the best counties to live in.
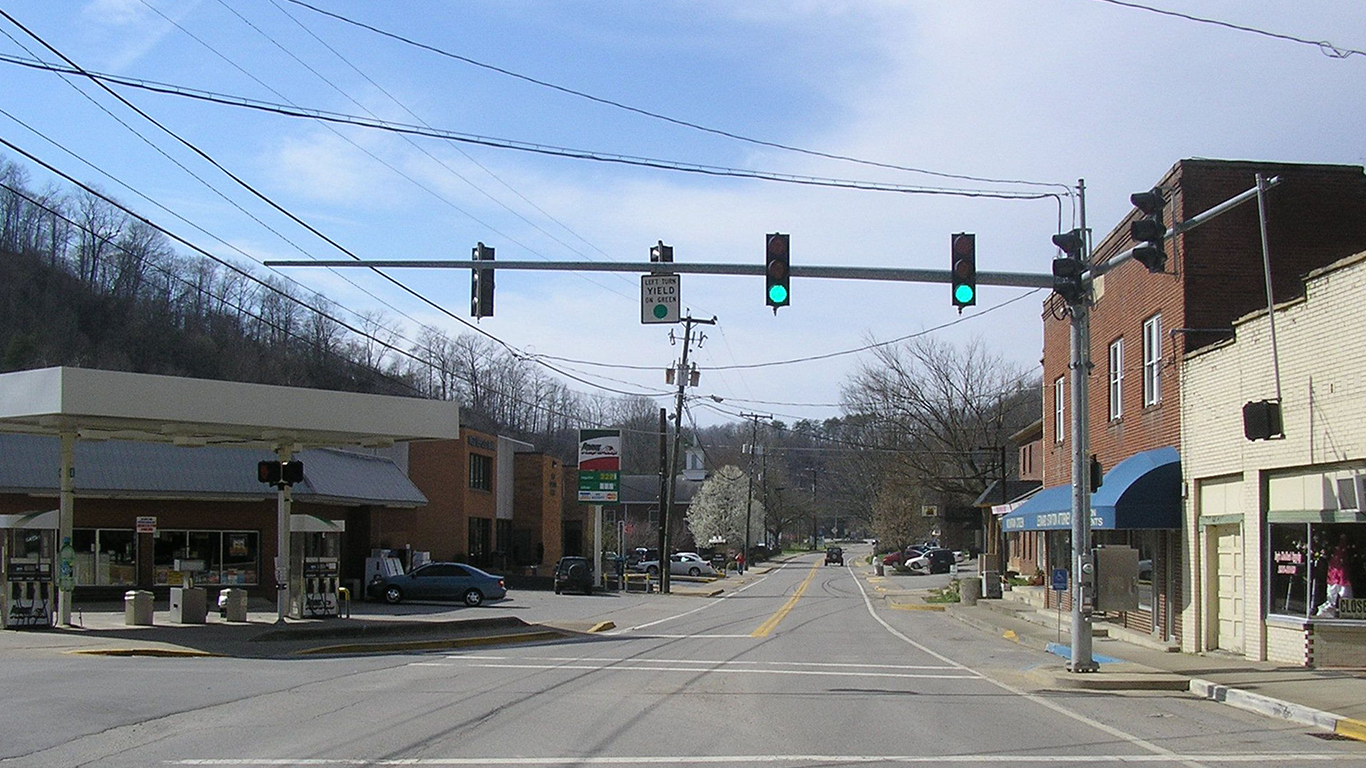
A similar decline took place in a region known as the Eastern Kentucky Coalfield. The regional economy has its roots in coal mining and remains heavily dependent on the industry today. Many towns in eastern Kentucky were first established and built by mining companies. However, due to inexpensive natural gas, stricter federal regulations, and the evolution of renewable energy sources, the Kentucky coal industry has been in steep decline over the last several decades. Of the 25 worst counties to live in, eight are in the Eastern Kentucky Coalfield region.
Many of these counties, unable to establish new industries, remain economically stagnant. In hope of attracting new companies and industries, places such as Quitman County, Mississippi, and McCreary County, Kentucky have built speculative industrial parks and corporate buildings. However, they lack the talent pools that wealthier, more-educated counties often have to offer. In the average county in the Eastern Kentucky Coalfield region, just 13.1% of adults have at least a bachelor’s degree, far less than the 29.8% national college attainment rate.
Unable to improve their economies, joblessness is rampant in the majority of counties on this list. Unemployment is higher than it is nationwide in each of these counties, and in nine counties on this list, the unemployment rate more than doubles the 4.6% national rate.
The available jobs in many of these counties are often low paying. The median annual household income in nearly every county on this list is less than half the $53,889 the typical American household earns a year. High unemployment and low incomes mean that disproportionately large shares of residents regularly face serious financial hardship. In every county on this list, the share of the population living in poverty is more than double the 15.5% national poverty rate. In Oglala Lakota County, South Dakota, more than half of the population lives below the poverty line.
The relationship between income and overall health is complicated and not completely understood. However, below a certain income level, people can become seriously limited in their ability to afford healthy options related to diet, health care, and lifestyle. According to a more than decade-long study conducted by the American Medical Association, higher income is associated with greater longevity in general. Likely due in part to widespread poverty in the counties on this list, average life expectancy at birth in the vast majority of these counties is at least five years shorter than the 78.9 year national average life expectancy.
To identify the worst counties in which to live, 24/7 Wall St. devised an index composed of three socioeconomic measures — poverty rate, the percentage of adults who have at least a bachelor’s degree, and life expectancy at birth — and ranked counties based on the index. The selection of these three measures was inspired by the United Nations’ Human Development Index. Poverty, uninsured, and bachelor attainment rates came from the U.S. Census Bureau’s 2015 American Community Survey. Population data also came from the ACS. Life expectancies at birth are from the Institute for Health Metrics and Evaluation, a health research center affiliated with the University of Washington, and are for 2013. Unemployment rates are from the Bureau of Labor Statistics and are for November 2016, the most recent available month of data.
These are the 25 worst counties to live in.

25. Greene County, Alabama
> 5-yr. population change: -6.0%
> Nov. unemployment rate: 10.1%
> Poverty rate: 40.2%
> Life expectancy at birth: 73.6 years
By most measures of economic and physical well-being, Greene County is one of the worst counties to live in nationwide. An estimated 10.1% of the county’s labor force is unemployed, far more than the 5.9% unemployment rate in Alabama. For those who are employed, the wages are among the lowest in the country. The typical county household earns just $20,541 annually, less than in all but four other U.S. counties and far less than half the median household income of $53,889 nationwide. With a difficult job market and fairly low pay, many area residents live on poverty wages. Greene County is one of only 18 U.S. counties in which more than 40% of the population lives below the poverty line, more than twice the 16% national poverty rate.
[in-text-ad]
24. Wilcox County, Alabama
> 5-yr. population change: -6.5%
> Nov. unemployment rate: 14.3%
> Poverty rate: 37.7%
> Life expectancy at birth: 72.0 years
Life expectancy in Wilcox County, Alabama is only 72 years, nearly seven years shy of the average life expectancy nationwide. A low income can significantly limit an individual’s ability to make healthy decisions, especially when it comes to diet and exercise. In Wilcox County, a large share of the population faces serious financial problems. An estimated 37.7% of county residents live in poverty, more than double the 15.5% share of Americans who do.
The area’s serious economic problems are likely made worse by a poor job market. More than 14% of the county’s labor force is out of work, more than triple the corresponding national unemployment rate and one of the highest of any U.S. county. Perhaps because of the lack of available jobs, Wilcox County’s population has declined by 6.5% in the past half decade.
23. Breathitt County, Kentucky
> 5-yr. population change: -4.3%
> Nov. unemployment rate: 7.2%
> Poverty rate: 32.9%
> Life expectancy at birth: 70.6 years
Nearly a third of Breathitt County’s 13,600 residents live on poverty wages. Such financial hardship can significantly limit an individual’s choices when it comes to food, access to care, and a number of other health-related concerns. The county’s extremely low average life expectancy of 70.6 years is nearly the lowest of all U.S. counties, and is likely partially attributable to rampant poverty.
Basic education is a key social determinant of a population’s health. Breathitt is one of only a few dozen U.S. counties where fewer than 70% of adults have completed high school.

22. Harlan County, Kentucky
> 5-yr. population change: -4.3%
> Nov. unemployment rate: 9.0%
> Poverty rate: 31.2%
> Life expectancy at birth: 69.9 years
Harlan County, Kentucky is one of only three counties in the United States with an average life expectancy below 70 years. Low life expectancy often correlates with financial difficulties. In Harlan County, 31.2% of residents live in poverty, more than double the national 15.5% poverty rate. Serious financial hardship across the county is due in part to a lack of jobs. As of November last year, the unemployment rate in Harlan County was 9.0%, well above the state and national unemployment rates of 4.8% and 4.6%, respectively.
Educational attainment is an important indicator for quality of life, as having a college degree can greatly increase an individual’s sense of control over their own life. In Harlan County, only 11.7% of adults have a bachelor’s degree, a far smaller share than the comparable 29.8% of American adults.
[in-text-ad-2]

21. Sunflower County, Mississippi
> 5-yr. population change: -8.5%
> Nov. unemployment rate: 8.1%
> Poverty rate: 35.5%
> Life expectancy at birth: 70.6 years
Sunflower County is one of the poorest counties in the nation’s poorest state. Mississippi is the only U.S. state with a median annual household income below $40,000. In Sunflower County, incomes are even lower. The typical county household earns only $27,384 a year. A large share of residents earn extremely low incomes. Over a third of the county’s 27,911 residents live in poverty, well more than double the national 15.5% poverty rate.
Unlike most U.S. counties, Sunflower County’s population is dwindling. In the past half decade, the number of Americans who call Sunflower County home has dropped by 8.5%.

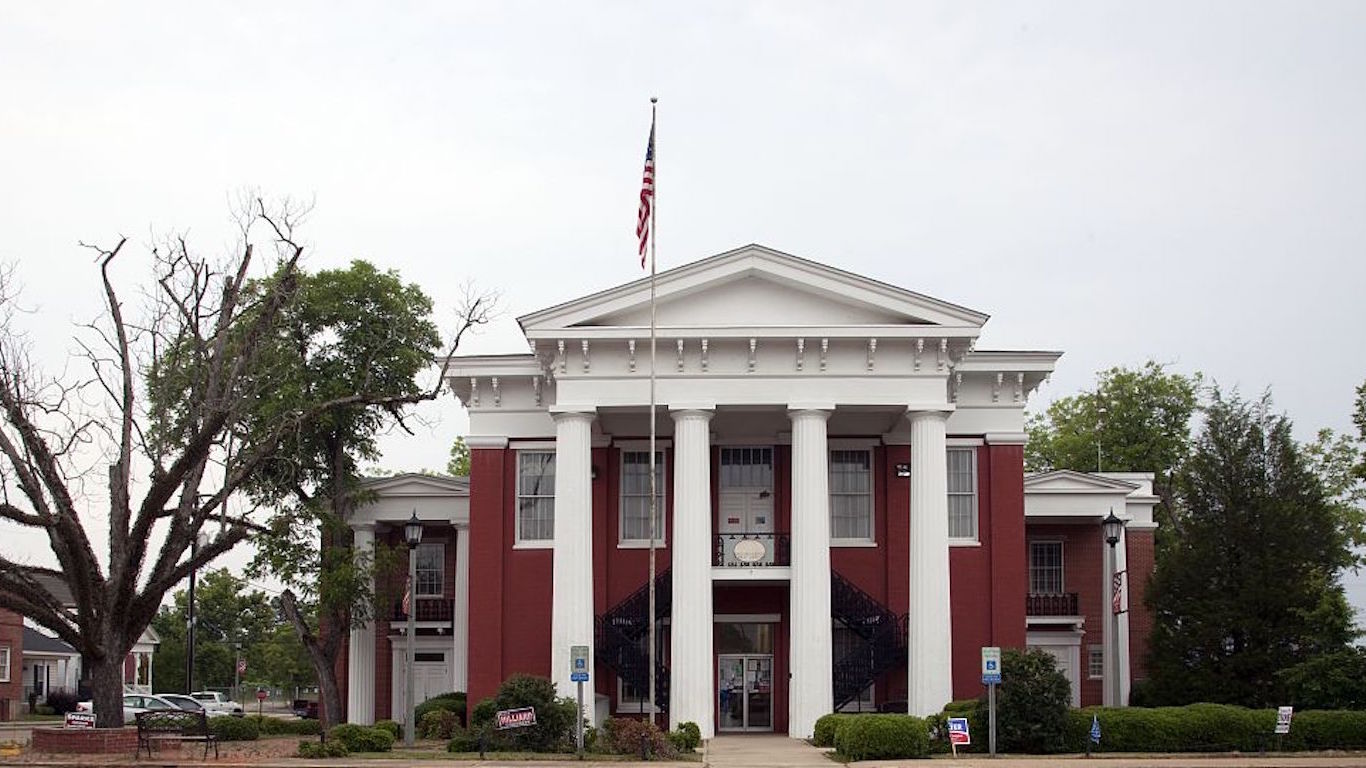
20. Clay County, Georgia
> 5-yr. population change: 4.1%
> Nov. unemployment rate: 8.7%
> Poverty rate: 42.2%
> Life expectancy at birth: 74.9 years
Clay County is one of three counties in Georgia to rank among the worst places to live in the United States. Economic conditions in Clay are a significant barrier to residents’ ability to live healthy and financially secure lives. More than a quarter of county residents lack health insurance, compared to only 13% of Americans. Additionally, Clay County’s 42.2% poverty rate is higher than in all but nine other U.S. counties.
On an individual level, higher educational attainment often leads to a greater sense of control over one’s life, and ultimately a greater quality of life. In Clay, only 7.8% of adults have earned a bachelor’s degree, well below the 29.8% share of adults nationwide who have.
[in-text-ad]
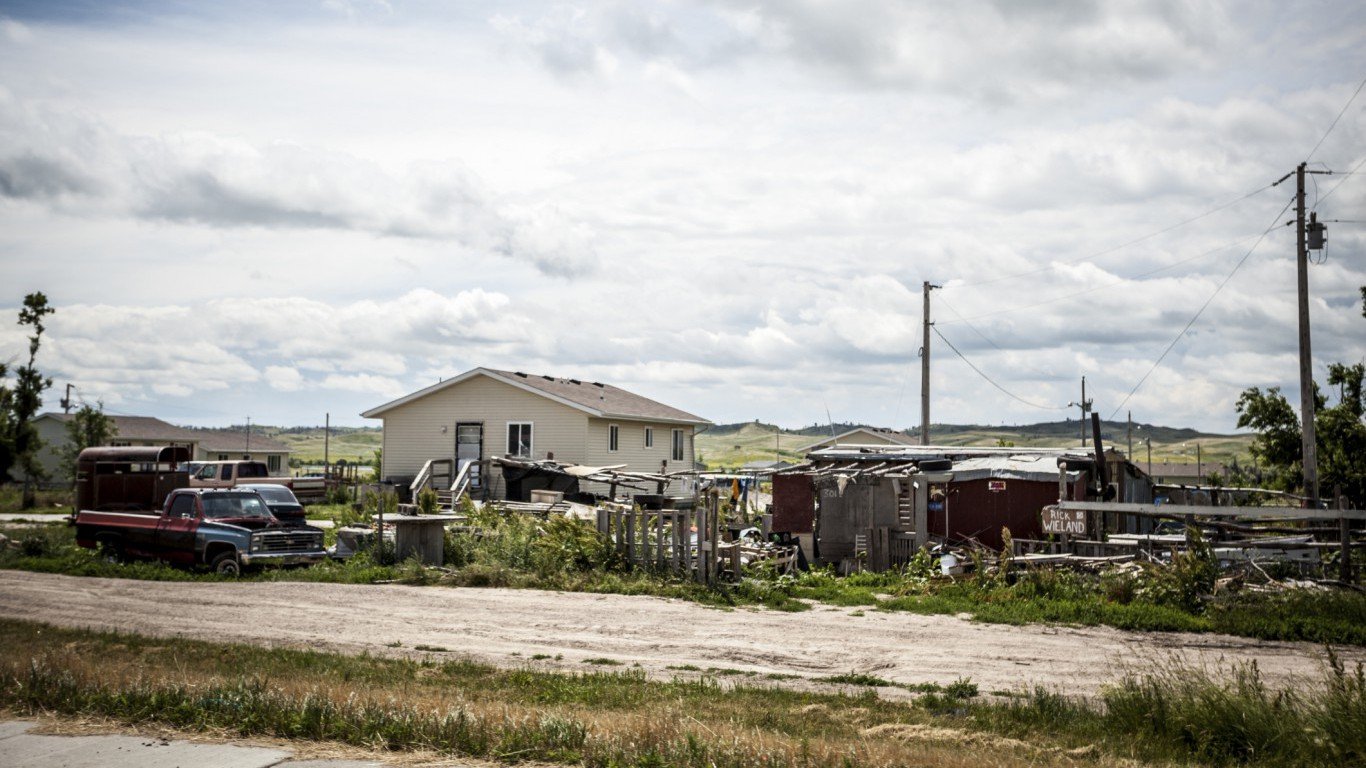
19. Oglala Lakota County, South Dakota
> 5-yr. population change: 5.3%
> Nov. unemployment rate: 10.5%
> Poverty rate: 53.3%
> Life expectancy at birth: N/A
Oglala Lakota County is located entirely within the Pine Ridge Indian Reservation in the southwest corner of South Dakota. The county is named after the Oglala Lakota people, a subtribe of the Lakotas, who make up the bulk of the area’s population. The Pine Ridge Indian Reservation and its inhabitants face many of the same impediments to well-being that American Indian communities throughout South Dakota face, such as poverty and unemployment. The typical household in the county earns just $26,369 annually, less than half the $53,889 U.S. median household income. Oglala Lakota County is also the only U.S. county in which more than 50% of the population lives in poverty, far more than the 15.5% national poverty rate.

18. Owsley County, Kentucky
> 5-yr. population change: -2.7%
> Nov. unemployment rate: 7.5%
> Poverty rate: 37.9%
> Life expectancy at birth: 70.7 years
According to the Department of Education, high school dropouts are more than twice as likely as those with a four-year college degree to live in poverty. In Owsley County, only 68.0% of adults have completed high school, well below the 86.7% share of American adults. In keeping with the DOE’s findings, serious financial hardship is far more common in Owsley than it is nationwide. An estimated 37.9% of county residents live in poverty, well more than double the 15.5% national poverty rate.
A basic education better equips an individual to make healthy choices and ultimately can lead to a longer life. With such low educational attainment, life expectancy in Owsley County is about eight years shorter than the national average of 78.9 years.
17. Leflore County, Mississippi
> 5-yr. population change: -4.8%
> Nov. unemployment rate: 8.4%
> Poverty rate: 41.9%
> Life expectancy at birth: 71.9 years
Located in the Mississippi Delta region, Leflore County is one of many counties in Mississippi that have yet to recover from job loss in the 20th century, partially the result of mechanization in the agriculture and manufacturing industries. An estimated 8.4% of the county’s labor force is unemployed, far more than the 4.6% national unemployment rate. The typical household earns just $24,223 a year, less than half the income the typical American household earns. With an unhealthy job market and low wages, many Leflore County residents live in poverty. Leflore is one of just a handful of counties in which more than 40% of residents live on poverty wages, far more than the 15.5% national poverty rate.
[in-text-ad-2]

16. Madison Parish, Louisiana
> 5-yr. population change: -3.4%
> Nov. unemployment rate: 8.0%
> Poverty rate: 38.4%
> Life expectancy at birth: 72.1 years
Certain socioeconomic measures, such as income and insurance coverage, are closely tied to the overall health of a given population. Financial hardship can greatly limit an individual’s ability to make healthy choices, and in Madison Parish, 38.4% of the population lives in poverty. In addition to a high poverty rate, over a third of area residents lack health insurance, meaning they are less likely to receive regular, preventive medical care. Poor socioeconomic measures such as these are likely driving down life expectancy in the area. Life expectancy at birth in Madison Parish is only 72.1 years, well below the national 78.9 year average life expectancy.
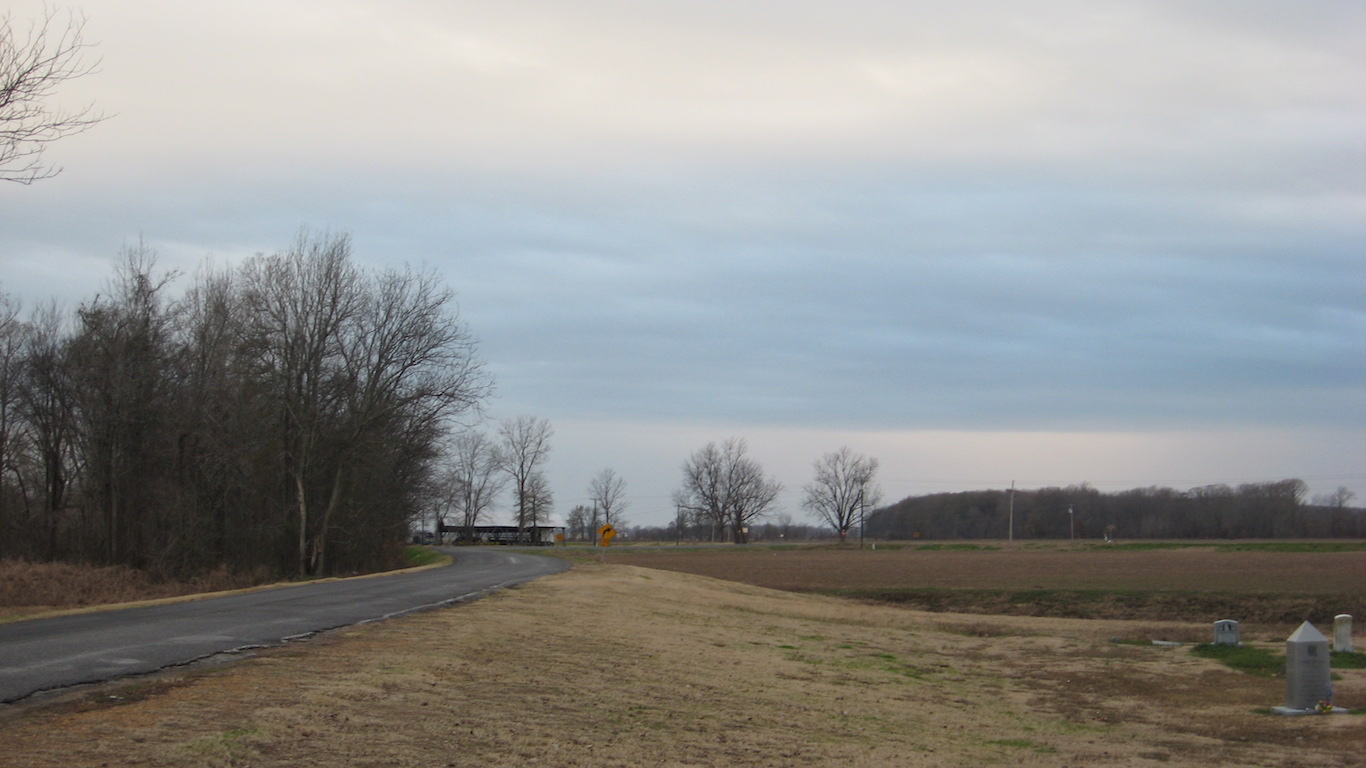
15. Phillips County, Arkansas
> 5-yr. population change: -9.0%
> Nov. unemployment rate: 5.1%
> Poverty rate: 34.1%
> Life expectancy at birth: 70.6 years
Like much of the Arkansas Delta region, the population of Phillips County today is less than half of what it was during its peak in the 1950s. The population decline, which was mostly due to decades-long job losses — the result of mechanization in the agriculture and manufacturing industries — is one reason for the poor economic conditions in Phillips County today. An estimated 34.1% of county residents live in poverty, more than twice the 15.5% national poverty rate. The average life expectancy at birth in Phillips County is just 70.6 years, more than eight years less than the average life expectancy nationwide.
[in-text-ad]
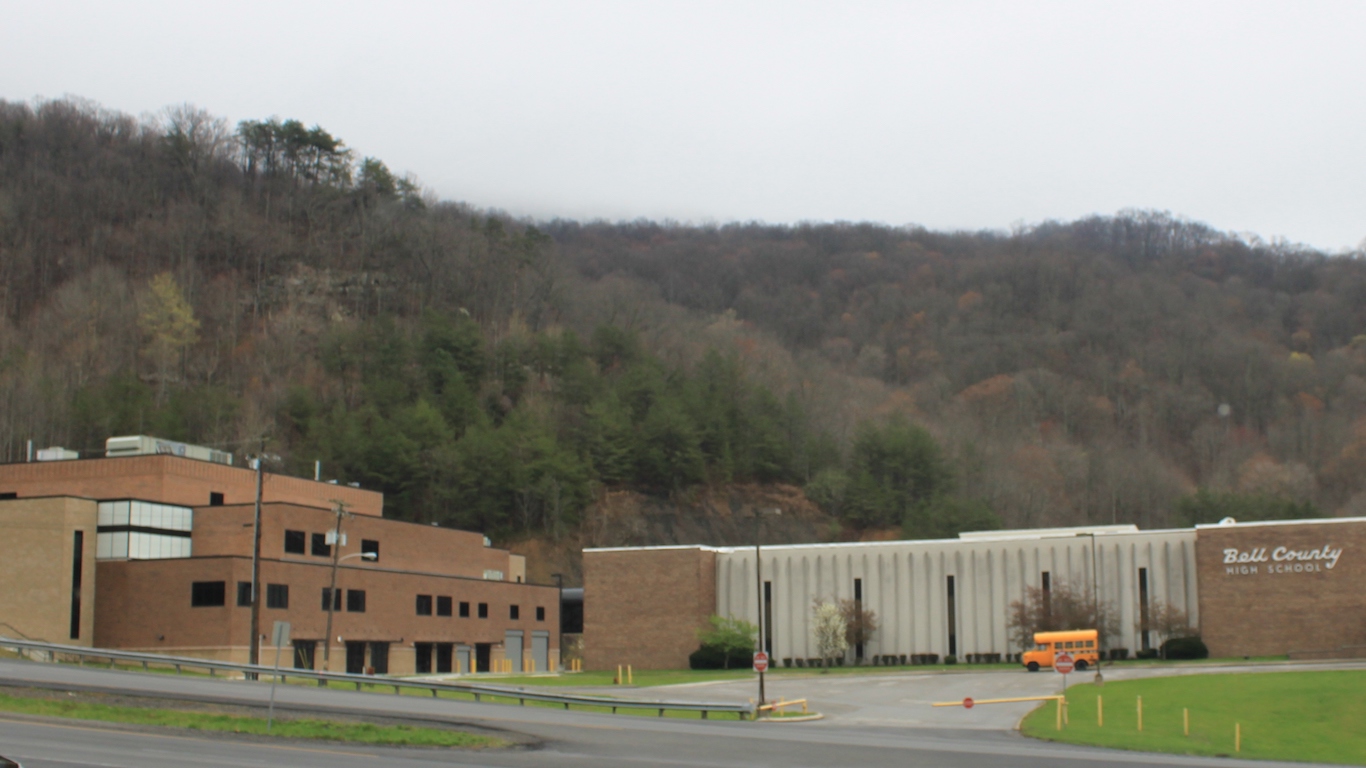
14. Bell County, Kentucky
> 5-yr. population change: -2.9%
> Nov. unemployment rate: 6.7%
> Poverty rate: 38.0%
> Life expectancy at birth: 72.1 years
Higher educational attainment often leads to a greater sense of control over one’s life, as well as to higher paying jobs and better overall health. In Bell County, Kentucky, fewer than two-thirds of all adults have completed high school, one of the smallest shares of any U.S. county. In addition, fewer than one in 10 adults in the county have earned a bachelor’s degree, well below the comparable 29.8% national share.
Substandard educational attainment may partially explain low incomes and rampant poverty in the area. The typical county household earns only $22,443 a year, less than half the income the typical American household earns. In addition, 38.0% of the county’s 27,950 residents live in poverty, a far higher share than the 15.5% of Americans.
13. Humphreys County, Mississippi
> 5-yr. population change: -6.5%
> Nov. unemployment rate: 9.4%
> Poverty rate: 39.7%
> Life expectancy at birth: 71.8 years
Humphreys County is one of many areas in the Mississippi Delta region that have suffered from decades of economic decline and job losses. The county’s population has declined substantially from its peak in the mid-20th century, falling from 26,257 in 1940 to 8,984 today. The typical household in Humphreys County makes just $23,216 annually, far less than the national median household income of $53,889 a year. Additionally, just 12.1% of Humphreys County adults have a bachelor’s degree, one of the lower college attainment rates of any U.S. county. With such a low-skilled labor force, the county is unlikely to attract much-needed business and investment. An estimated 9.4% of the Humphreys County labor force is unemployed, far more than the 4.6% national unemployment rate.
12. Martin County, Kentucky
> 5-yr. population change: -3.9%
> Nov. unemployment rate: 7.0%
> Poverty rate: 35.2%
> Life expectancy at birth: 71.5 years
Most high-paying jobs in the United States require a college education. A college education is also linked to longer lifespans. However, only 6.5% of Martin County adults have a bachelor’s degree, a smaller share than in all but half a dozen other counties nationwide.
With a near rock-bottom college attainment rate, incomes in Martin County are low. The typical area household earns only $25,795 a year, less than half the income the typical American household earns. Perhaps even more striking is the county’s life expectancy. The average life expectancy at birth in the county is only 71.5 years, well below the national 78.9 year average.
[in-text-ad-2]

11. Wolfe County, Kentucky
> 5-yr. population change: -0.7%
> Nov. unemployment rate: 7.0%
> Poverty rate: 43.0%
> Life expectancy at birth: 72.4 years
Wolfe County is one of several counties in the Eastern Kentucky Coalfield region that are among the poorest in the nation. The typical county household earns just $20,504 annually, less than in all but three other counties. An estimated 43.0% of county residents live in poverty, nearly triple the 15.5% national poverty rate.
Just 11.9% of Wolfe County adults have a bachelor’s degree, far less than the 29.8% corresponding national figure. With such low educational attainment, the county is less likely to attract new business and investment to the area. Over the past three years, only two manufacturing companies have expanded their operations in Wolfe County and none have relocated to the area. The county’s unemployment rate remains high at 7.0%, compared to the 4.6% national unemployment rate.

10. Stewart County, Georgia
> 5-yr. population change: 0.6%
> Nov. unemployment rate: 6.2%
> Poverty rate: 38.4%
> Life expectancy at birth: 71.0 years
Stewart County, Georgia is one of the least educated counties in the United States. Only 61.0% of county adults have completed high school, and 10.8% have earned a four-year college degree, far less than the corresponding 86.7% and 29.8% shares nationwide. With low educational attainment, the area’s $21,118 median annual household income is nearly the lowest of all U.S. counties, and well over a third of area residents live in poverty.
Stewart is one of very few counties on this list not reporting a population decline. In the past half decade, the county’s population has grown a little, from 5,831 people to 5,868, or 0.6%. Still, the growth was well below the national five-year population growth rate of 4.1%.
[in-text-ad]
9. Calhoun County, Georgia
> 5-yr. population change: 0.0%
> Nov. unemployment rate: 5.5%
> Poverty rate: 41.6%
> Life expectancy at birth: 72.4 years
Like many other counties on this list, employment opportunities in Calhoun County have been steadily dwindling for a long time. Between 1970 and 2000, the number of jobs in non-services related industries declined by 26%. The number of service industry jobs similarly declined by 25% over the same time period.
Today, socioeconomic conditions in Calhoun are among the worst in the country. Long-term declines in job opportunities have contributed to the county’s near nation-leading 41.6% poverty rate. Most Americans receive health insurance coverage from their employers, and in Calhoun County, 22.2% of the population lacks coverage, a far larger share than the 13.0% of uninsured Americans. Financial struggles and a high uninsured rate mean many Calhoun County residents are unable to afford healthy lifestyles, which likely contributes to the county’s relatively low 72.4 year average life expectancy.

8. Jefferson County, Mississippi
> 5-yr. population change: -4.8%
> Nov. unemployment rate: 10.9%
> Poverty rate: 48.7%
> Life expectancy at birth: 72.9 years
Of all U.S. states, Mississippi is the poorest. Statewide, the majority of households earn less than $40,000 annually. In many parts of the state, such as Jefferson County, incomes are far lower. The typical household in Jefferson earns only $20,743 a year, less than in all but half a dozen other U.S. counties.
A poor job market is a major contributing factor to the harsh economic realities many Jefferson County residents face. The county’s 10.9% unemployment rate is more than double the 4.6% national rate. With more than one in 10 workers out of a job, extreme financial hardship is relatively common in Jefferson County. The 48.7% share of county residents living below the poverty line is the second highest poverty rate of any U.S. county.

7. Quitman County, Mississippi
> 5-yr. population change: -9.2%
> Nov. unemployment rate: 8.5%
> Poverty rate: 39.5%
> Life expectancy at birth: 70.5 years
Quitman County is one of several counties in the Mississippi Delta region that have suffered from dwindling job opportunities due to the mechanization of agriculture and the decline of the U.S. manufacturing industry throughout the latter half of the 20th century. The county’s population peaked at 27,191 in 1940 and has since fallen to just 7,761 today. Quitman County’s agriculture industry is just a fraction of what it was a few decades ago, with the number of farm workers falling from 2,395 in 1970 to 443 in 2000. The lack of access to high-paying jobs may lower the financial and physical well-being of area residents. Nearly 40% of county residents live in poverty, one of the highest poverty rates nationwide. Additionally, the average life expectancy at birth in Quitman County is just 70.5 years, more than eight years shorter than the average life expectancy nationwide.
[in-text-ad-2]
6. Holmes County, Mississippi
> 5-yr. population change: -4.2%
> Nov. unemployment rate: 9.3%
> Poverty rate: 43.4%
> Life expectancy at birth: 72.0 years
Like many other counties in the Mississippi Delta region, the Holmes County economy has yet to modernize and recover from long term employment declines in its agriculture and manufacturing industries. The population peaked at 39,710 in 1940 — just as modern, highly mechanized agricultural practices were beginning to be adopted — and has since fallen to just 18,772 residents. The typical Holmes County household today earns just $20,732 annually, less than in all but five other counties. Just 12.3% of the county’s adult population has a bachelor’s degree, far less than the 29.8% national figure. With such low college attainment, Holmes County is unlikely to attract much-needed business and investment. An estimated 9.3% of the county’s labor force is unemployed, more than twice the 4.6% national unemployment rate.

5. Clay County, Kentucky
> 5-yr. population change: -4.0%
> Nov. unemployment rate: 7.8%
> Poverty rate: 39.7%
> Life expectancy at birth: 70.9 years
With a median household income of only $43,740 a year, Kentucky is one of the poorest states in the country. Clay County is one of eight Kentucky counties to rank among the worst places to live. Far poorer than the state as whole, the median household income in Clay County is only $21,549 a year. With lower incomes, many county residents are financially destitute. An estimated 39.7% of people in Clay County live in poverty, well more than double the 18.9% of Kentucky residents.
Income below a certain level can have significant unfavorable effects on an individual’s health and well-being. The Clay County life expectancy at birth is 70.9 years, more in line with life expectancy in Iraq than the United States, where the average life expectancy is 78.9 years.
[in-text-ad]
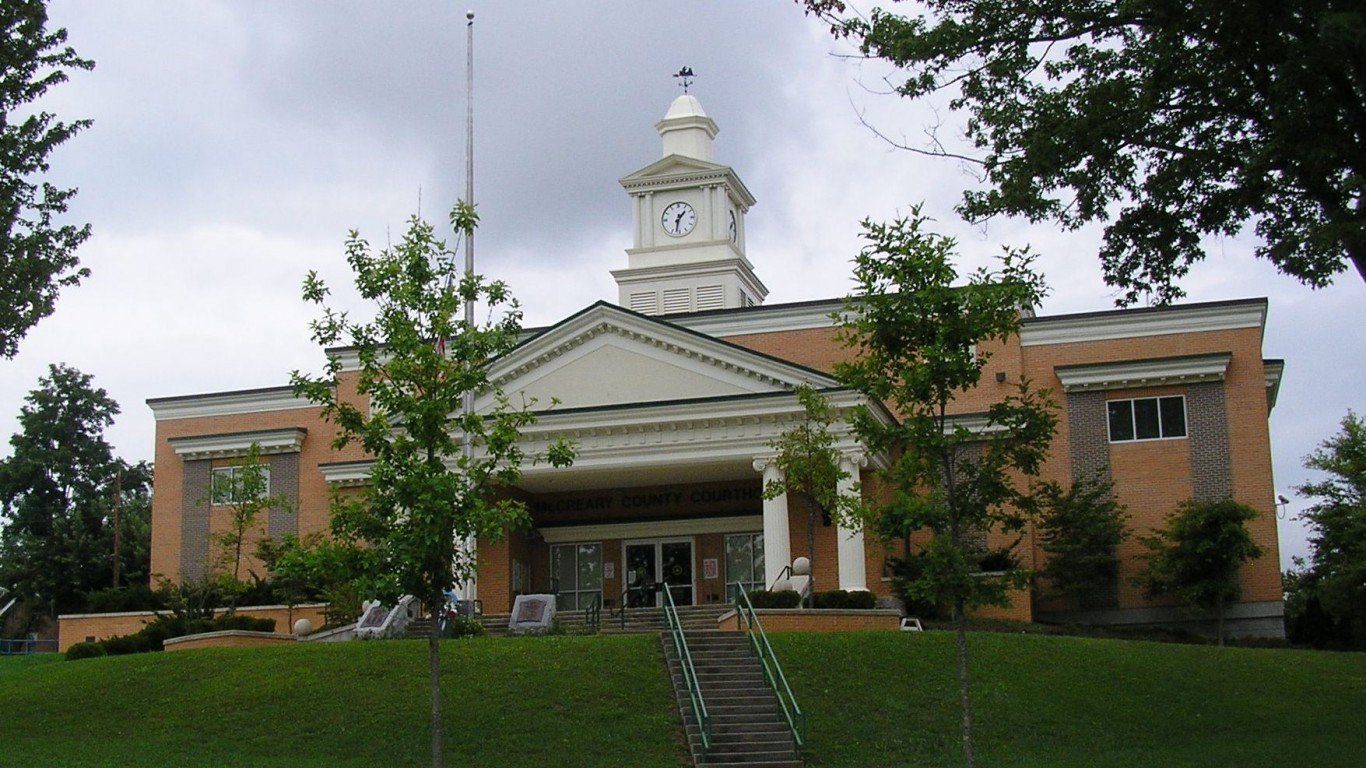
4. McCreary County, Kentucky
> 5-yr. population change: -0.7%
> Nov. unemployment rate: 5.8%
> Poverty rate: 41.0%
> Life expectancy at birth: 72.0 years
Like many of the worst counties to live in, the economy of McCreary County has yet to recover from the decline of its bygone coal mining industry. The Stearns Coal and Lumber Company built its first mine in the area in 1902, and developed the county into a mining economy throughout most of the 20th century. By the time Stearns had ceased business activity in the county and all coal production stopped in July 2014, McCreary County had become one of the poorest counties in the nation. Today, the typical county household earns just $19,328 a year, the lowest median household income of all U.S. counties. An estimated 41.0% of residents live in poverty, far more than the 15.5% national poverty rate.

3. Issaquena County, Mississippi
> 5-yr. population change: -31.8%
> Nov. unemployment rate: 11.8%
> Poverty rate: 40.3%
> Life expectancy at birth: 70.7 years
Issaquena County is one of many counties located in the Mississippi Delta region that are among the poorest, least educated, and unhealthiest in the nation. The county’s population has declined to just 1,291 residents today from a peak of roughly 12,000 in 1890. No county’s population has had a larger relative decline that of Issaquena County. The decline was largely due to the loss of manufacturing jobs, a trend that persists today. An estimated 11.8% of the county’s labor force is currently unemployed, and 40.3% of county residents live in poverty — each among the highest unemployment and poverty rates nationwide. The life expectancy at birth in Issaquena County is just 70.7 years, about eight years shorter than the average life expectancy nationwide.
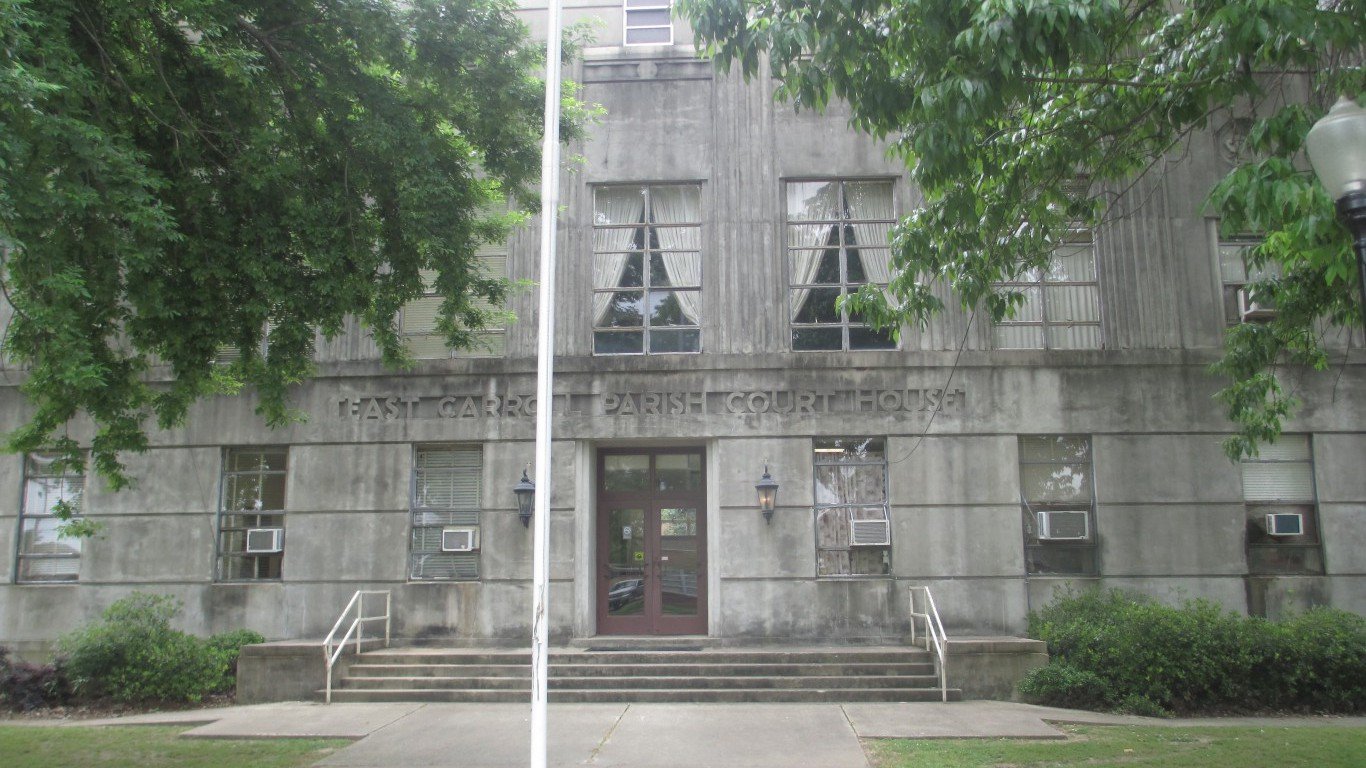
2. East Carroll Parish, Louisiana
> 5-yr. population change: -5.8%
> Nov. unemployment rate: 10.5%
> Poverty rate: 48.0%
> Life expectancy at birth: 71.9 years
East Carroll Parish, Louisiana, situated along the western bank of the Mississippi River in the northeast corner of the state, is the second worst U.S. county to live in. With 10.5% of the area’s labor force out of a job, more than double the 4.6% national jobless rate, unemployment is widespread in East Carroll Parish.
College educated adults are less likely to live in poverty and more likely to live longer, healthier lives than those without a four-year degree. In East Carroll Parish, fewer than one in every 10 adults have at least a bachelor’s degree, well below the 29.8% national college attainment rate. Likely due in part to low educational attainment, 48% of parish residents live in poverty, three times the comparable national poverty rate and the third highest of any U.S. county.
[in-text-ad-2]
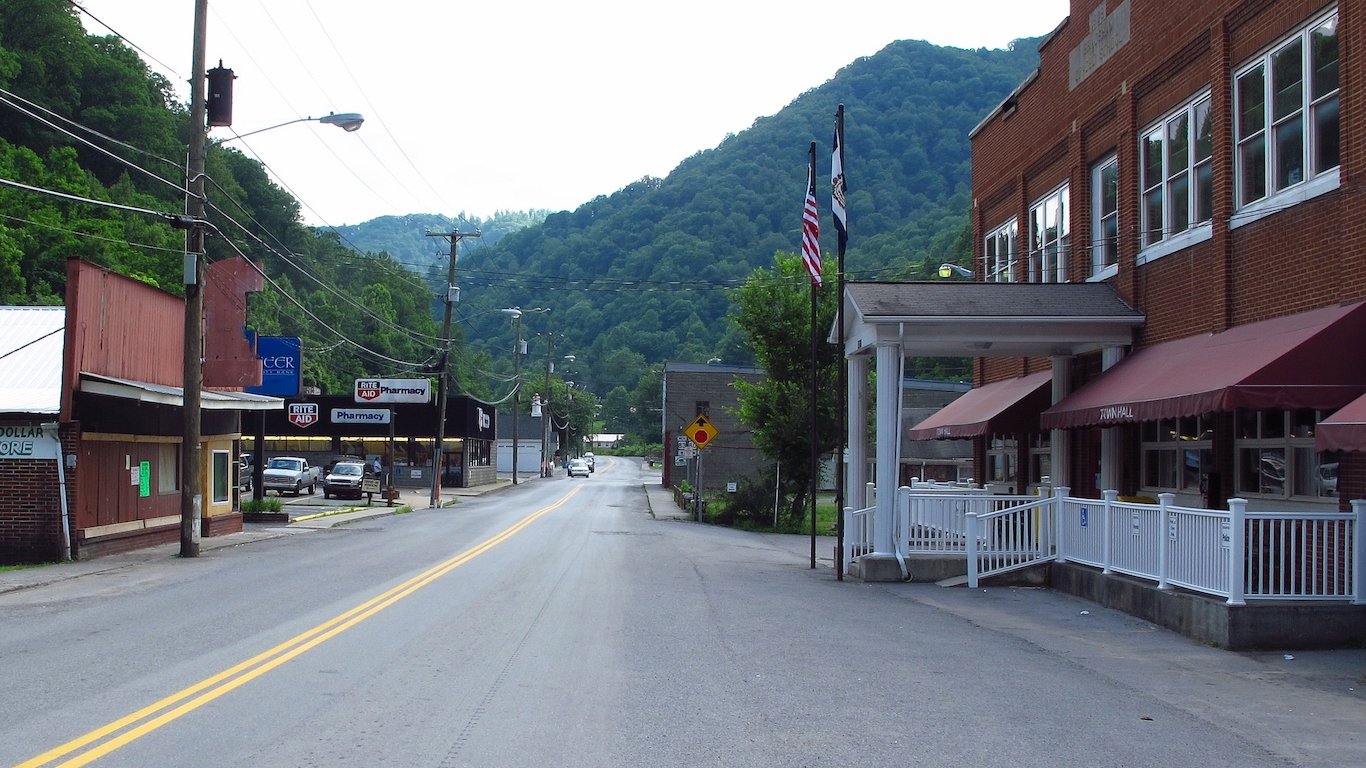
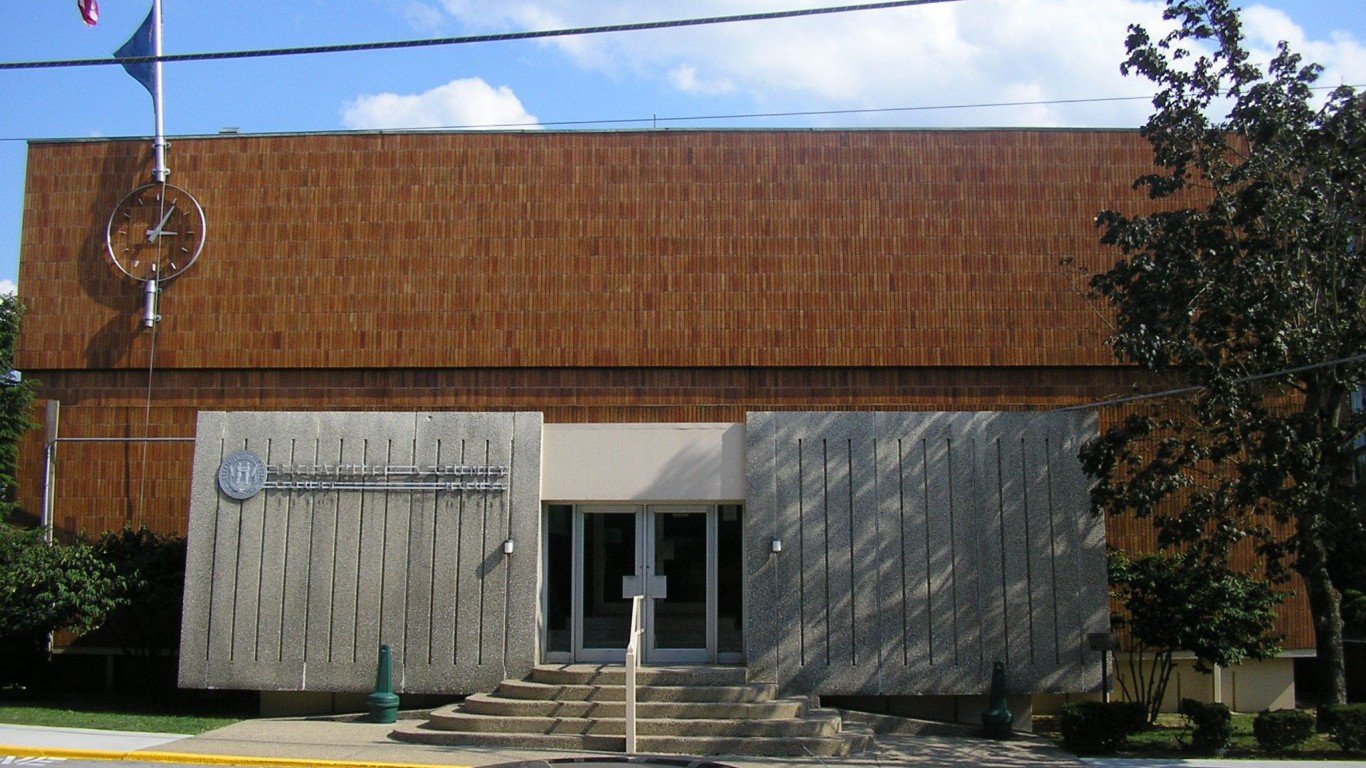
1. McDowell County, West Virginia
> 5-yr. population change: -7.8%
> Nov. unemployment rate: 10.8%
> Poverty rate: 35.5%
> Life expectancy at birth: 67.5 years
McDowell County, West Virginia ranks as the worst place to live in the United States. Several grim socioeconomic measures illustrate the hardship many McDowell County residents face. More than one in every 10 workers in the county are out of a job, well more than double the 4.6% national unemployment rate. Due in part to the lack of jobs, more than a third of county residents live in poverty, also more than double the 15.5% national poverty rate. Perhaps most telling is the county’s 67.5 year average life expectancy, which is the lowest of any U.S. county.
Poor socioeconomic conditions in McDowell are underscored, and likely worsened, by drugs. West Virginia is among the states hardest hit by the opioid addiction epidemic, and the problem is especially pronounced in McDowell. The McDowell County Commission is currently suing three drug wholesalers, blaming them for the widespread pain killer addiction in the area.
Take the quiz below to get matched with a financial advisor today.
Each advisor has been vetted by SmartAsset and is held to a fiduciary standard to act in your best interests.
Here’s how it works:
1. Answer SmartAsset advisor match quiz
2. Review your pre-screened matches at your leisure. Check out the
advisors’ profiles.
3. Speak with advisors at no cost to you. Have an introductory call on the phone or introduction in person and choose whom to work with in the future
Take the retirement quiz right here.
Thank you for reading! Have some feedback for us?
Contact the 24/7 Wall St. editorial team.


 24/7 Wall St.
 24/7 Wall St.
 24/7 Wall St.
 24/7 Wall St.