Special Report
What a Typical Home Costs in Every State
Published:
Last Updated:
Due in large part to the subprime mortgage crisis that lasted from 2007 to 2010, the U.S. housing market has undergone unprecedented change in the last 10 years. As the housing bubble burst, the national median home sale price dipped by more than 31%, from $219,000 in 2006 to $150,500 in 2011. Despite relatively rapid improvements since, housing prices across the U.S. remain slightly lower than they were a decade ago.
Every state’s housing market is unique. Differences in demand, the age and condition of available homes, and the quality of schools and other geographic and social attractions in the market can lead regional home prices to vary dramatically from one state to the next.
24/7 Wall St. reviewed 2016 median sales prices to identify the cost of a home in every state. According to data provided by ATTOM Data Solutions, a real estate data analytics company, Hawaii leads all states with a median sale price of $485,000, while West Virginia is at the bottom with a median home sale price of $122,550.
Click here to see the what a typical home costs in every state.
The recovery from the subprime mortgage crisis has not been even across the country. While home prices in some states are still much lower than their pre-recession levels, home prices in other states are well above pre-recession levels. In many of these places, the robust housing market recovery can be partially attributed to increasing demand.
Many of the states with the greatest housing price recoveries — including Colorado, North Dakota, and Texas — have also had the greatest population booms. In each of those states, the population grew at more than double the 10-year national growth rate of 7.9%, and median home sale prices have increased by more than one-third since 2006.
Housing prices in a given state are driven partly by what people can afford. Not surprisingly, incomes are relatively high in states with more expensive homes, and they are lower in less expensive real estate markets. The typical American household earns $55,775 a year. Incomes are below the national median in each of the 10 states with the lowest home sale prices, and incomes exceed the national median income in nine of the 10 states with the highest home sale prices.
While incomes tend to be higher in more expensive housing markets, the relation is not perfectly linear. While areas with higher real estate values also tend to be home to higher earners, median incomes in these areas comprise a considerably smaller share of median real estate prices. For example, though the median household income in Hawaii is the second highest of any state, it only comprises about 15% of the median home sale price. Meanwhile, though West Virginia is one of the poorest states, a typical household earns about 34% of the statewide median housing price.
Irrespective of income, home prices in a given state affect how likely residents are to buy a home. For example, in West Virginia, the state with the lowest median housing price in the country, 72.3% of homes are owner occupied — the highest homeownership rate of any state. On a broader scale, 19 of the 20 states with the lowest median home sale prices have a higher homeownership rate than is typical nationwide.
Lower real estate values not only affect homeownership rates, but also how people pay for their homes. Of the 10 states with the lowest median home sale price, only one has a higher share of homeowners with a mortgage than the comparable 63.3% national rate. Similarly, all 10 of the states with the highest home value have a larger than typical share of homeowners with a mortgage.
To determine how much it costs to buy a home in each state, 24/7 Wall St. reviewed median home sale prices from ATTOM Data Solutions, a real estate data analytics company. No data was available for South Dakota. Historic sales price data for each year since 2006 were also provided by ATTOM. We also reviewed state population and population change figures from the U.S. Census Bureau’s 2015 American Community Survey. Homeownership rates, mortgage loan rates, and incomes are also from the ACS.
This what a typical home costs in every state.
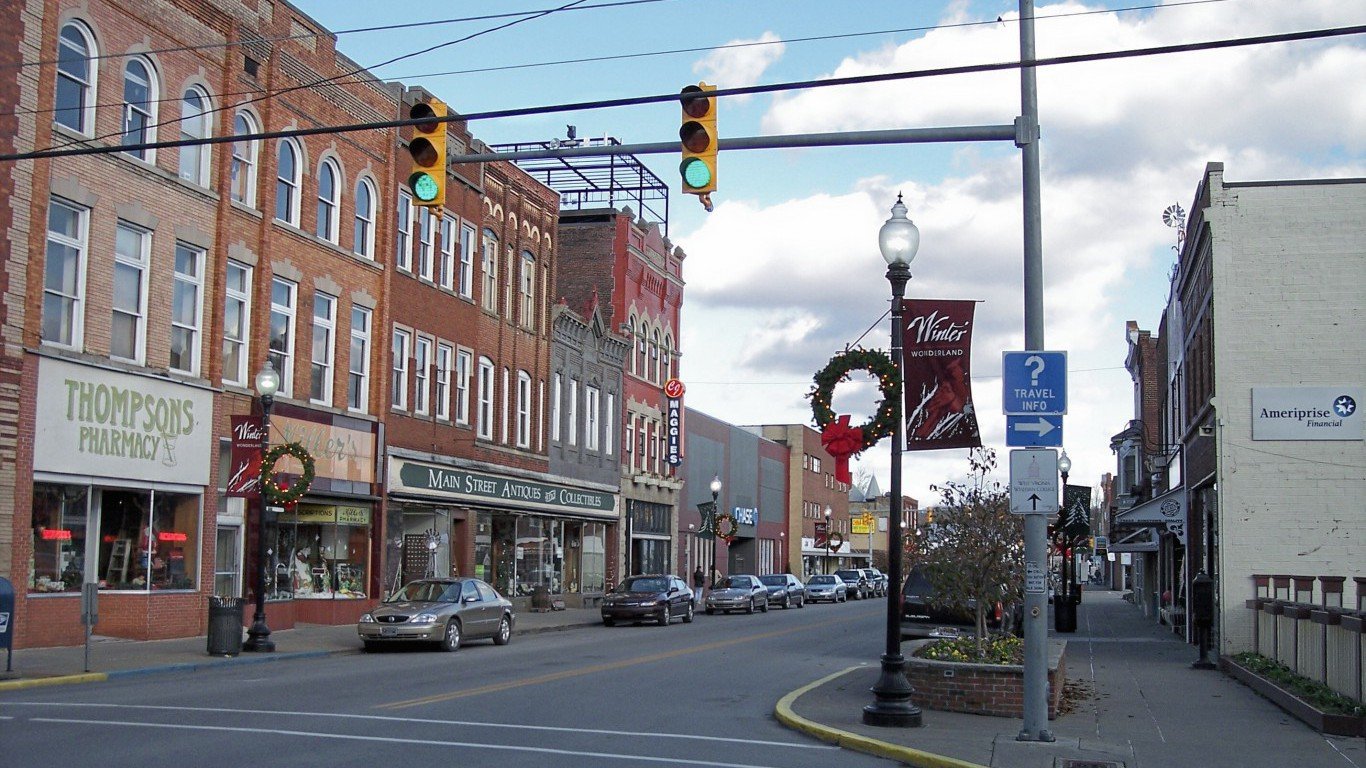
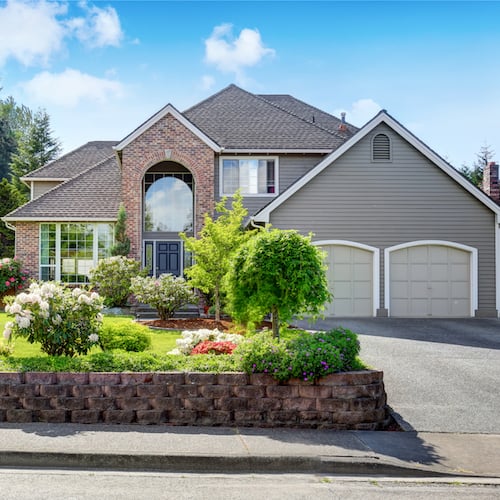
49. West Virginia
> Median list price: $122,550
> 10 yr. price change: 33.2% (6th highest)
> Homeownership rate: 72.3% (the highest)
> Median household income: $42,019 (4th lowest)
[in-text-ad]

48. Ohio
> Median list price: $130,000
> 10 yr. price change: 6.1% (22nd lowest)
> Homeownership rate: 65.4% (24th lowest)
> Median household income: $51,075 (18th lowest)

47. Oklahoma
> Median list price: $130,500
> 10 yr. price change: 31.8% (7th highest)
> Homeownership rate: 65.3% (23rd lowest)
> Median household income: $48,568 (13th lowest)

46. Michigan
> Median list price: $134,900
> 10 yr. price change: 2.6% (20th lowest)
> Homeownership rate: 70.4% (8th highest)
> Median household income: $51,084 (19th lowest)

45. Kentucky
> Median list price: $140,000
> 10 yr. price change: 19.1% (14th highest)
> Homeownership rate: 66.3% (21st highest)
> Median household income: $45,215 (6th lowest)
[in-text-ad]

44. Alabama
> Median list price: $143,500
> 10 yr. price change: 2.5% (18th lowest)
> Homeownership rate: 67.9% (15th highest)
> Median household income: $44,765 (5th lowest)

43. Iowa
> Median list price: $144,300
> 10 yr. price change: 21.3% (11th highest)
> Homeownership rate: 70.7% (7th highest)
> Median household income: $54,736 (25th highest)

42. Tennessee
> Median list price: $145,000
> 10 yr. price change: 28.9% (8th highest)
> Homeownership rate: 65.8% (25th lowest)
> Median household income: $47,275 (10th lowest)
[in-text-ad-2]

41. Arkansas
> Median list price: $145,000
> 10 yr. price change: 16.0% (19th highest)
> Homeownership rate: 65.2% (21st lowest)
> Median household income: $41,995 (3rd lowest)

40. Nebraska
> Median list price: $152,000
> 10 yr. price change: 18.8% (15th highest)
> Homeownership rate: 65.9% (25th highest)
> Median household income: $54,996 (24th highest)
[in-text-ad]

39. Kansas
> Median list price: $157,938
> 10 yr. price change: 34.9% (5th highest)
> Homeownership rate: 66.4% (20th highest)
> Median household income: $53,906 (24th lowest)

38. Missouri
> Median list price: $159,668
> 10 yr. price change: 10.1% (25th highest)
> Homeownership rate: 66.1% (23rd highest)
> Median household income: $50,238 (16th lowest)

37. Pennsylvania
> Median list price: $161,000
> 10 yr. price change: 7.3% (25th lowest)
> Homeownership rate: 68.7% (11th highest)
> Median household income: $55,702 (21st highest)
[in-text-ad-2]

36. South Carolina
> Median list price: $161,500
> 10 yr. price change: 16.2% (18th highest)
> Homeownership rate: 68.1% (13th highest)
> Median household income: $47,238 (9th lowest)

35. Louisiana
> Median list price: $162,000
> 10 yr. price change: 11.7% (23rd highest)
> Homeownership rate: 64.6% (19th lowest)
> Median household income: $45,727 (8th lowest)
[in-text-ad]

34. Indiana
> Median list price: $163,233
> 10 yr. price change: 18.1% (16th highest)
> Homeownership rate: 68.2% (12th highest)
> Median household income: $50,532 (17th lowest)

33. Georgia
> Median list price: $166,900
> 10 yr. price change: 6.8% (24th lowest)
> Homeownership rate: 61.8% (11th lowest)
> Median household income: $51,244 (20th lowest)

32. Wisconsin
> Median list price: $167,200
> 10 yr. price change: -1.4% (16th lowest)
> Homeownership rate: 66.8% (18th highest)
> Median household income: $55,638 (23rd highest)
[in-text-ad-2]
31. North Carolina
> Median list price: $177,000
> 10 yr. price change: 16.4% (17th highest)
> Homeownership rate: 63.9% (17th lowest)
> Median household income: $47,830 (11th lowest)

30. Illinois
> Median list price: $185,000
> 10 yr. price change: -13.1% (10th lowest)
> Homeownership rate: 65.3% (22nd lowest)
> Median household income: $59,588 (18th highest)
[in-text-ad]

29. Florida
> Median list price: $185,000
> 10 yr. price change: -19.0% (4th lowest)
> Homeownership rate: 63.8% (16th lowest)
> Median household income: $49,426 (14th lowest)

28. North Dakota
> Median list price: $190,000
> 10 yr. price change: 44.0% (2nd highest)
> Homeownership rate: 61.7% (9th lowest)
> Median household income: $60,557 (16th highest)

27. Vermont
> Median list price: $195,000
> 10 yr. price change: 5.4% (21st lowest)
> Homeownership rate: 70.7% (6th highest)
> Median household income: $56,990 (20th highest)
[in-text-ad-2]

26. New Mexico
> Median list price: $196,330
> 10 yr. price change: -1.5% (15th lowest)
> Homeownership rate: 67.5% (16th highest)
> Median household income: $45,382 (7th lowest)

25. Mississippi
> Median list price: $207,783
> 10 yr. price change: 90.6% (the highest)
> Homeownership rate: 67.4% (17th highest)
> Median household income: $40,593 (2nd lowest)
[in-text-ad]
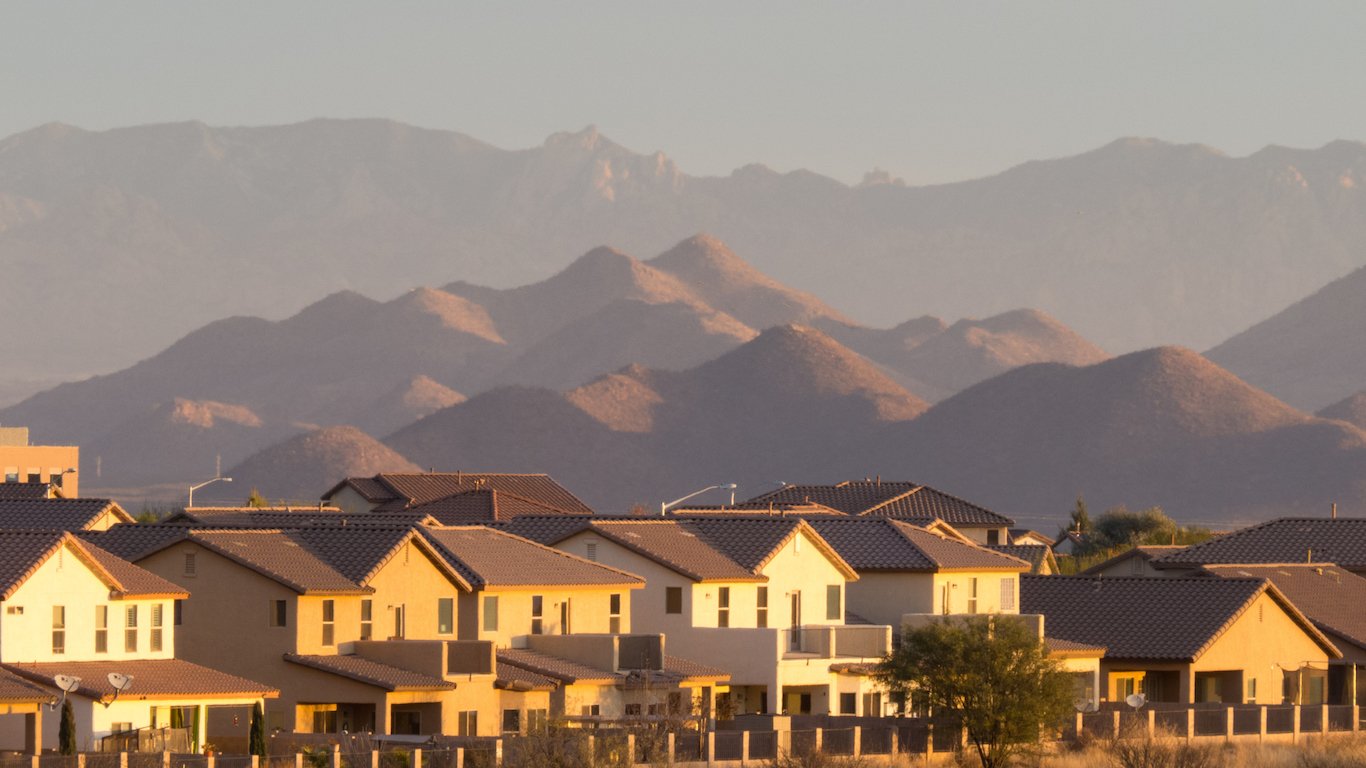
24. Arizona
> Median list price: $209,000
> 10 yr. price change: -15.9% (6th lowest)
> Homeownership rate: 61.9% (12th lowest)
> Median household income: $51,492 (21st lowest)

23. Idaho
> Median list price: $210,489
> 10 yr. price change: 2.6% (19th lowest)
> Homeownership rate: 69.0% (9th highest)
> Median household income: $48,275 (12th lowest)

22. Delaware
> Median list price: $212,000
> 10 yr. price change: -2.3% (14th lowest)
> Homeownership rate: 70.8% (5th highest)
> Median household income: $61,255 (14th highest)
[in-text-ad-2]

21. Texas
> Median list price: $214,783
> 10 yr. price change: 36.6% (4th highest)
> Homeownership rate: 61.1% (7th lowest)
> Median household income: $55,653 (22nd highest)

20. Nevada
> Median list price: $216,000
> 10 yr. price change: -24.8% (3rd lowest)
> Homeownership rate: 54.0% (4th lowest)
> Median household income: $52,431 (23rd lowest)
[in-text-ad]
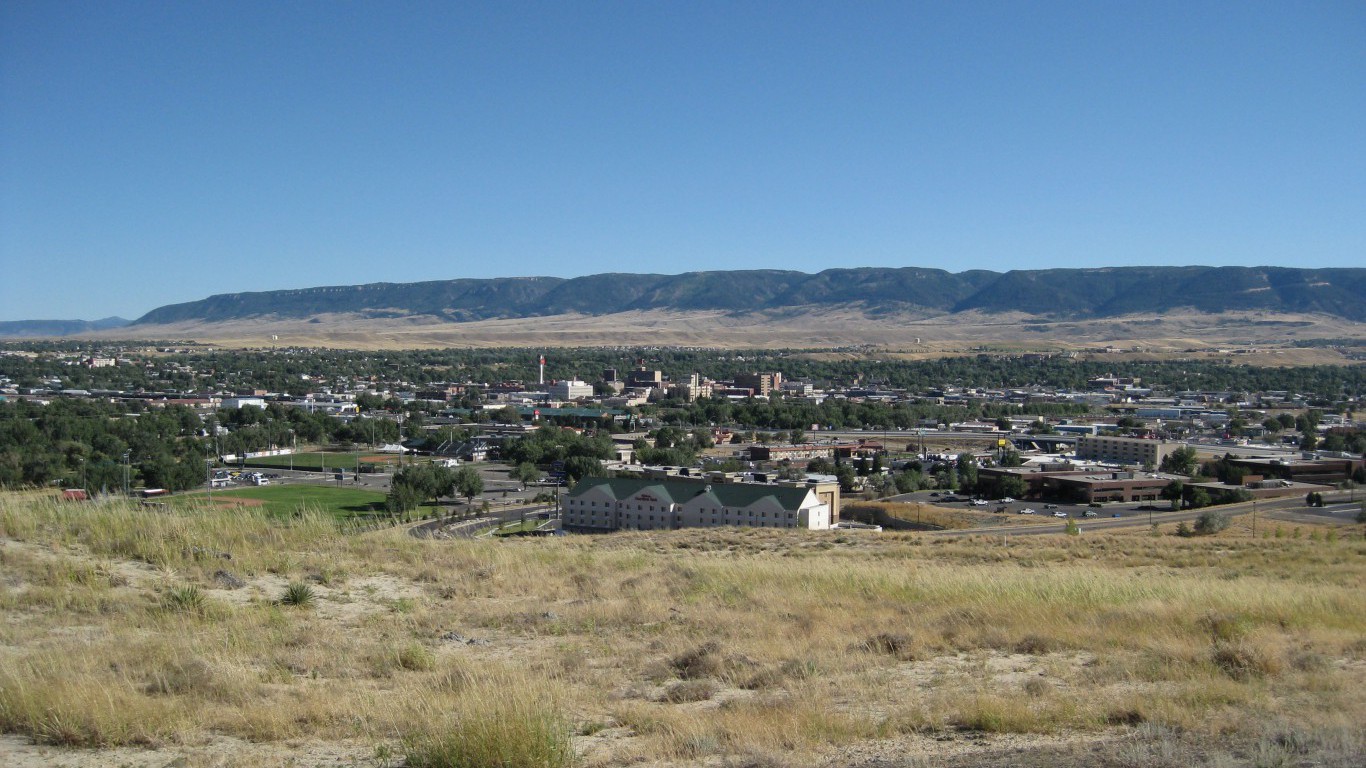
19. Wyoming
> Median list price: $219,450
> 10 yr. price change: 20.2% (12th highest)
> Homeownership rate: 68.0% (14th highest)
> Median household income: $60,214 (17th highest)

18. Minnesota
> Median list price: $219,900
> 10 yr. price change: 0.6% (17th lowest)
> Homeownership rate: 70.9% (3rd highest)
> Median household income: $63,488 (12th highest)

17. Connecticut
> Median list price: $227,500
> 10 yr. price change: -13.3% (7th lowest)
> Homeownership rate: 66.2% (22nd highest)
> Median household income: $71,346 (5th highest)
[in-text-ad-2]

16. Rhode Island
> Median list price: $230,000
> 10 yr. price change: -13.2% (9th lowest)
> Homeownership rate: 59.0% (6th lowest)
> Median household income: $58,073 (19th highest)

15. Montana
> Median list price: $230,608
> 10 yr. price change: 28.8% (9th highest)
> Homeownership rate: 66.7% (19th highest)
> Median household income: $49,509 (15th lowest)
[in-text-ad]

14. New Hampshire
> Median list price: $232,000
> 10 yr. price change: -3.3% (13th lowest)
> Homeownership rate: 70.9% (4th highest)
> Median household income: $70,303 (7th highest)

13. Maine
> Median list price: $235,220
> 10 yr. price change: 19.5% (13th highest)
> Homeownership rate: 71.0% (2nd highest)
> Median household income: $51,494 (22nd lowest)

12. Maryland
> Median list price: $242,000
> 10 yr. price change: -13.3% (8th lowest)
> Homeownership rate: 65.9% (24th highest)
> Median household income: $75,847 (the highest)
[in-text-ad-2]

11. New York
> Median list price: $247,000
> 10 yr. price change: -30.3% (2nd lowest)
> Homeownership rate: 53.1% (2nd lowest)
> Median household income: $60,850 (15th highest)

10. Utah
> Median list price: $258,665
> 10 yr. price change: 15.8% (20th highest)
> Homeownership rate: 68.9% (10th highest)
> Median household income: $62,912 (13th highest)
[in-text-ad]

9. New Jersey
> Median list price: $265,000
> 10 yr. price change: -17.2% (5th lowest)
> Homeownership rate: 63.0% (14th lowest)
> Median household income: $72,222 (4th highest)

8. Oregon
> Median list price: $275,000
> 10 yr. price change: 15.4% (21st highest)
> Homeownership rate: 61.1% (8th lowest)
> Median household income: $54,148 (25th lowest)

7. Alaska
> Median list price: $291,536
> 10 yr. price change: 14.8% (22nd highest)
> Homeownership rate: 63.9% (18th lowest)
> Median household income: $73,355 (3rd highest)
[in-text-ad-2]

6. Virginia
> Median list price: $297,000
> 10 yr. price change: -7.2% (12th lowest)
> Homeownership rate: 65.0% (20th lowest)
> Median household income: $66,262 (8th highest)

5. Washington
> Median list price: $299,000
> 10 yr. price change: 10.7% (24th highest)
> Homeownership rate: 62.4% (13th lowest)
> Median household income: $64,129 (10th highest)
[in-text-ad]

4. Colorado
> Median list price: $300,000
> 10 yr. price change: 40.8% (3rd highest)
> Homeownership rate: 63.7% (15th lowest)
> Median household income: $63,909 (11th highest)

3. Massachusetts
> Median list price: $339,900
> 10 yr. price change: 6.3% (23rd lowest)
> Homeownership rate: 61.7% (10th lowest)
> Median household income: $70,628 (6th highest)

2. California
> Median list price: $422,500
> 10 yr. price change: -11.1% (11th lowest)
> Homeownership rate: 53.6% (3rd lowest)
> Median household income: $64,500 (9th highest)
[in-text-ad-2]

1. Hawaii
> Median list price: $485,000
> 10 yr. price change: 28.6% (10th highest)
> Homeownership rate: 56.6% (5th lowest)
> Median household income: $73,486 (2nd highest)
Finding a qualified financial advisor doesn’t have to be hard. SmartAsset’s free tool matches you with up to 3 fiduciary financial advisors in your area in 5 minutes. Each advisor has been vetted by SmartAsset and is held to a fiduciary standard to act in your best interests. If you’re ready to be matched with local advisors that can help you achieve your financial goals, get started now.
Thank you for reading! Have some feedback for us?
Contact the 24/7 Wall St. editorial team.


 24/7 Wall St.