Special Report
States With the Most UFO Sightings

Published:
Last Updated:
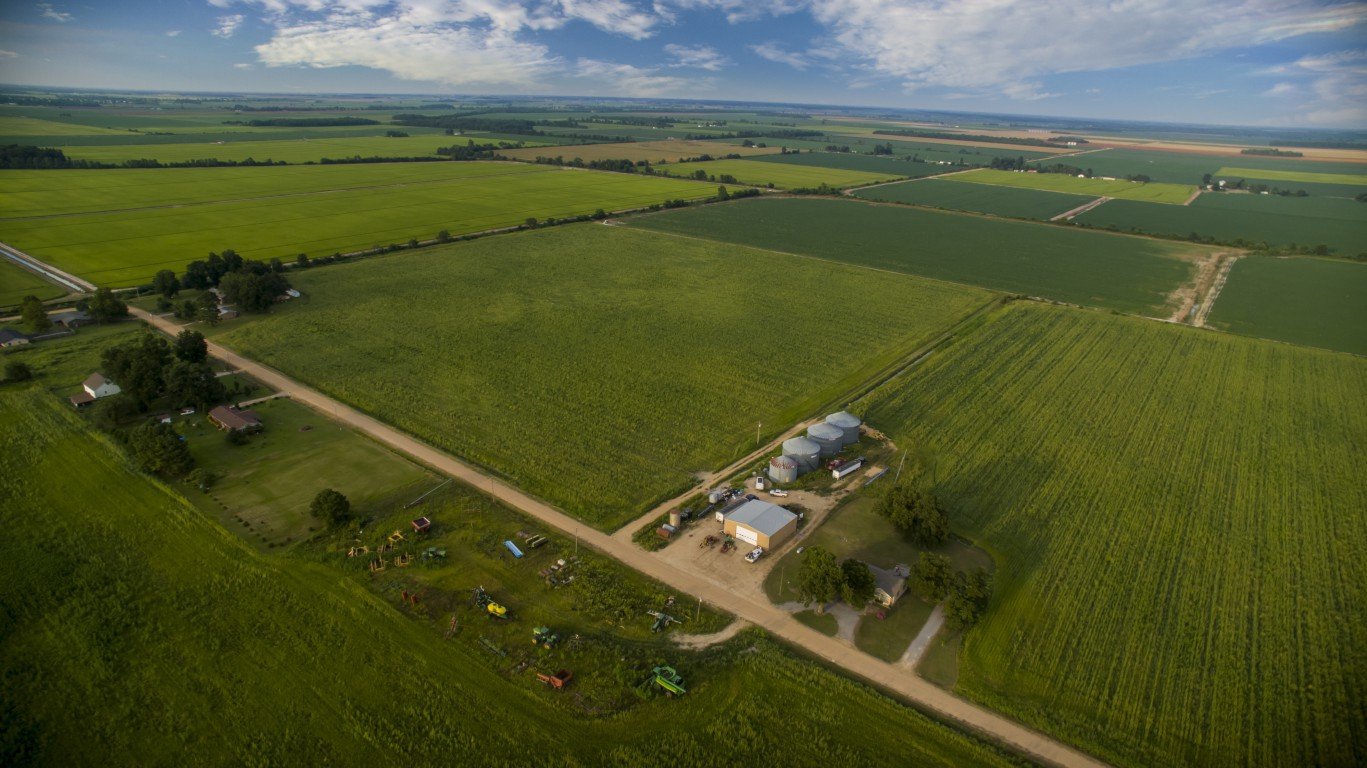
Humans have always observed their environment — from their immediate surroundings to the skies and beyond. While technological advancements have increased our powers of perception, the naked senses remain extremely limited. Commonplace observations by the unaided senses, notably UFO sightings, can be very difficult to explain. Our understanding of these phenomena is limited to speculation, anecdote, and the imperfect powers of human perception and recollection.
There have been documented UFO sightings in the United States since the late 19th century, before manned flight. Today, tens of thousands of UFO sightings are reported nationwide every year. Depending on weather conditions and the possibility of spending leisure time outdoors, UFO sighting levels vary by state.
In a self-published book, “UFO Sightings Desk Reference,” authors Cheryl Costa and Linda Miller Costa aggregate reports from two databases to highlight how sightings vary over time and between states. 24/7 Wall St. reviewed the number of UFO sightings between 2001 and 2015 in each state.
Click here to see the states with the highest (population adjusted) UFO sightings.
Click here to see the detailed findings.
Click here to see the methodology.
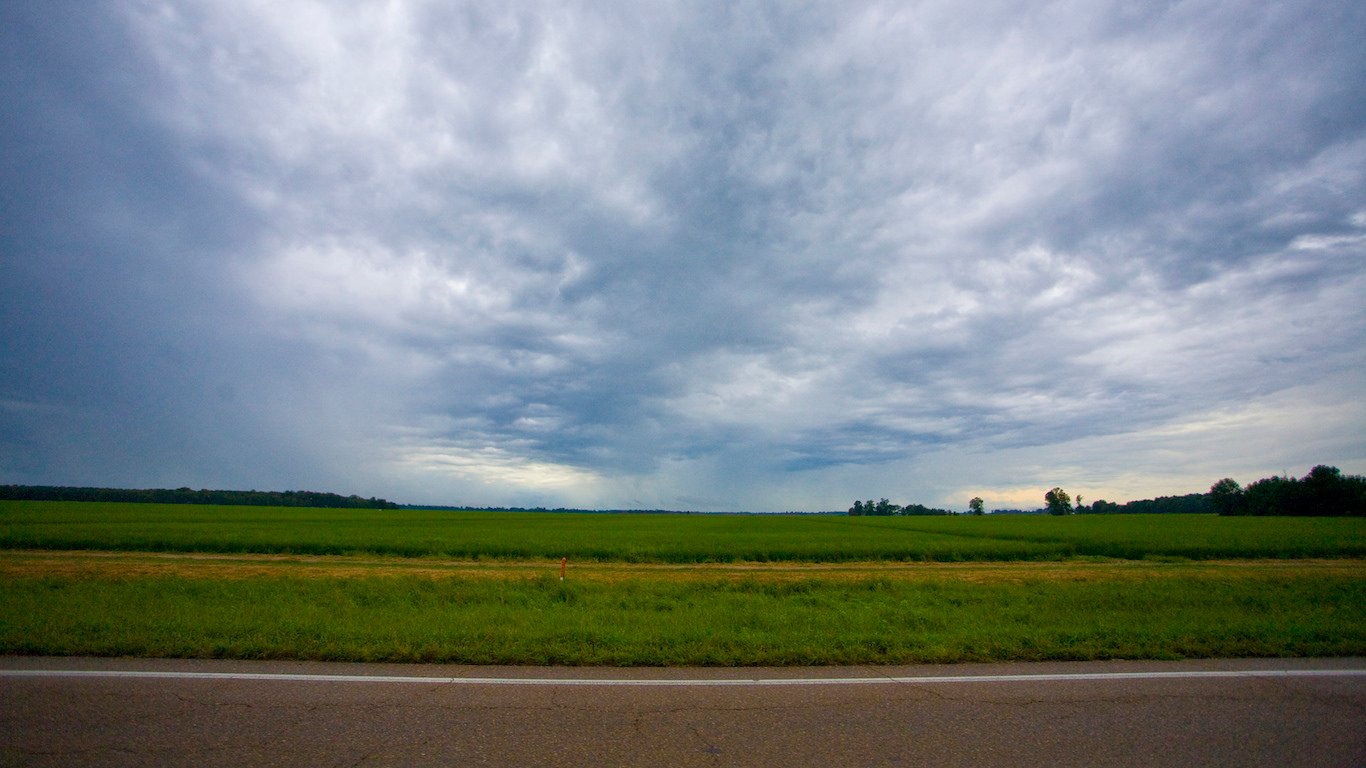
50. Mississippi
> 2001-2015 sightings per 100K: 21.3
> Total sightings: 636 (10th lowest)
> Population per sq. mile: 64 (19th lowest)
> Households without internet: 38.5% (the highest)
[in-text-ad]
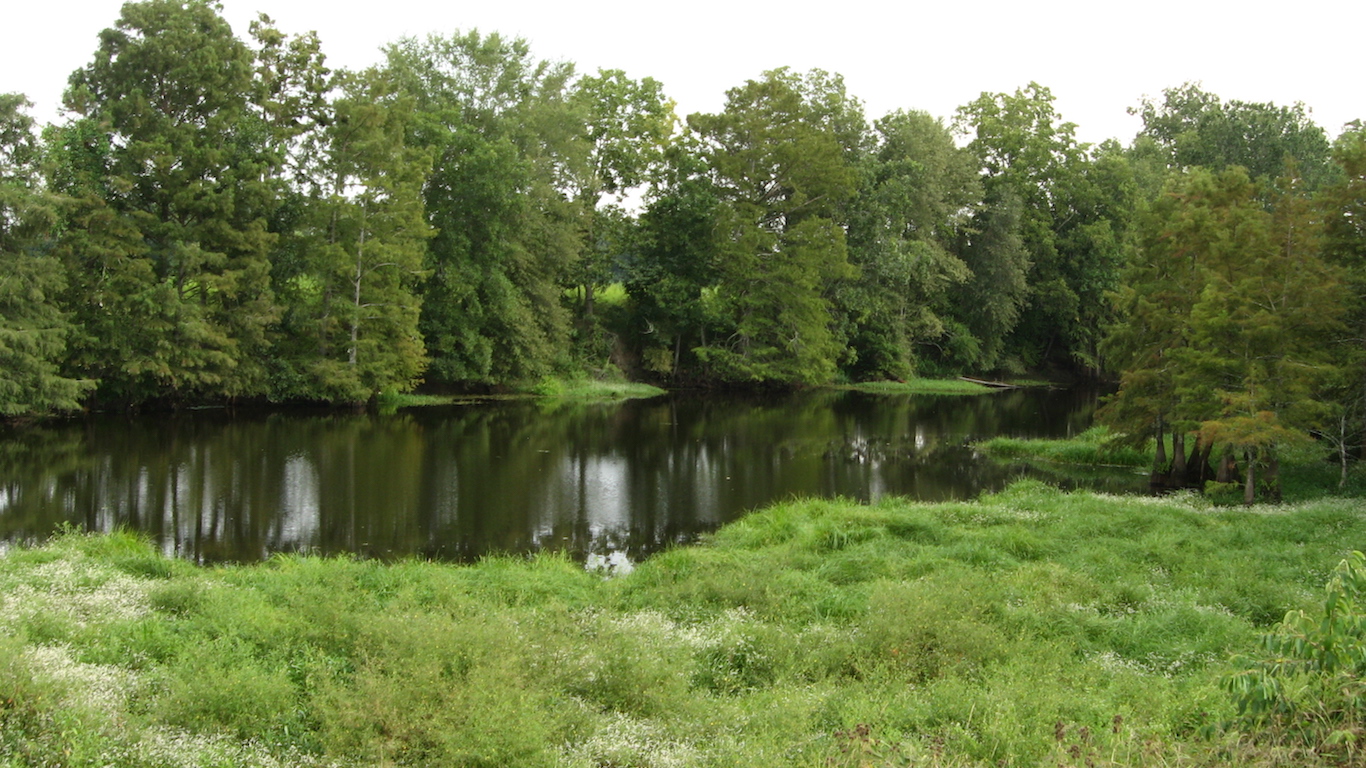
49. Louisiana
> 2001-2015 sightings per 100K: 23.3
> Total sightings: 1,090 (18th lowest)
> Population per sq. mile: 106 (25th highest)
> Households without internet: 30.7% (5th highest)

48. Georgia
> 2001-2015 sightings per 100K: 24.7
> Total sightings: 2,550 (17th highest)
> Population per sq. mile: 179 (17th highest)
> Households without internet: 24.8% (16th highest)

47. Alabama
> 2001-2015 sightings per 100K: 25.2
> Total sightings: 1,224 (21st lowest)
> Population per sq. mile: 97 (24th lowest)
> Households without internet: 31.1% (4th highest)
[in-text-ad-2]

46. Texas
> 2001-2015 sightings per 100K: 25.3
> Total sightings: 7,058 (3rd highest)
> Population per sq. mile: 103 (25th lowest)
> Households without internet: 25.3% (14th highest)
45. New York
> 2001-2015 sightings per 100K: 26.0
> Total sightings: 5,141 (6th highest)
> Population per sq. mile: 415 (7th highest)
> Households without internet: 21.8% (21st lowest)
[in-text-ad]
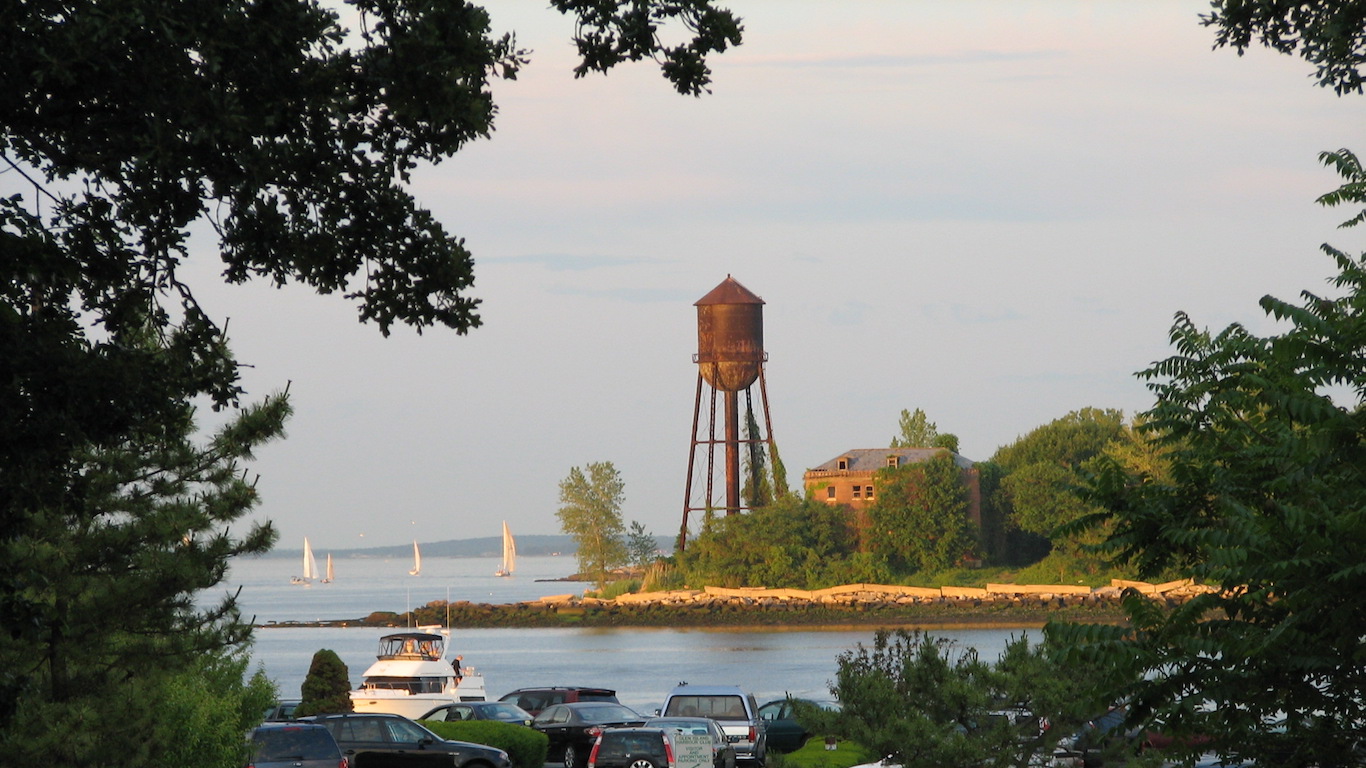
44. Maryland
> 2001-2015 sightings per 100K: 27.4
> Total sightings: 1,646 (24th highest)
> Population per sq. mile: 615 (5th highest)
> Households without internet: 18.1% (10th lowest)

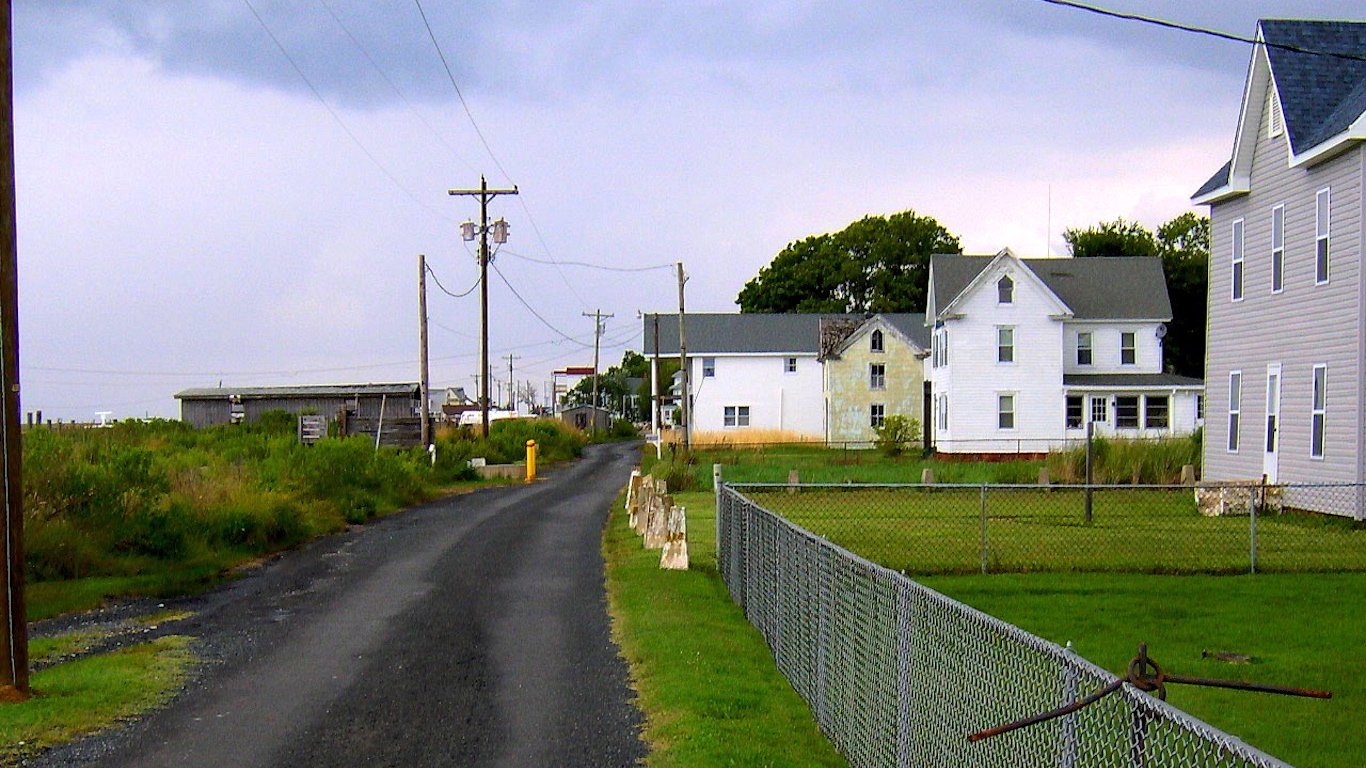
43. Virginia
> 2001-2015 sightings per 100K: 27.9
> Total sightings: 2,348 (18th highest)
> Population per sq. mile: 212 (14th highest)
> Households without internet: 20.8% (16th lowest)
42. North Dakota
> 2001-2015 sightings per 100K: 28.1
> Total sightings: 213 (the lowest)
> Population per sq. mile: 10 (4th lowest)
> Households without internet: 23.1% (23rd highest)
[in-text-ad-2]

41. New Jersey
> 2001-2015 sightings per 100K: 28.7
> Total sightings: 2,567 (16th highest)
> Population per sq. mile: 1,215 (the highest)
> Households without internet: 18.0% (9th lowest)

40. Tennessee
> 2001-2015 sightings per 100K: 31.9
> Total sightings: 2,125 (20th highest)
> Population per sq. mile: 160 (20th highest)
> Households without internet: 29.3% (8th highest)
[in-text-ad]
39. Massachusetts
> 2001-2015 sightings per 100K: 32.4
> Total sightings: 2,208 (19th highest)
> Population per sq. mile: 851 (3rd highest)
> Households without internet: 16.9% (5th lowest)
38. Illinois
> 2001-2015 sightings per 100K: 32.7
> Total sightings: 4,191 (8th highest)
> Population per sq. mile: 234 (12th highest)
> Households without internet: 22.5% (24th highest)

37. Minnesota
> 2001-2015 sightings per 100K: 33.1
> Total sightings: 1,825 (23rd highest)
> Population per sq. mile: 69 (21st lowest)
> Households without internet: 19.6% (13th lowest)
[in-text-ad-2]
36. North Carolina
> 2001-2015 sightings per 100K: 33.1
> Total sightings: 3,359 (11th highest)
> Population per sq. mile: 208 (15th highest)
> Households without internet: 25.4% (13th highest)
35. Arkansas
> 2001-2015 sightings per 100K: 33.3
> Total sightings: 995 (16th lowest)
> Population per sq. mile: 58 (17th lowest)
> Households without internet: 35.0% (2nd highest)
[in-text-ad]
34. South Dakota
> 2001-2015 sightings per 100K: 33.4
> Total sightings: 289 (2nd lowest)
> Population per sq. mile: 11 (5th lowest)
> Households without internet: 24.1% (17th highest)

33. Wisconsin
> 2001-2015 sightings per 100K: 34.6
> Total sightings: 1,998 (21st highest)
> Population per sq. mile: 107 (23rd highest)
> Households without internet: 22.4% (tied-25th highest)
32. Nebraska
> 2001-2015 sightings per 100K: 34.6
> Total sightings: 660 (11th lowest)
> Population per sq. mile: 24 (8th lowest)
> Households without internet: 21.3% (tied-18th lowest)
[in-text-ad-2]

31. Delaware
> 2001-2015 sightings per 100K: 34.7
> Total sightings: 330 (3rd lowest)
> Population per sq. mile: 483 (6th highest)
> Households without internet: 22.0% (tied-23rd lowest)
30. Ohio
> 2001-2015 sightings per 100K: 35.4
> Total sightings: 4,115 (10th highest)
> Population per sq. mile: 284 (10th highest)
> Households without internet: 23.4% (21st highest)
[in-text-ad]
29. Kentucky
> 2001-2015 sightings per 100K: 35.8
> Total sightings: 1,587 (25th highest)
> Population per sq. mile: 113 (22nd highest)
> Households without internet: 28.4% (10th highest)
28. Oklahoma
> 2001-2015 sightings per 100K: 35.9
> Total sightings: 1,408 (23rd lowest)
> Population per sq. mile: 57 (16th lowest)
> Households without internet: 28.8% (9th highest)

27. Iowa
> 2001-2015 sightings per 100K: 36.9
> Total sightings: 1,158 (tied-19th lowest)
> Population per sq. mile: 55 (15th lowest)
> Households without internet: 24.0% (tied-18th highest)
[in-text-ad-2]

26. Kansas
> 2001-2015 sightings per 100K: 37.4
> Total sightings: 1,088 (17th lowest)
> Population per sq. mile: 36 (10th lowest)
> Households without internet: 23.2% (22nd highest)

25. South Carolina
> 2001-2015 sightings per 100K: 37.5
> Total sightings: 1,859 (22nd highest)
> Population per sq. mile: 162 (19th highest)
> Households without internet: 29.6% (7th highest)
[in-text-ad]
24. Hawaii
> 2001-2015 sightings per 100K: 37.7
> Total sightings: 538 (8th lowest)
> Population per sq. mile: 221 (13th highest)
> Households without internet: 17.3% (6th lowest)
23. Florida
> 2001-2015 sightings per 100K: 37.8
> Total sightings: 7,787 (2nd highest)
> Population per sq. mile: 371 (8th highest)
> Households without internet: 22.0% (tied-23rd lowest)
22. Utah
> 2001-2015 sightings per 100K: 38.0
> Total sightings: 1,158 (tied-19th lowest)
> Population per sq. mile: 36 (11th lowest)
> Households without internet: 16.2% (3rd lowest)
[in-text-ad-2]
21. California
> 2001-2015 sightings per 100K: 40.3
> Total sightings: 15,836 (the highest)
> Population per sq. mile: 248 (11th highest)
> Households without internet: 18.2% (11th lowest)

20. Pennsylvania
> 2001-2015 sightings per 100K: 40.5
> Total sightings: 5,176 (5th highest)
> Population per sq. mile: 288 (9th highest)
> Households without internet: 23.5% (20th highest)
[in-text-ad]

19. Connecticut
> 2001-2015 sightings per 100K: 41.3
> Total sightings: 1,478 (24th lowest)
> Population per sq. mile: 750 (4th highest)
> Households without internet: 17.5% (7th lowest)

18. Michigan
> 2001-2015 sightings per 100K: 41.9
> Total sightings: 4,160 (9th highest)
> Population per sq. mile: 174 (18th highest)
> Households without internet: 25.0% (15th highest)
17. Indiana
> 2001-2015 sightings per 100K: 43.7
> Total sightings: 2,897 (15th highest)
> Population per sq. mile: 185 (16th highest)
> Households without internet: 26.0% (tied-11th highest)
[in-text-ad-2]

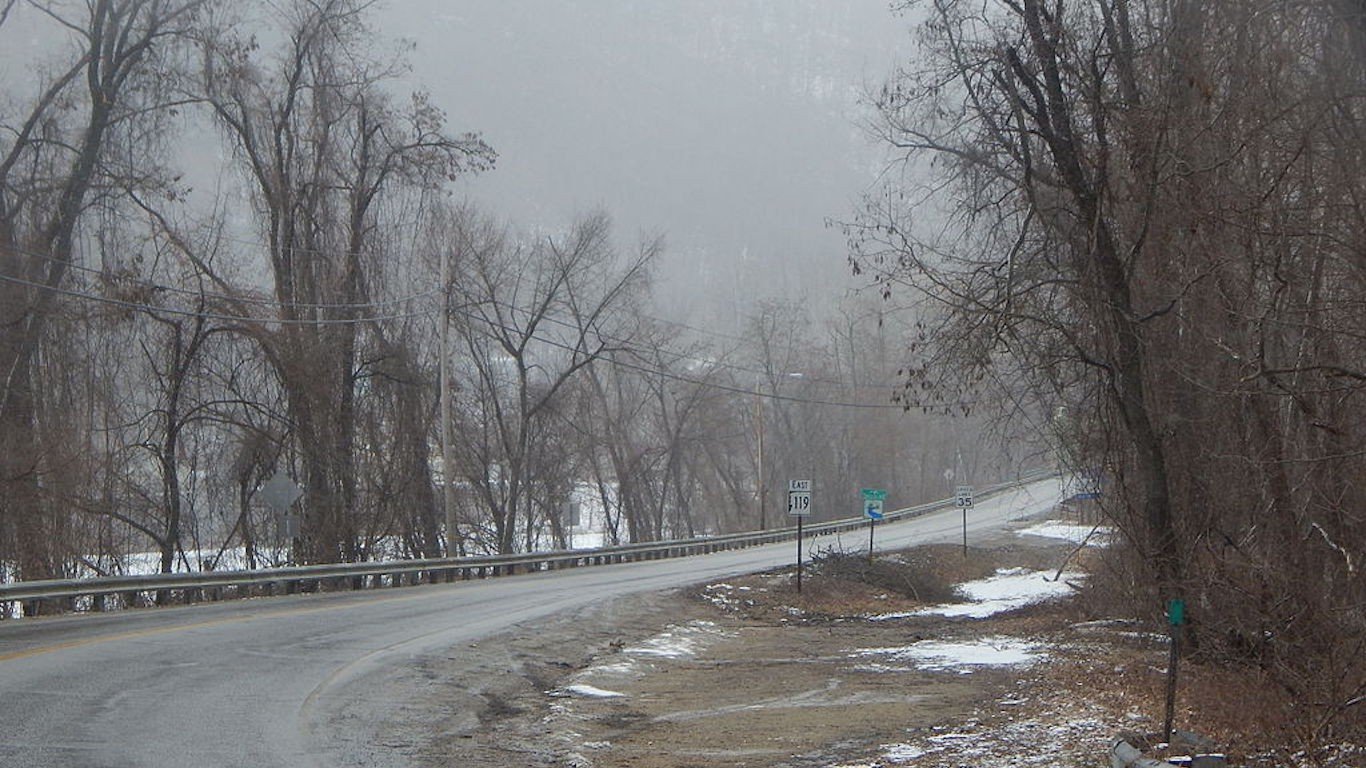
16. West Virginia
> 2001-2015 sightings per 100K: 44.8
> Total sightings: 821 (12th lowest)
> Population per sq. mile: 78 (22nd lowest)
> Households without internet: 29.7% (6th highest)
15. Missouri
> 2001-2015 sightings per 100K: 47.6
> Total sightings: 2,902 (14th highest)
> Population per sq. mile: 89 (23rd lowest)
> Households without internet: 26.0% (tied-11th highest)
[in-text-ad]

14. Rhode Island
> 2001-2015 sightings per 100K: 49.4
> Total sightings: 522 (7th lowest)
> Population per sq. mile: 1,016 (2nd highest)
> Households without internet: 21.2% (17th lowest)

13. Nevada
> 2001-2015 sightings per 100K: 53.8
> Total sightings: 1,583 (25th lowest)
> Population per sq. mile: 27 (9th lowest)
> Households without internet: 20.5% (15th lowest)
12. Wyoming
> 2001-2015 sightings per 100K: 57.6
> Total sightings: 337 (4th lowest)
> Population per sq. mile: 6 (2nd lowest)
> Households without internet: 21.3% (tied-18th lowest)
[in-text-ad-2]

11. Colorado
> 2001-2015 sightings per 100K: 57.7
> Total sightings: 3,197 (12th highest)
> Population per sq. mile: 51 (14th lowest)
> Households without internet: 16.4% (4th lowest)
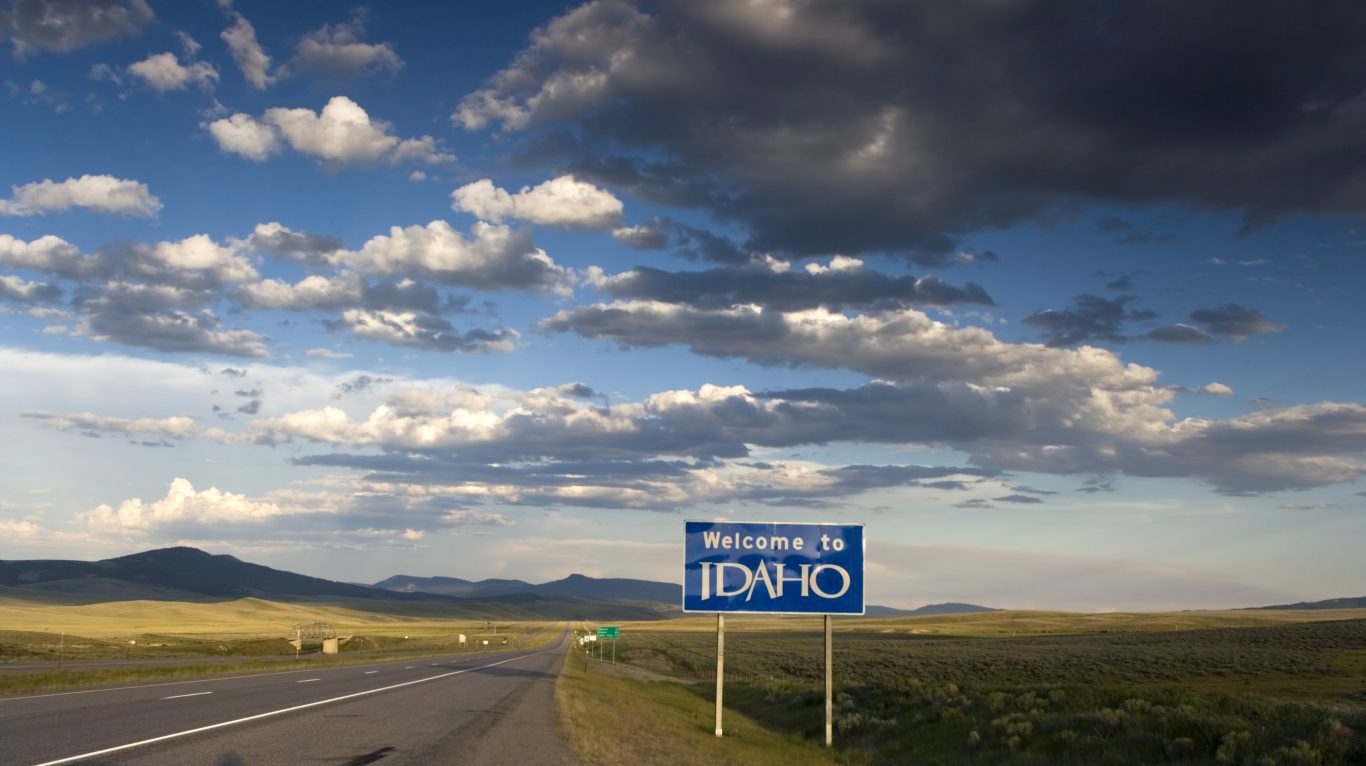
10. Idaho
> 2001-2015 sightings per 100K: 58.2
> Total sightings: 979 (15th lowest)
> Population per sq. mile: 20 (7th lowest)
> Households without internet: 22.4% (tied-25th highest)
[in-text-ad]
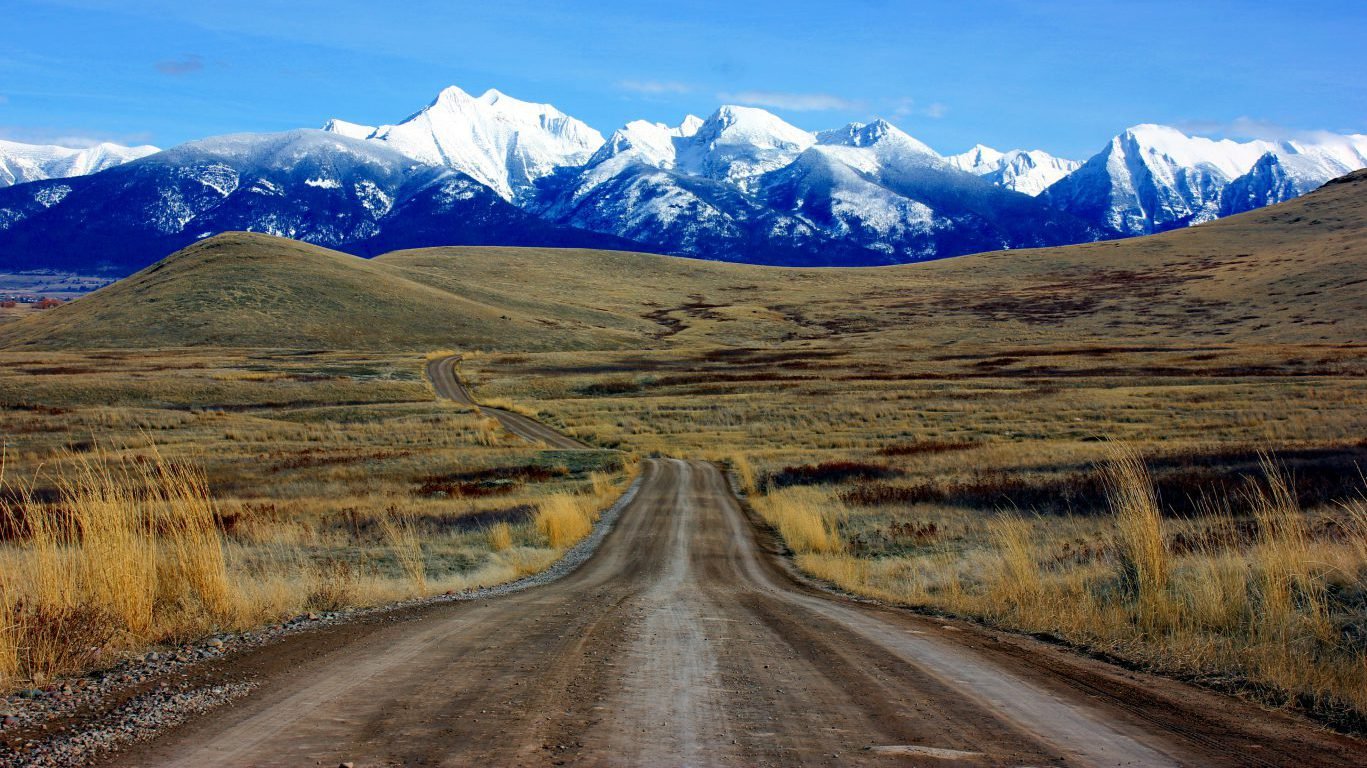
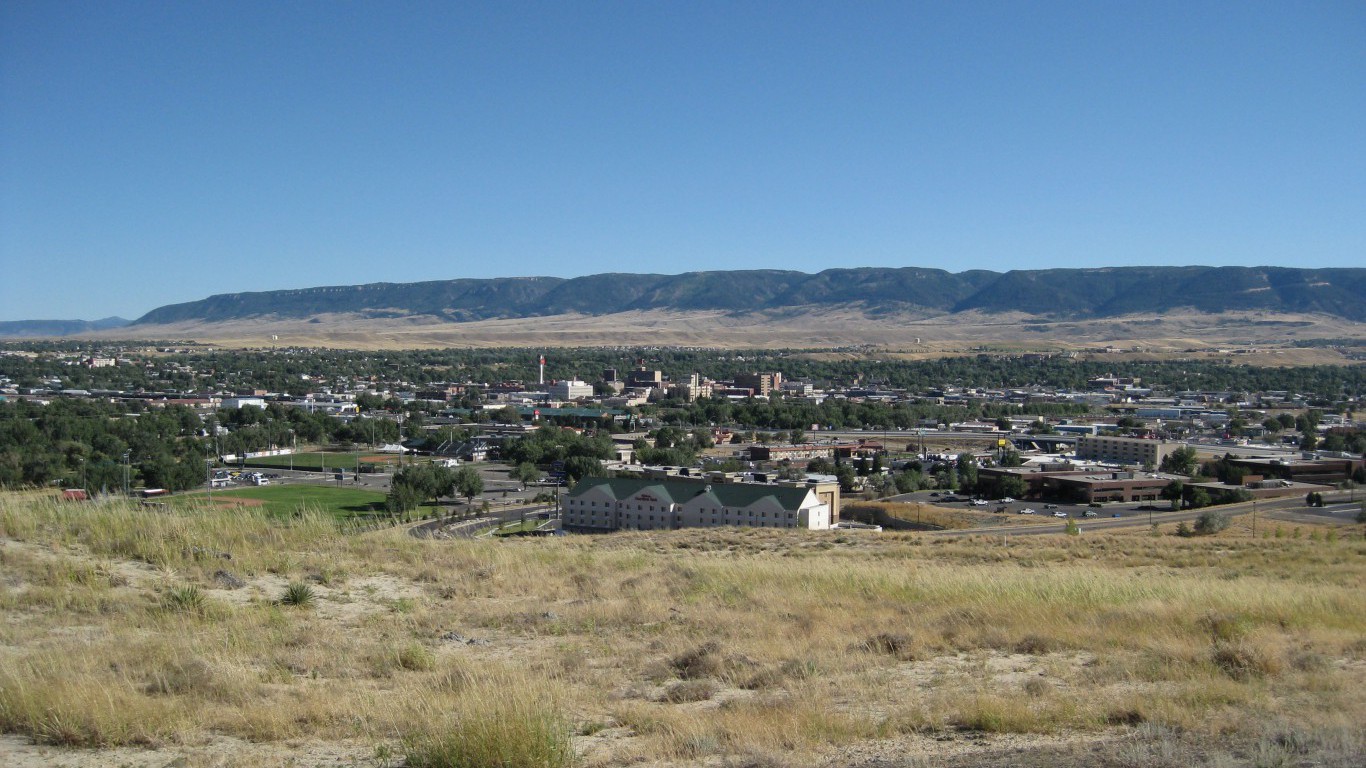
9. Montana
> 2001-2015 sightings per 100K: 59.2
> Total sightings: 617 (9th lowest)
> Population per sq. mile: 7 (3rd lowest)
> Households without internet: 24.0% (tied-18th highest)
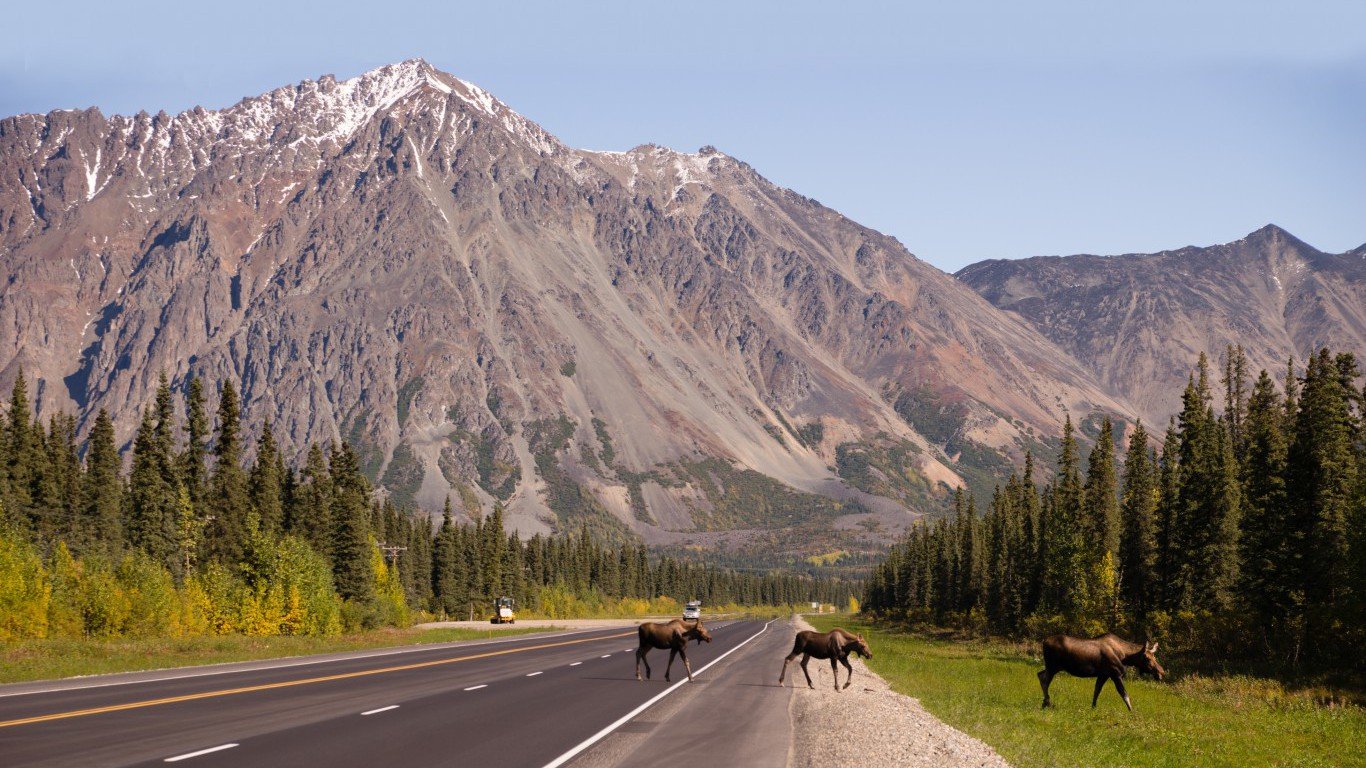
8. Alaska
> 2001-2015 sightings per 100K: 63.9
> Total sightings: 474 (5th lowest)
> Population per sq. mile: 1 (the lowest)
> Households without internet: 17.8% (8th lowest)

7. New Mexico
> 2001-2015 sightings per 100K: 67.4
> Total sightings: 1,402 (22nd lowest)
> Population per sq. mile: 18 (6th lowest)
> Households without internet: 31.9% (3rd highest)
[in-text-ad-2]
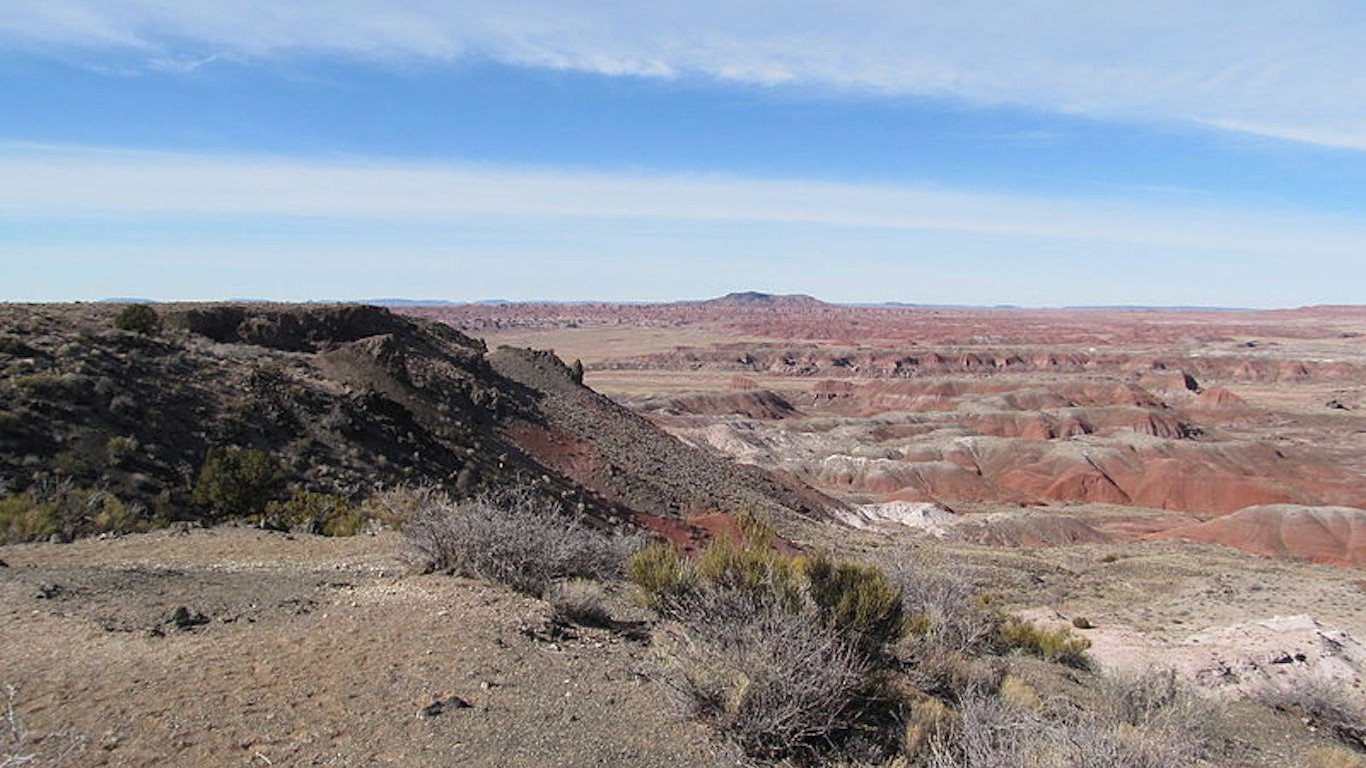
6. Arizona
> 2001-2015 sightings per 100K: 68.2
> Total sightings: 4,726 (7th highest)
> Population per sq. mile: 60 (18th lowest)
> Households without internet: 21.5% (20th lowest)
5. New Hampshire
> 2001-2015 sightings per 100K: 69.8
> Total sightings: 932 (13th lowest)
> Population per sq. mile: 150 (21st highest)
> Households without internet: 15.1% (the lowest)
[in-text-ad]
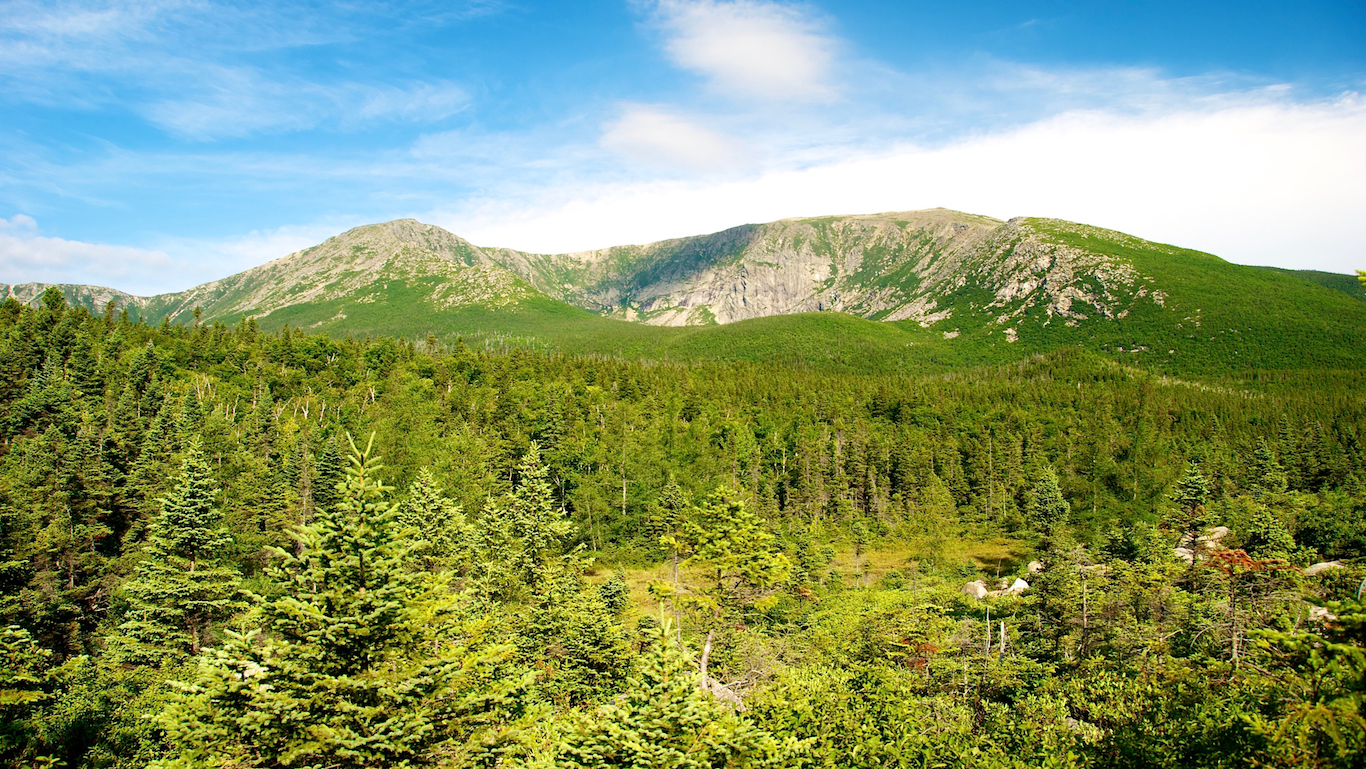
4. Maine
> 2001-2015 sightings per 100K: 71.3
> Total sightings: 949 (14th lowest)
> Population per sq. mile: 44 (13th lowest)
> Households without internet: 21.9% (22nd lowest)

3. Washington
> 2001-2015 sightings per 100K: 71.7
> Total sightings: 5,226 (4th highest)
> Population per sq. mile: 106 (24th highest)
> Households without internet: 15.6% (2nd lowest)
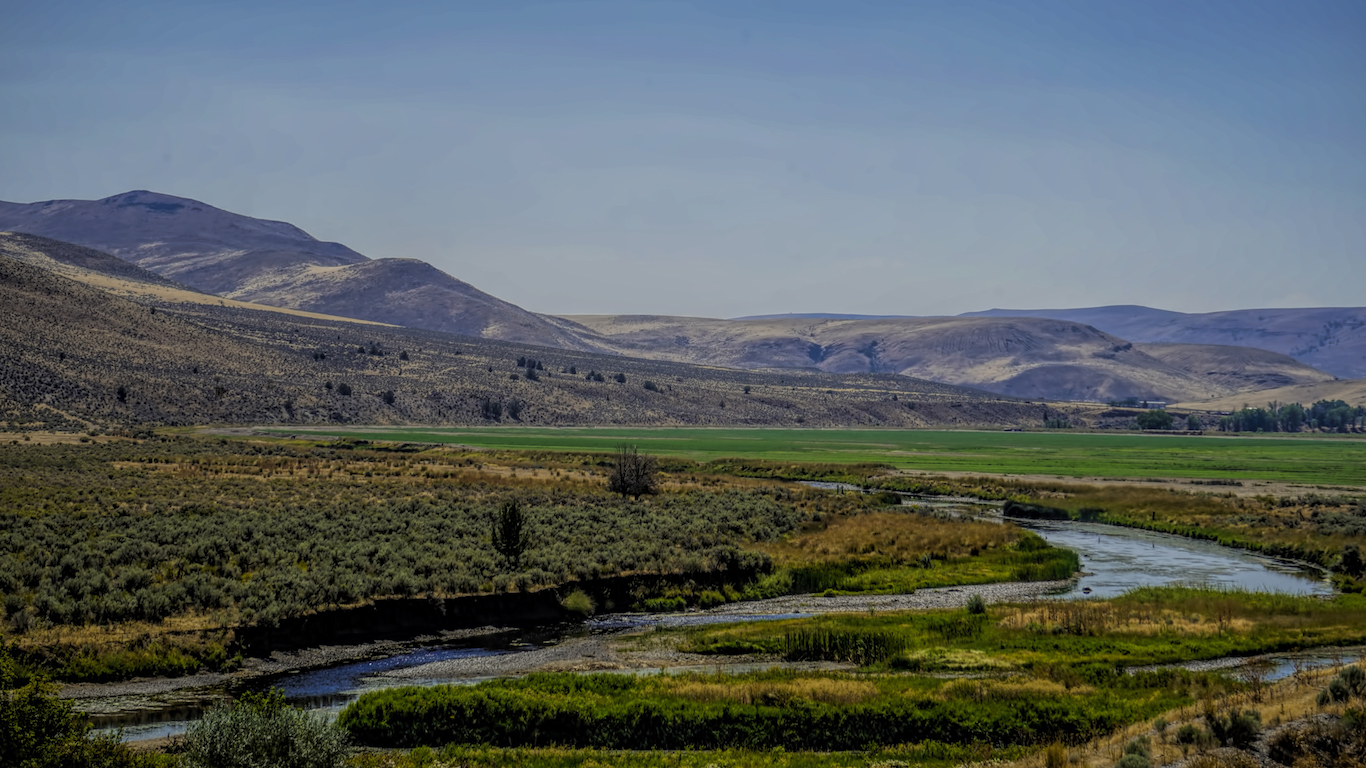
2. Oregon
> 2001-2015 sightings per 100K: 73.6
> Total sightings: 3,013 (13th highest)
> Population per sq. mile: 42 (12th lowest)
> Households without internet: 18.5% (12th lowest)
[in-text-ad-2]
1. Vermont
> 2001-2015 sightings per 100K: 80.7
> Total sightings: 504 (6th lowest)
> Population per sq. mile: 68 (20th lowest)
> Households without internet: 20.4% (14th lowest)
Detailed Findings
Cheryl Costa, one of the book’s authors, explained that the prevalence of UFO sightings does not say as much about the objects themselves as much as it says about the observers. “[The sightings] are about when observers are available to be outside in nice weather, and whether they have leisure time,” Costa said in an interview with 24/7 Wall St.
The states with the most UFO sightings, and the times of the year where such reports peak, both reflect the greater likelihood of observing the sky.
In Northern states with cold winters, sightings increase dramatically during summer months when more residents are spending their leisure time outdoors. During February in Minnesota, for example, only 69 UFO sightings have been reported since the beginning of the 21st century. In August, there are four times as many reports, at 284 sightings.
Alaska is a notable exception to seasonal trends across the North. Despite large variance in temperature between winter and summer months, sightings actually increase in Alaska during the winter and fall seasons compared to warmer months.
Of the dozens of shapes and types of sightings reported, the most commonly reported UFO appears as a light, which accounts for 13% of all sightings in the data set.
Costa explained that sightings are easier to see at night, which is much longer in Alaska during the winter months. At the summer solstice in Fairbanks, Alaska, the sun is up for more than 21 hours a day, while there are only four hours of sunlight at the winter solstice. Therefore, despite fewer residents out in winter, there are more UFO sightings during these darker months.
By comparison, UFO sighting levels are relatively flat during the year in Southern states, where weather and daylight conditions are also relatively consistent.
The history and culture of an area, which may influence how likely residents are to report a sighting, may further account for the variance between states. Costa noted that people in parts of New Mexico and California continue to share and discuss historic UFO sightings. For example, The Battle of Los Angeles, the name of the famous 1942 incident often cited by some conspiracy theorists as evidence of an alien visit, took place in LA County. The county, one of the most populated U.S. counties, is also home to the most UFO sightings of any county in California.
UFO sighting levels depend on not just the presence of unrecognizable objects, but also, of course, on the likelihood of actually reporting such observations. Nationwide, reports of UFO sightings spiked at the turn of the century for two primary reasons: first, the significant increase in broadband internet access made reporting considerably easier, making reporting considerably easier; and second, after September 11 2001 U.S. citizens were strongly encouraged to report everything they saw. “They said report what you see and this is what people said they saw,” Costa noted.
Methodology
To determine the states with the most UFO sightings, 24/7 Wall St. reviewed 2001-2015 sightings per 100,000 people with data from Cheryl Costa’s “UFO Sightings Desk Reference: United States of America 2001-2015: Unidentified Flying Objects Frequency–Distribution–Shapes.”
2001-2015 total sightings also came from the same source. Population density figures were calculated using 2016 population estimates and 2010 land area in square miles — both from the U.S. Census Bureau. The share of households without internet are from the 2015 U.S. Census Bureau’s American Consumer Survey.
Are you ready for retirement? Planning for retirement can be overwhelming, that’s why it could be a good idea to speak to a fiduciary financial advisor about your goals today.
Start by taking this retirement quiz right here from SmartAsset that will match you with up to 3 financial advisors that serve your area and beyond in 5 minutes. Smart Asset is now matching over 50,000 people a month.
Click here now to get started.
Thank you for reading! Have some feedback for us?
Contact the 24/7 Wall St. editorial team.


 24/7 Wall St.
 24/7 Wall St.
 24/7 Wall St.
 24/7 Wall St.