Special Report
The Most Dangerous City in Every State

Published:
Last Updated:
After more than two decades of steady decline, violent crime in the U.S. may be on the rise once again. There were an estimated 15,696 murders in the United States in 2015, up over 10% from the previous year and contributing to a 3.9% increase in violent crime overall.
Despite the uptick, U.S. crime rates remain near historic lows, with violent crime down over 50% since 1991. Still, how exposed Americans are to crime depends largely on where they live, as the incidence of crime is not uniform across the country. Violent crime is far more common in some cities than others.
24/7 Wall St. reviewed data from the FBI Uniform Crime Report to identify the most dangerous metropolitan area in each state.
Click here to see the most dangerous city in every state.
Click here to see the detailed findings and methodology.
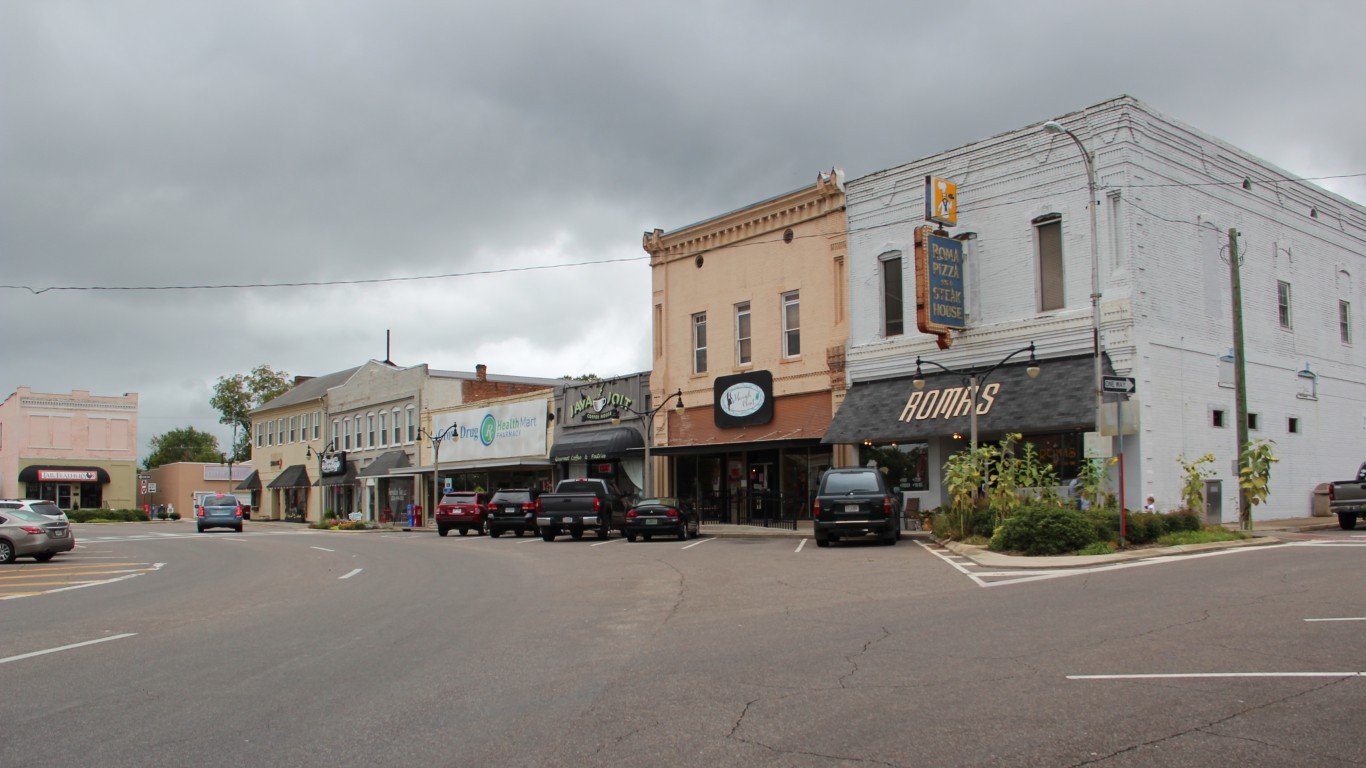
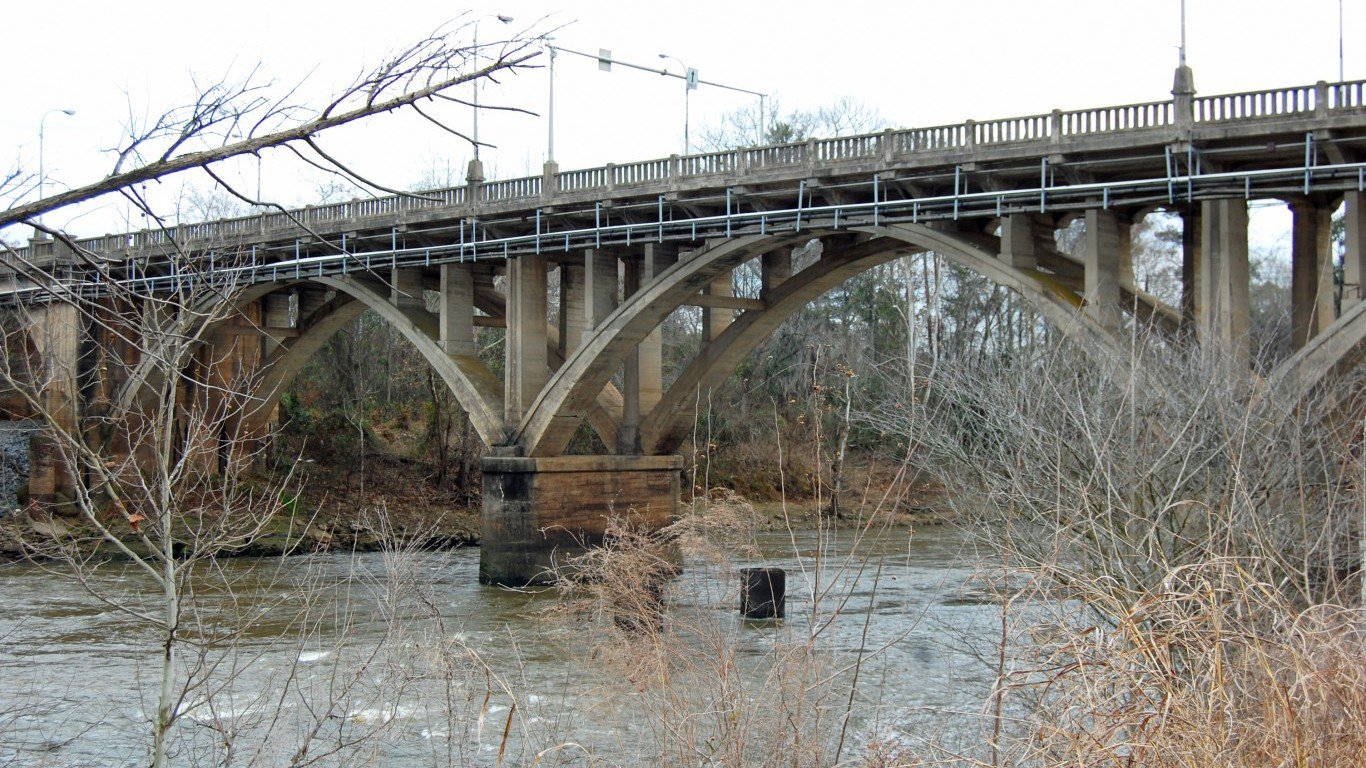
1. Anniston-Oxford-Jacksonville, Alabama
> City violent crime rate: 699.3 per 100,000
> State violent crime rate: 472.4 per 100,000 (10th highest)
> City poverty rate: 20.0%
> City unemployment rate: 6.2%
The violent crime rate in the Anniston-Oxford-Jacksonville metro area of 699 incidents per 100,000 residents is the highest of all 11 metro areas in Alabama monitored by the FBI and well above the national violent crime rate of 373 incidents per 100,000 people.
People are more likely to turn to crime when more respectable economic opportunities are scarce, and the poor economic conditions in Anniston may be partially to blame for the high prevalence of crime in the metro area. Throughout the metro area, 20.0% of residents live in poverty and 6.2% of the workforce is out of a job, the second highest poverty and unemployment rates of any metro area in the state.
[in-text-ad]
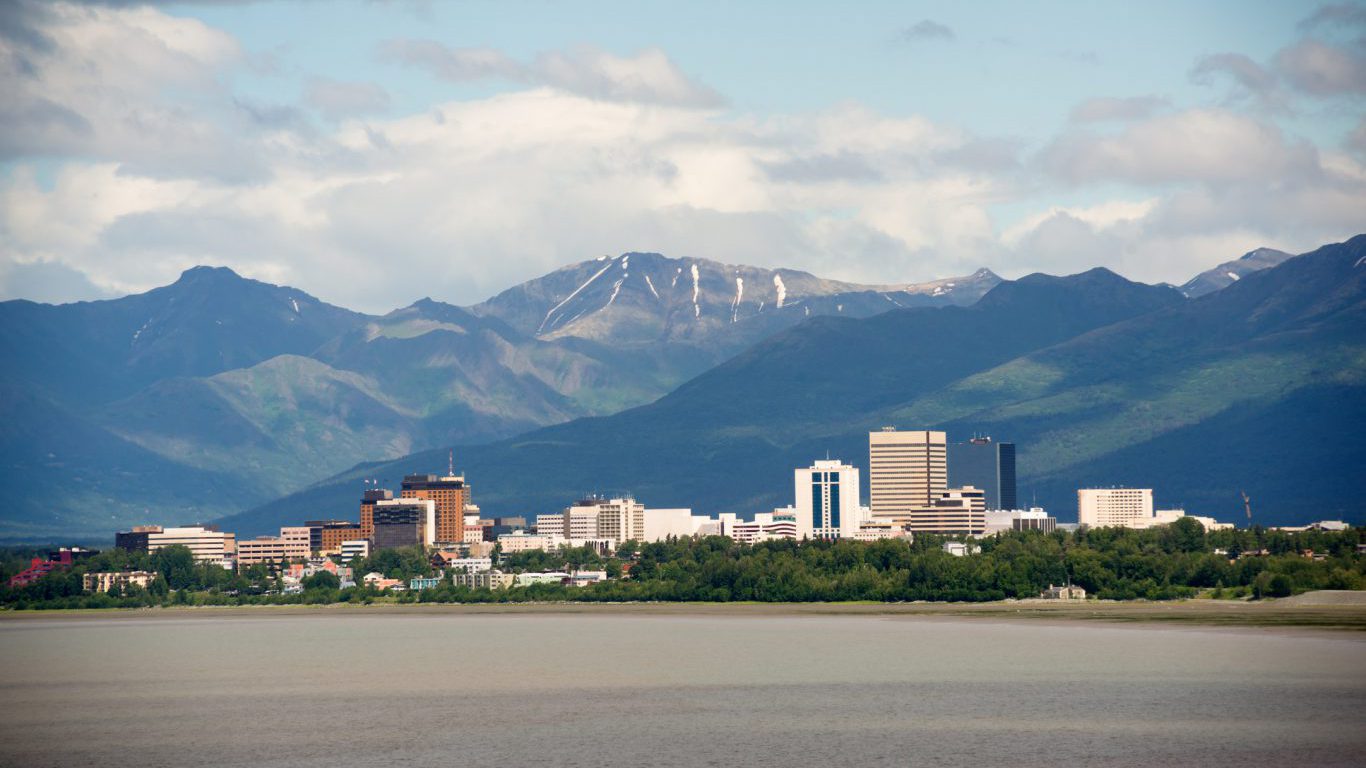
2. Anchorage, Alaska
> City violent crime rate: 1,039.5 per 100,000
> State violent crime rate: 730.2 per 100,000 (the highest)
> City poverty rate: 8.7%
> City unemployment rate: 6.1%
As is the case in most U.S. metro areas, aggravated assaults account for most violent crimes in Anchorage. There were 1,040 violent crimes for every 100,000 people in the metro area in 2015, one of the highest violent crime rates in the nation. Due in part to the prevalence of violent crime in Anchorage, Alaska’s violent crime rate is the highest of any state.
Homicide is also becoming increasingly more common in Anchorage. A rash of homicides last year prompted the FBI to assist local authorities with investigations. Anchorage police also warned residents not to travel alone at night after two bodies were found in a well-used public park in early September, the 24th and 25th murders of 2016.

3. Tucson, Arizona
> City violent crime rate: 421.4 per 100,000
> State violent crime rate: 410.2 per 100,000 (17th highest)
> City poverty rate: 18.9%
> City unemployment rate: 4.7%
Tucson’s violent crime rate of 421 incidents per 100,000 residents is roughly in line with the statewide rate of 410 incidents per 100,000 people. However, violent crime is slightly more common in both Tucson and Arizona than it is nationwide. Across the country, there were 373 violent crimes for every 100,000 Americans in 2015.
According to the Tucson Police Department, 31 of the 46 greater metro area 2015 homicides occurred within the city proper. The 2015 murder count marked a dramatic improvement from 2008, when the city tallied 68 murders, the most of any year in at least the last three and a half decades.
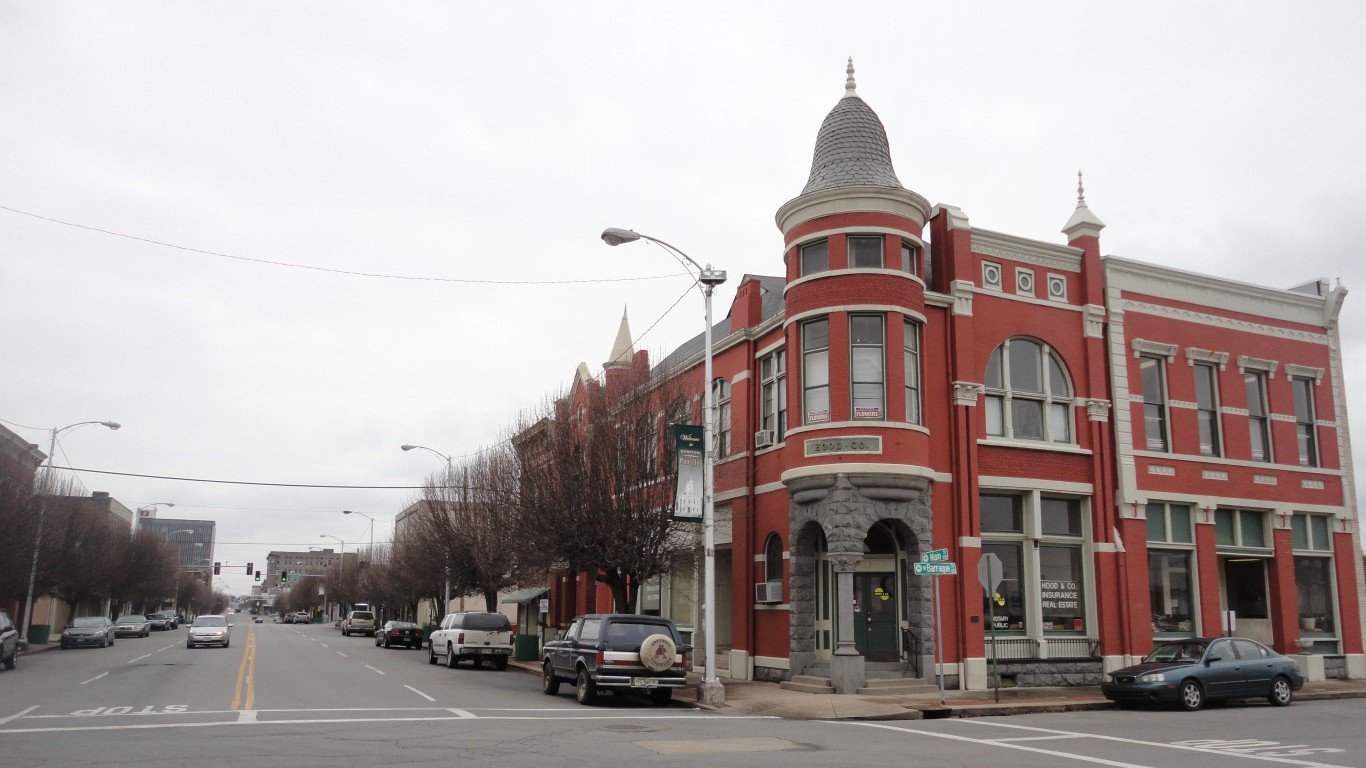
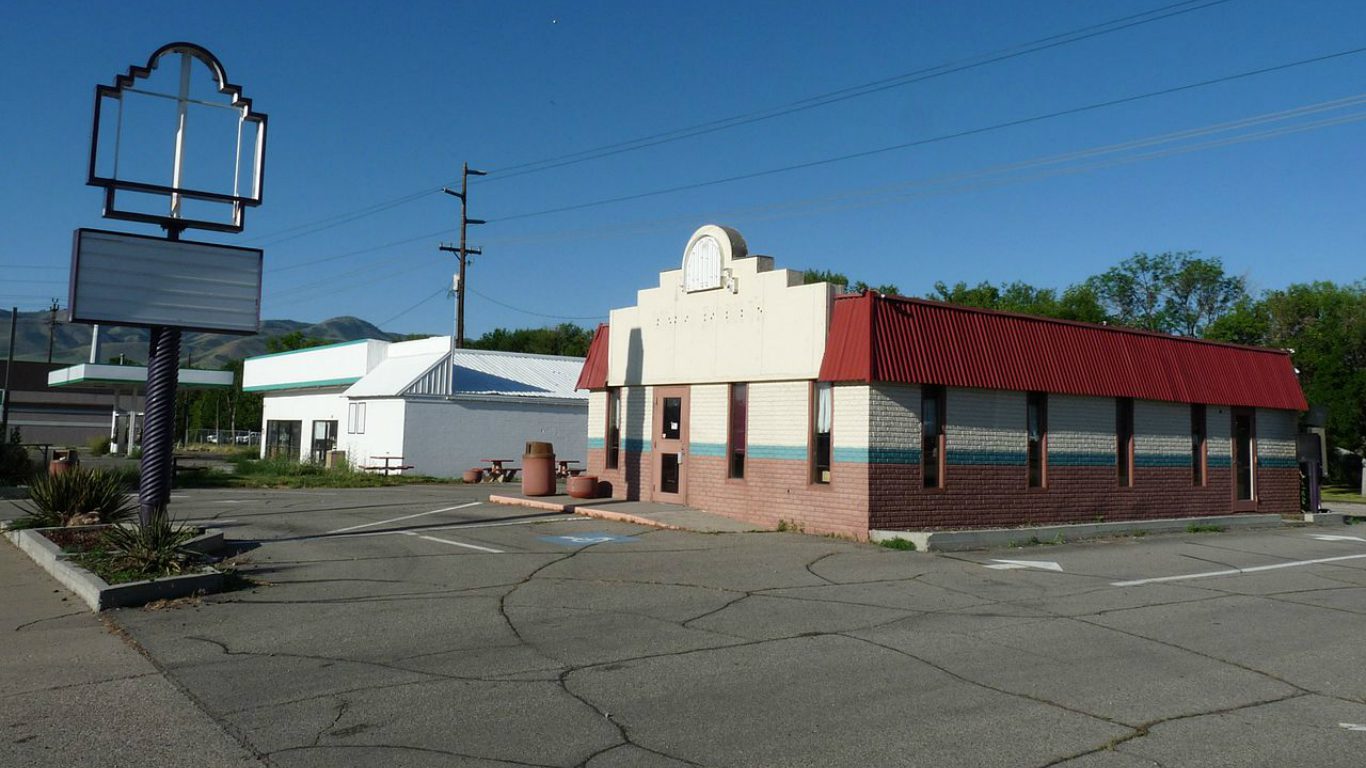
4. Pine Bluff, Arkansas
> City violent crime rate: 743.9 per 100,000
> State violent crime rate: 521.3 per 100,000 (6th highest)
> City poverty rate: 25.7%
> City unemployment rate: 5.1%
Pine Bluff is the most dangerous metro area in one of the most dangerous states. Though Pine Bluff is the smallest of the four metro areas monitored by the FBI in Arkansas, it had the second most murders in the state in 2015.
Still, the small metro area’s violent crime rate has improved in recent years. The police department attributes the falling crime rate to the creation of a violent crime task force and the demolition of old abandoned buildings, which often serve as a popular venue for illegal activity.
[in-text-ad-2]
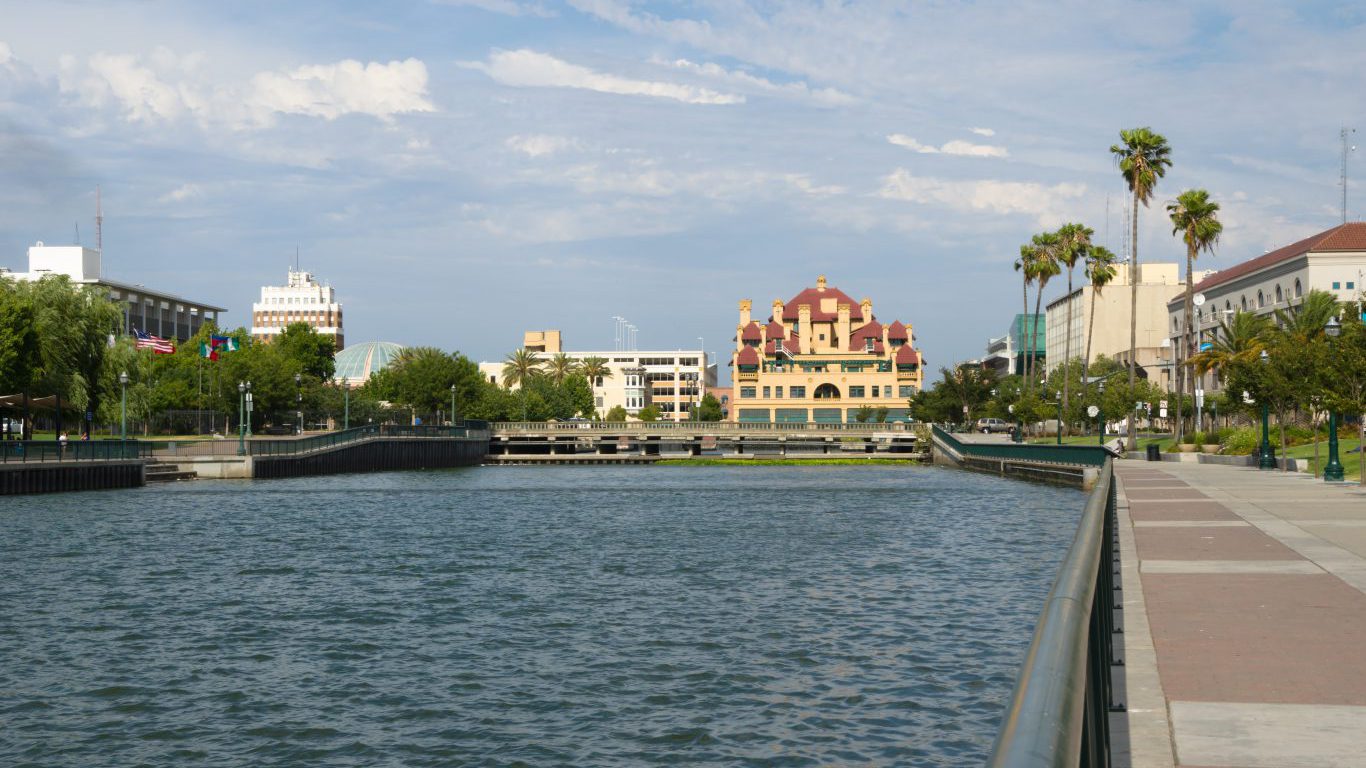
5. Stockton-Lodi, California
> City violent crime rate: 797.1 per 100,000
> State violent crime rate: 426.3 per 100,000 (13th highest)
> City poverty rate: 17.4%
> City unemployment rate: 7.5%
With a violent crime rate of 797 incidents for every 100,000 residents, Stockton-Lodi is the most dangerous of the 26 California metro areas considered. Crime is often more common in areas that lack economic opportunity, and 7.5% of the Stockton-Lodi labor force is unemployed, a much larger share than the 4.9% statewide unemployment rate.
As is the case in most metro areas, aggravated assault was the most common violent crime in Stockton-Lodi in 2015, followed by robbery.

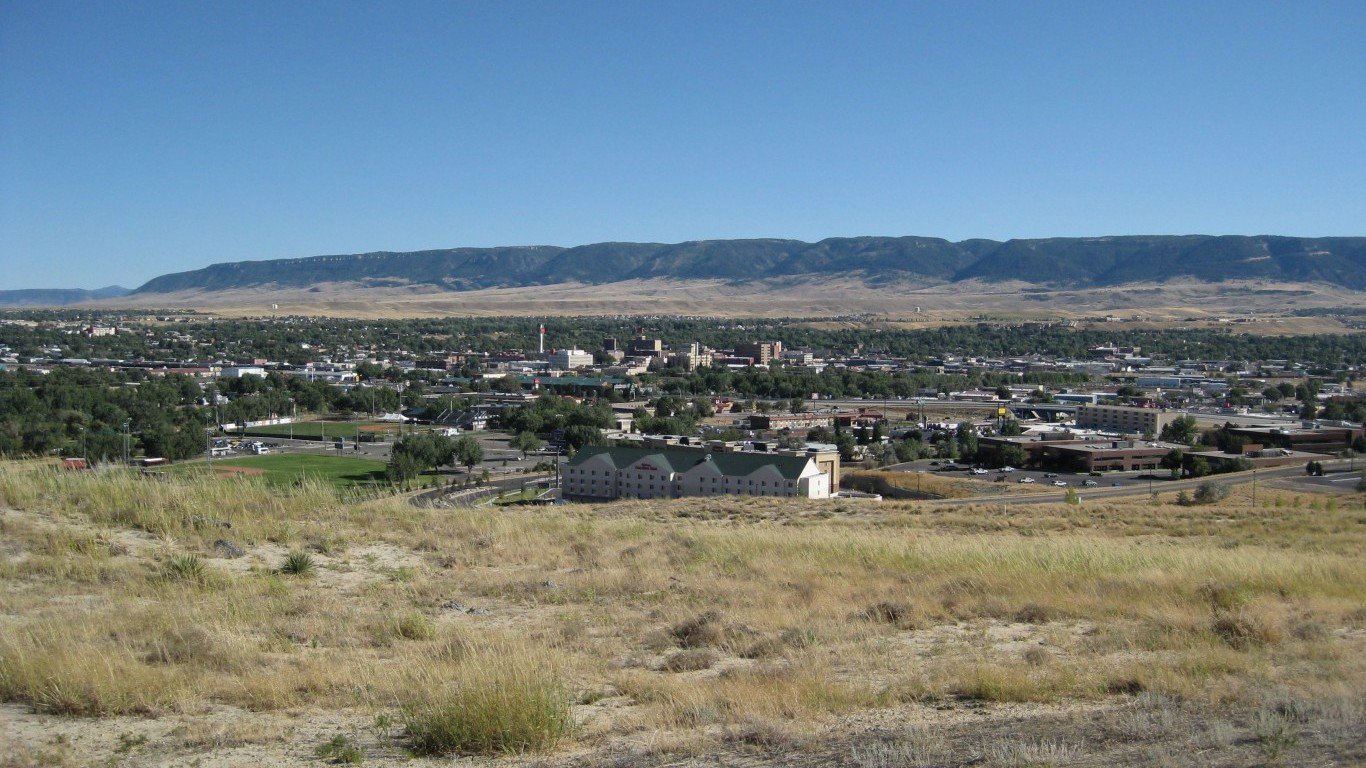
6. Pueblo, Colorado
> City violent crime rate: 615.7 per 100,000
> State violent crime rate: 321.0 per 100,000 (23rd lowest)
> City poverty rate: 20.1%
> City unemployment rate: 3.5%
Pueblo, with 616 violent crimes for every 100,000 residents, is by far the most dangerous metro area in Colorado. The next most dangerous metro area in the state is Denver, with a reported 362 violent crimes for every 100,000 people.
Crime in the Pueblo metro area is driven in large part by gang-related activity. In 2015, the number of 911 calls reporting drive-by shootings and shots fired in general increased substantially over the previous year. Pueblo police are also struggling with manpower and budget issues. Officers felt unsafe, with insufficient manpower and outdated equipment, in the face of rising gang violence.
[in-text-ad]
7. Norwich-New London, Connecticut
> City violent crime rate: 323.7 per 100,000
> State violent crime rate: 218.5 per 100,000 (6th lowest)
> City poverty rate: 11.4%
> City unemployment rate: 4.8%
Despite its designation as the most dangerous metro area in Connecticut, Norwich-New London is relatively safe compared to the nation as a whole. There were 324 violent crimes in the area in 2015 per 100,000 people compared to a national violent crime rate of 373 incidents per 100,000 people.
While the city of New London had no reported murders in 2014, the streak was broken in early 2015 when a man was gunned down in a basement apartment. That murder was one of six murders reported throughout the broader metro area in 2015, contributing to the highest violent crime rate of the three metro areas with available data in the state.

8. Dover, Delaware
> City violent crime rate: 471.0 per 100,000
> State violent crime rate: 499.0 per 100,000 (8th highest)
> City poverty rate: 14.6%
> City unemployment rate: 4.8%
Because Dover is the only major metropolitan area in Delaware, it is the most dangerous city by default. Unlike the vast majority of metro areas on this list, Dover is actually slightly safer than the state as a whole. While there were 471 violent crimes per 100,000 people in Dover in 2015, the statewide violent crime rate was 499 per 100,000 the same year. Only 11 of the 63 homicides in the state in 2015 were reported in the Dover metro area.
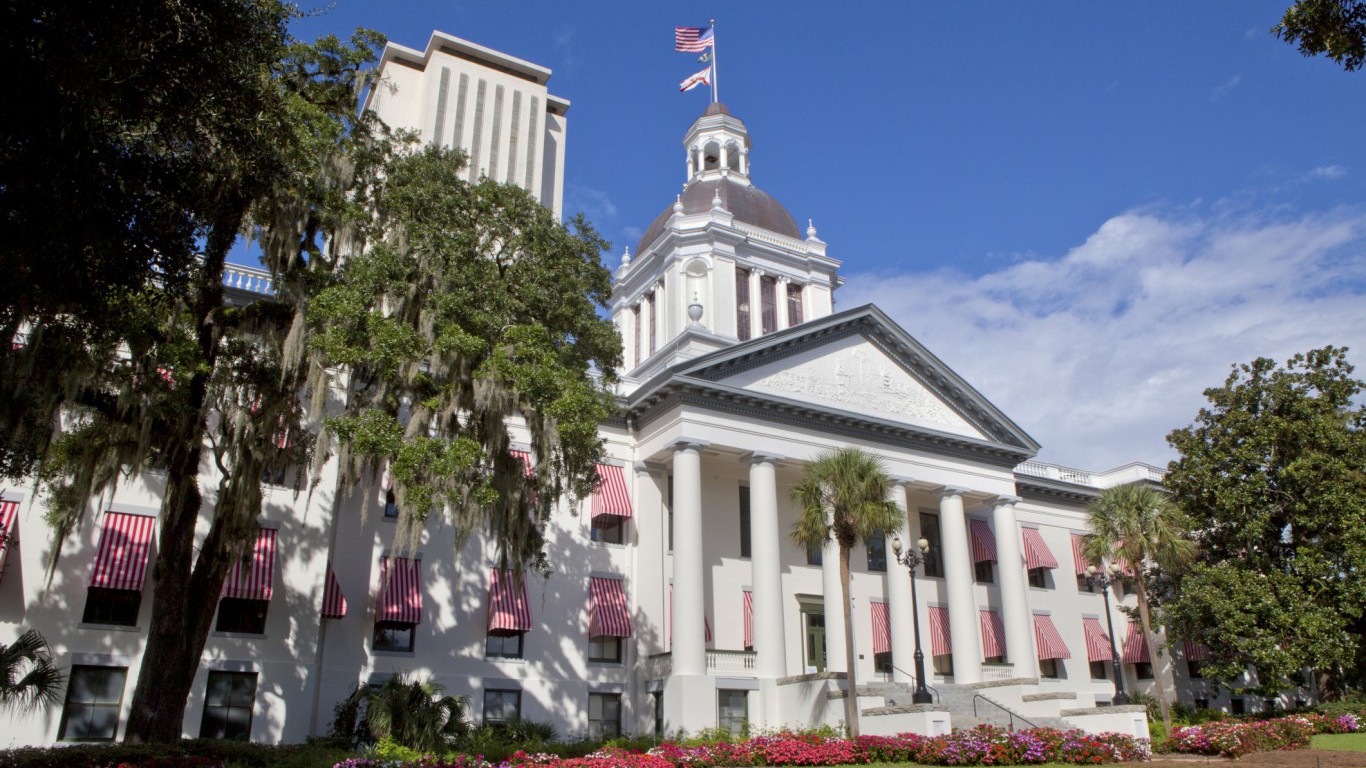
9. Tallahassee, Florida
> City violent crime rate: 767.1 per 100,000
> State violent crime rate: 461.9 per 100,000 (11th highest)
> City poverty rate: 22.4%
> City unemployment rate: 4.4%
Tallahassee, Florida’s state capital, also appears to be the state’s crime capital. There were 767 violent crimes in Tallahassee for every 100,000 residents in 2015, far more than in any of the state’s 21 other metro areas monitored by the FBI.
Tallahassee is the county seat of Leon County, which had the highest overall crime rate in Florida for the second year in a row in 2015. In response to the relative prevalence of violence, the Tallahassee Police Department adopted a preventative approach, expanding a visible police presence in high crime areas.
[in-text-ad-2]
10. Albany, Georgia
> City violent crime rate: 667.9 per 100,000
> State violent crime rate: 378.3 per 100,000 (24th highest)
> City poverty rate: 24.6%
> City unemployment rate: 6.0%
Crime is more likely to be a problem in parts of the country with limited economic opportunities. The area’s unemployment rate is the highest in the state, and one of the highest among all U.S. metro areas. The poor employment opportunities like contribute to a larger share of residents living with inadequate income. About one in four metro area residents live in poverty, well above the 17% statewide poverty rate. Serious financial hardship may be fueling crime in the area. Driven primarily by incidents of aggravated assault, Albany has the highest violent crime rate in Georgia.
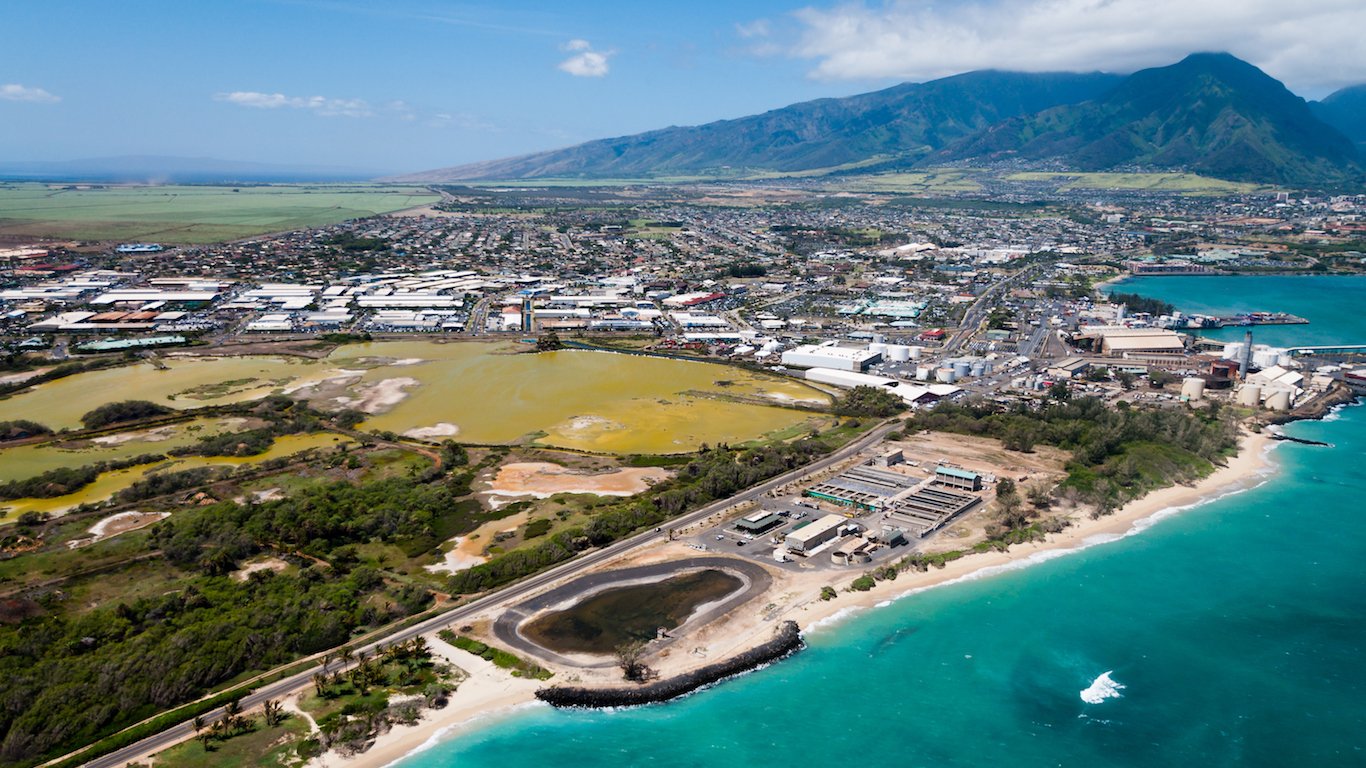
11. Kahului-Wailuku-Lahaina, Hawaii
> City violent crime rate: 337.7 per 100,000
> State violent crime rate: 293.4 per 100,000 (20th lowest)
> City poverty rate: 9.7%
> City unemployment rate: 3.0%
Hawaii is one of the safer states in the country, and even its most dangerous metro area is safer than the country as a whole. There were 338 violent crimes for every 100,000 people in the Kahului-Wailuku-Lahaina metro area in 2015, slightly below the 373 violent crimes for every 100,000 people national rate. In Urban Honolulu, the only other metro area in the state, the violent crime rate is even lower at 244 incidents per 100,000 people.
Across the Kahului-Wailuku-Lahaina metro area, there were four murders in 2015, among the fewest of any city on this list.
[in-text-ad]
12. Pocatello, Idaho
> City violent crime rate: 264.3 per 100,000
> State violent crime rate: 215.6 per 100,000 (5th lowest)
> City poverty rate: 25.3%
> City unemployment rate: 3.2%
Idaho is one of the safest states in the country. Even Pocatello, the most dangerous metro area in the state, has a lower violent crime rate that the nation as a whole. There were 264 violent crimes in the metro area for every 100,000 residents in 2015, well below the national violent crime rate of 373 incidents per 100,000 people. The Pocatello metro area is one of three on this list to report only one murder in all of 2015. As is the case with most U.S. cities, aggravated assaults are the most common violent crime in Pocatello.

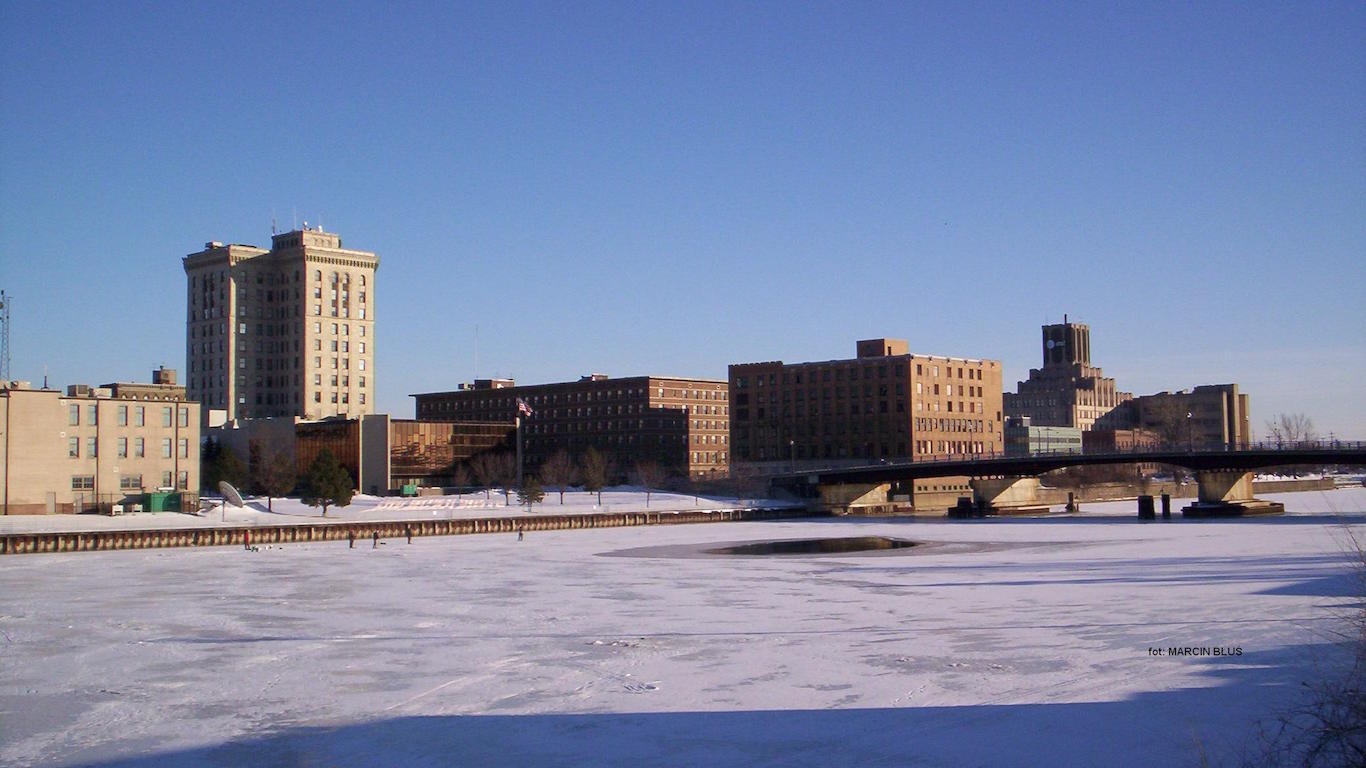
13. Rockford, Illinois
> City violent crime rate: 818.8 per 100,000
> State violent crime rate: 383.8 per 100,000 (21st highest)
> City poverty rate: 14.3%
> City unemployment rate: 8.0%
While many Americans automatically associate violent urban crime with Chicago, a city plagued by seemingly unending gang-related homicide, Chicago is far from the the most dangerous metro area in Illinois. There were about 378 violent crimes in Chicago for every 100,000 residents in 2015, less than half the violent crime rate of 819 incidents per 100,000 people in Rockford, a city located about 90 miles northwest of Chicago.
The Department of Justice provided Rockford police with a list of recommendations to help them reduce violent crime. The DOJ’s report emphasized a community approach to reduce youth violence and recommended more robust monitoring practices for certain parolees.

14. Indianapolis-Carmel-Anderson, Indiana
> City violent crime rate: 674.2 per 100,000
> State violent crime rate: 387.5 per 100,000 (20th highest)
> City poverty rate: 13.9%
> City unemployment rate: 3.3%
With 674 violent crimes per 100,000 residents, the Indianapolis metro area is the most dangerous in Indiana. Of the 164 homicides in the metro area, 144 were in the city proper, making 2015 the deadliest year in the city’s history. In an effort to reduce the incidence of violent crime, the Indianapolis Police Department is putting greater emphasis on community policing and addressing the root cause of violence by bolstering mental health services, addiction recovery support, and youth education.
Indiana is slightly more dangerous than the nation as a whole, and according to a study conducted by the nonprofit research group Violence Policy Center, Indiana has the second highest rate of black homicide victims of any state.
[in-text-ad-2]

15. Waterloo-Cedar Falls, Iowa
> City violent crime rate: 497.0 per 100,000
> State violent crime rate: 286.1 per 100,000 (18th lowest)
> City poverty rate: 12.4%
> City unemployment rate: 3.6%
Despite a multi-year downward trend in violent crime in the city of Waterloo, Waterloo-Cedar Falls ranks as the most dangerous city in Iowa. There were 497 incidents of violent crime in the metro area in 2015 per 100,000 residents, well above the statewide violent crime rate of 286 incidents per 100,000.
In response to deadly interactions between police and citizens in places like Ferguson, Missouri and Baltimore, Maryland, the Cedar Falls Police Department in 2015 began employing the use of police body cameras. Use of police body cameras is controversial, but some studies show their use reduces the risk of violence when police interact with suspects.

16. Wichita, Kansas
> City violent crime rate: 673.2 per 100,000
> State violent crime rate: 389.9 per 100,000 (19th highest)
> City poverty rate: 14.1%
> City unemployment rate: 4.2%
The largest metropolitan area in Kansas, Wichita is also the most dangerous city in the state. While the suburbs of Wichita are relatively safe, crime is far more common in the city’s downtown neighborhoods. There were 673 violent crimes per 100,000 Wichita residents in 2015, far more than the statewide crime rate of 390 incidents per 100,000 people. Among the many violent crimes reported were 30 murders, 763 robberies, and more than 3,000 aggravated assaults.
While the risk of violence often rises with poverty, Wichita is not the poorest metro area in Kansas. Some 14.1% of Wichita residents live in poverty, higher than the statewide 13.0% poverty rate yet lower than, for example, the 20.8% poverty rate in Manhattan, Kansas. Violence also can be more common in areas with higher unemployment, and Wichita’s 4.2% unemployment rate is the highest in the state.
[in-text-ad]

17. Louisville/Jefferson County, Kentucky
> City violent crime rate: 422.9 per 100,000
> State violent crime rate: 218.7 per 100,000 (7th lowest)
> City poverty rate: 13.4%
> City unemployment rate: 4.1%
The Louisville metro area has the highest violent crime rate of any of the five metro areas in the state tracked by the FBI. Of the 96 murders in the metro area, 84 were in the Louisville city proper, making 2015 the city’s deadliest year since at least 1980. In many U.S. cities, violent crime tends to be localized to certain parts of the city, and Louisville is no exception. About 75% of 2015 homicides in the city occurred in neighborhoods on the west side of Interstate 65.
City officials attribute the prevalence of violent crime to a number of causes, including drug addiction and the availability of illegal guns.
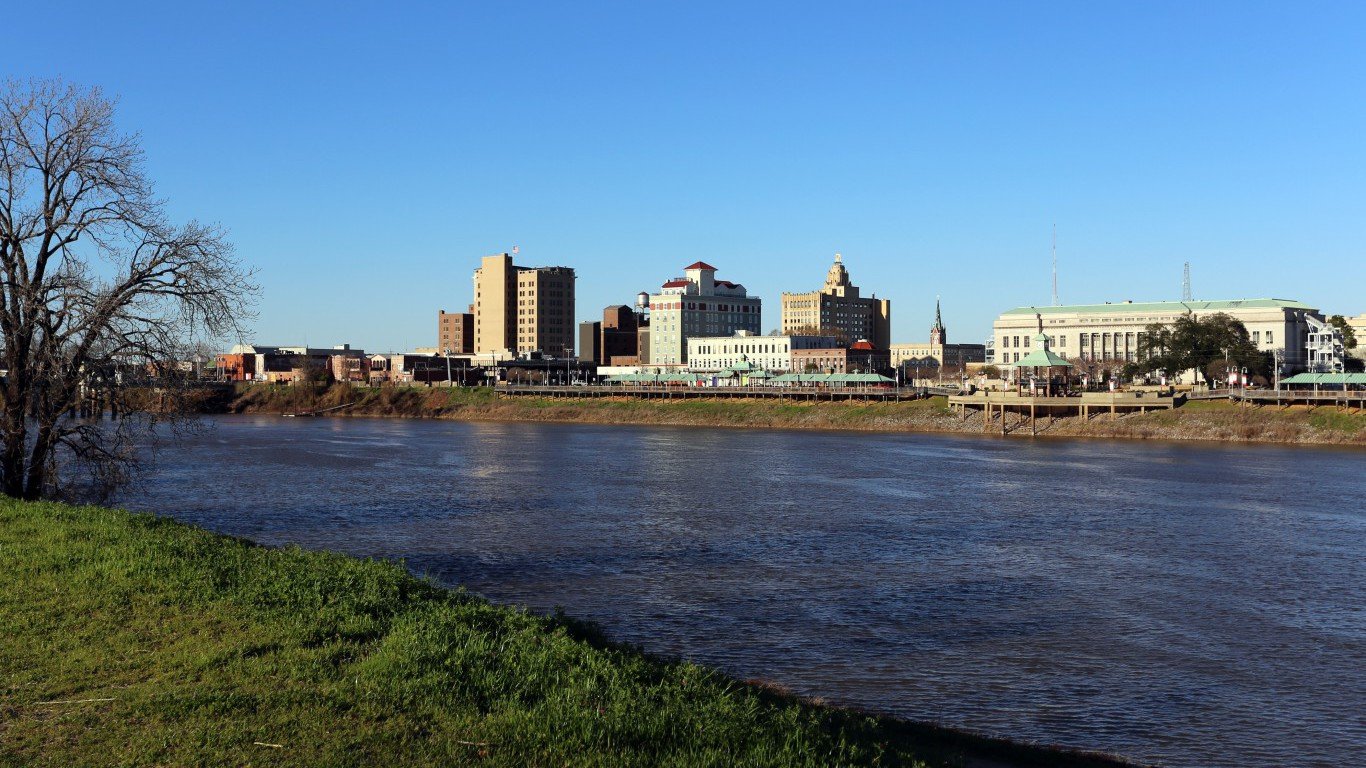
18. Monroe, Louisiana
> City violent crime rate: 1,160.0 per 100,000
> State violent crime rate: 539.7 per 100,000 (5th highest)
> City poverty rate: 23.9%
> City unemployment rate: 5.8%
Monroe is the most dangerous metro area in one of the most dangerous states in the country. Monroe’s violent crime rate of 1,160 incidents per 100,000 residents is more than double Louisiana’s violent crime rate, and higher than that of any other metro area nationwide.
In response to the high prevalence of violent crime, the city’s police department rolled out several crime prevention initiatives. In early 2015, the Monroe Police Department launched a mobile app that allows residents to ask questions, get disaster information, and provide feedback. The app’s most widely used function, however, is providing anonymous tips. In the summer months, the department rolled out its new street crime unit, tasked with building community relations and addressing crime hot spots. Officers on the force also received a 10% raise.

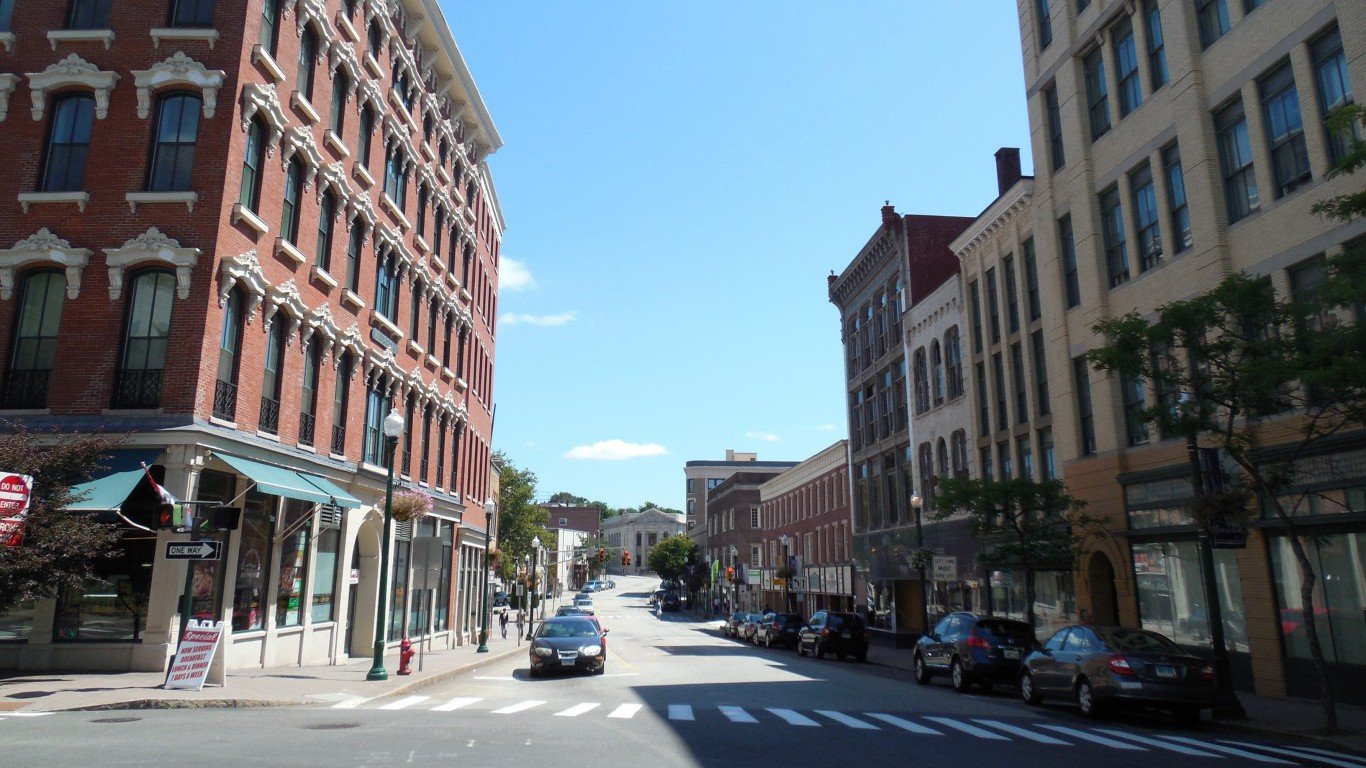
19. Lewiston-Auburn, Maine
> City violent crime rate: 138.0 per 100,000
> State violent crime rate: 130.1 per 100,000 (2nd lowest)
> City poverty rate: 15.4%
> City unemployment rate: 2.6%
Maine is one of the least dangerous states in the country, and even Lewiston, the most dangerous metro area in the state, has a low violent crime rate. There were 138 violent crimes reported per 100,000 residents of the Lewiston-Auburn metro area in 2015. While Lewiston has the highest violent crime rate in the state, the metro area is far less dangerous than America as a whole. There were 373 violent crimes per 100,000 Americans nationwide in 2015, well more than double the violent crime rate in Lewiston.
One notable change to the Lewiston metro area’s demographic has been the influx of Somali refugees over the past few years. While some area residents have claimed the wave of immigration has increased crime in the area, the metro area’s crime rate has actually been on the decline in the past few years. Lewiston’s violent crime rate is currently the lowest it has been since 2006.
[in-text-ad-2]

20. Baltimore-Columbia-Towson, Maryland
> City violent crime rate: 624.7 per 100,000
> State violent crime rate: 457.2 per 100,000 (12th highest)
> City poverty rate: 10.6%
> City unemployment rate: 4.5%
Over half of all 2015 murders in Maryland occurred in the Baltimore metro area. Baltimore, the most dangerous metro area in the state, had 367 homicides in 2015, the seventh most of all U.S. metro areas and more than many other cities more than double its size.
Many attribute the record number of homicides in Baltimore in 2015 to unrest fueled by the death of Freddie Gray while in police custody. Other theories point to an increase in drug-related violence, triggered by the looting of pharmacies during the April 2015 riots. While homicide spiked in Baltimore, robbery and aggravated assault were the primary drivers of the metro area’s highest in the state violent crime rate.

21. Springfield, Massachusetts
> City violent crime rate: 529.5 per 100,000
> State violent crime rate: 390.9 per 100,000 (18th highest)
> City poverty rate: 16.9%
> City unemployment rate: 4.5%
With 530 violent crimes for every 100,000 residents, Springfield is not only the most dangerous metro area in Massachusetts, but also the most dangerous in New England. The 22 murders that took place in the Springfield metro area in 2015 accounted for 17% of all murders statewide that year, even though the metro area’s population comprises only 9% of the Massachusetts population. As is the case in a majority of U.S. cities, incidence of robbery and aggravated assault contributed most to Springfield’s especially high violent crime rate.
Located around the Interstate 91 and Interstate 90 junction, the Springfield metro area is positioned along a major heroin trafficking route. Drug-related crimes are common among most cities with high violent crime rates.
[in-text-ad]
22. Saginaw, Michigan
> City violent crime rate: 604.5 per 100,000
> State violent crime rate: 415.5 per 100,000 (15th highest)
> City poverty rate: 18.4%
> City unemployment rate: 5.0%
While many may immediately think of Motor City as a violent urban area in Michigan, the Detroit metro area is actually slightly safer than the Saginaw metro area. There were 605 violent crimes in Saginaw for every 100,000 residents in 2015, more than every other metro in the state. To compare, Detroit’s violent crime rate was 498 incidents per 100,000 people that year.
In March 2015, the Michigan State Police stationed a police helicopter at the Saginaw County airport to reduce response time. Later that year, the Saginaw Police Department implemented a system for citizens to report non-emergency crimes through an online portal.
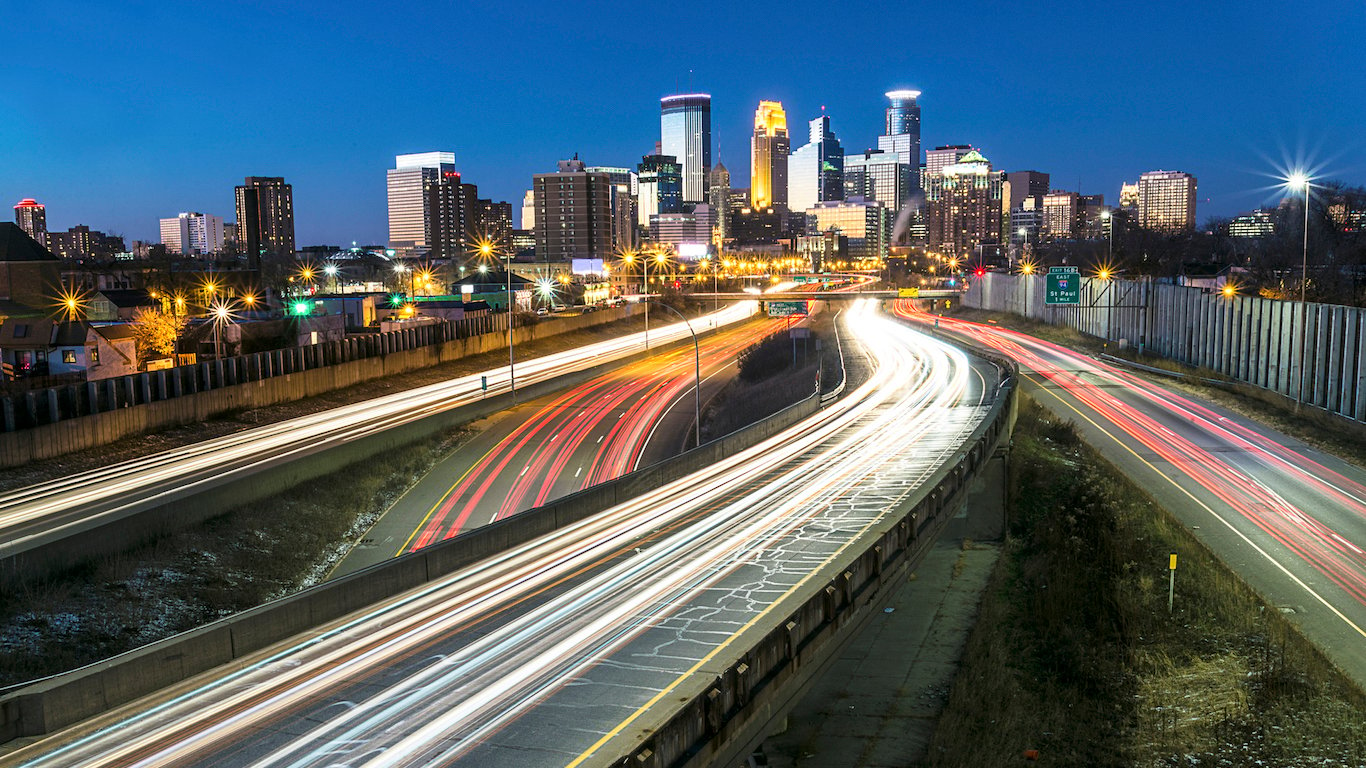
23. Minneapolis-St. Paul-Bloomington, Minnesota
> City violent crime rate: 285.2 per 100,000
> State violent crime rate: 242.6 per 100,000 (12th lowest)
> City poverty rate: 9.3%
> City unemployment rate: 3.4%
There were 285 violent crimes reported in the Minneapolis-St. Paul-Bloomington metro area in 2015, by far the most of any city in Minnesota and nearly twice the violent crime rates for the state’s Rochester and Mankato-North Mankato metro areas. Still, Minnesota is one of the safest states in the nation, and Minneapolis is safer than the nation as a whole. Nationwide there were 373 violent crimes per 100,000 Americans in 2015, roughly 90 more crimes per 100,000 people than in Minneapolis.
Crime tends to be more common in areas where poverty is rampant and educational attainment is low. In Minneapolis, however, the poverty rate is relatively low at 9.3%, second lowest of any city in Minnesota. Additionally, more than 40% of adults in the metro area have a bachelor’s degree, the highest college attainment rate in the state.
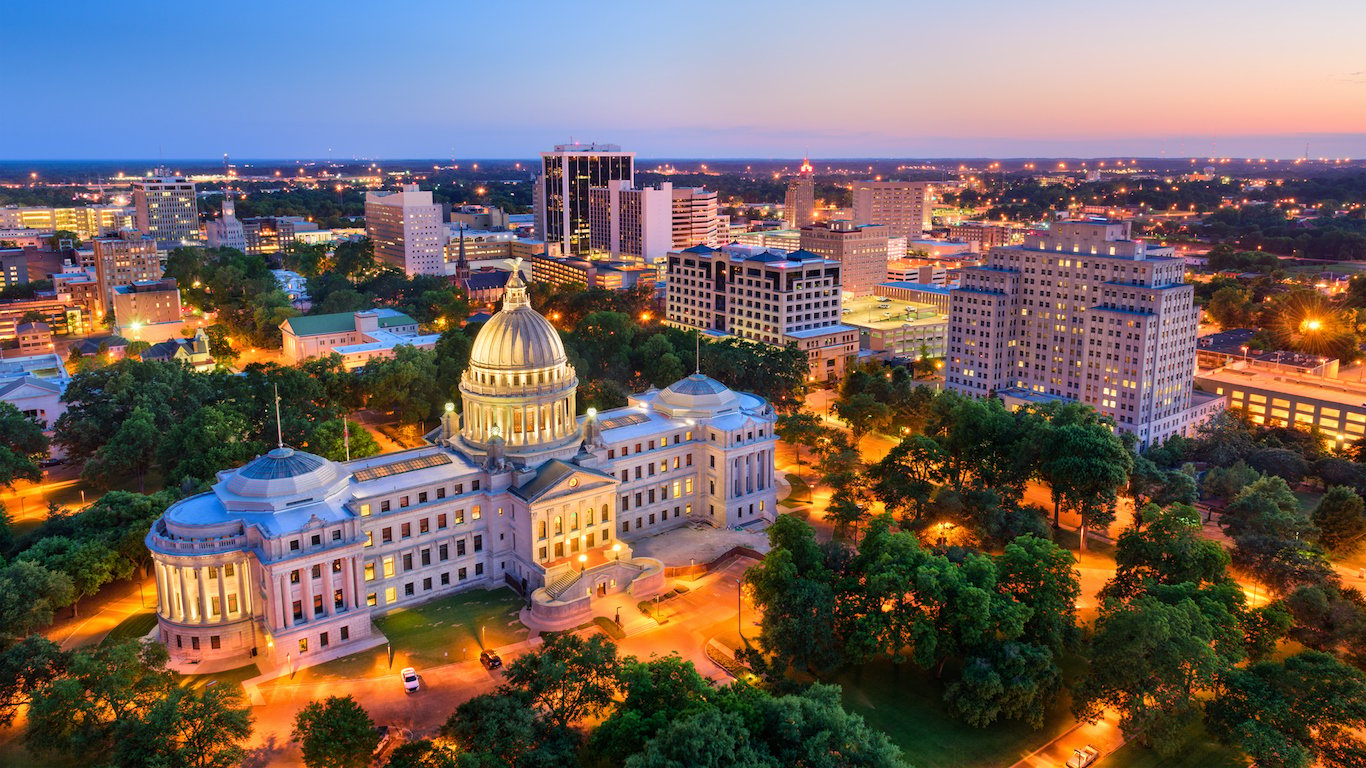
24. Jackson, Mississippi
> City violent crime rate: 359.4 per 100,000
> State violent crime rate: 275.8 per 100,000 (16th lowest)
> City poverty rate: 19.4%
> City unemployment rate: 4.2%
While East Jackson was once a major tourist destination during Mississippi’s extended prohibition era with thriving casino and nightlife industries, the city has since entered a period of economic decline, population loss, and rising crime. The metro area’s population has declined since 1980, as many of the wealthiest residents relocated to nearby suburbs and other cities. There were 359 violent crimes reported per 100,000 Jackson residents in 2015, far more than the statewide rate of 276 incidents per 100,000 residents. More than one in four violent crimes committed in Mississippi occurred in the Jackson metro area.
[in-text-ad-2]

25. Springfield, Missouri
> City violent crime rate: 621.3 per 100,000
> State violent crime rate: 497.4 per 100,000 (9th highest)
> City poverty rate: 16.8%
> City unemployment rate: 3.3%
Well over half of the 502 homicides in Missouri in 2015 took place in St. Louis. While the murder rate in St. Louis is more than three times that of Springfield, when accounting for rapes, aggravated assaults, and robberies as well, Springfield is by far the most dangerous city in the state. There were 621 violent crimes in Springfield for every 100,000 residents in 2015, well above the violent crime rate of 486 incidents per 100,000 people in the St. Louis metro area.
Crime in Springfield has risen dramatically in recent years. The number of murders rose from eight in 2009 to 15 in 2015; the number of robberies from 339 to 502, and the number of aggravated assaults from 1,332 to 1,950.

26. Missoula, Montana
> City violent crime rate: 425.2 per 100,000
> State violent crime rate: 349.6 per 100,000 (25th highest)
> City poverty rate: 16.0%
> City unemployment rate: 3.3%
Of the three Montana metro areas covered in the FBI UCR, Missoula is the most dangerous. While the state’s violent crime rate of 350 incidents per 100,000 people is slightly lower than the national violent crime rate of 373 per 100,000, Missoula is more dangerous than the state and the nation. There were 425 incidents of violent crime for every 100,000 residents in the metro are in 2015.
Poorer economic conditions can often be fertile grounds for violence, and Missoula’s 16.0% poverty rate is higher than any other metro area in the state as well as the statewide poverty rate of 14.6%.
[in-text-ad]

27. Lincoln, Nebraska
> City violent crime rate: 330.0 per 100,000
> State violent crime rate: 274.9 per 100,000 (15th lowest)
> City poverty rate: 13.7%
> City unemployment rate: 2.6%
Nebraska is not an especially dangerous state. Even in Lincoln, the most dangerous metro area in the state, the violent crime rate is lower than it is across the nation as a whole. There were 330 violent crimes for every 100,000 people in Lincoln in 2015, fewer than the 373 incidents per 100,000 people nationwide. Lincoln is one of only three metro areas on this list that reported only a single murder in 2015. Aggravated assault was the most common violent crime, with a total of 638 reported incidents.

28. Las Vegas-Henderson-Paradise, Nevada
> City violent crime rate: 815.0 per 100,000
> State violent crime rate: 695.9 per 100,000 (2nd highest)
> City poverty rate: 15.1%
> City unemployment rate: 4.9%
The Las Vegas-Henderson-Paradise metro area is currently experiencing an unprecedented surge in violent crime. The city’s crime rate rose from 647 incidents per 100,000 residents in 2011 to 815 per 100,000 in 2015, the highest of any metro area in Nevada and the eighth most of any city in the country. In recent years, there have been increased reports of robberies along the Las Vegas Strip, with criminals targeting tourists leaving casinos and other major attractions. There were 273 robberies reported per 100,000 residents in the Las Vegas metro area in 2015, the most of any city nationwide. Experts have blamed the spike in local crime on a police personnel shortage as well as an influx of criminals from California. California’s passing of Proposition 47, a ballot initiative that recategorized certain non-violent felonies as misdemeanors, has led to the re-sentencing and early release of more than 4,700 prisoners.
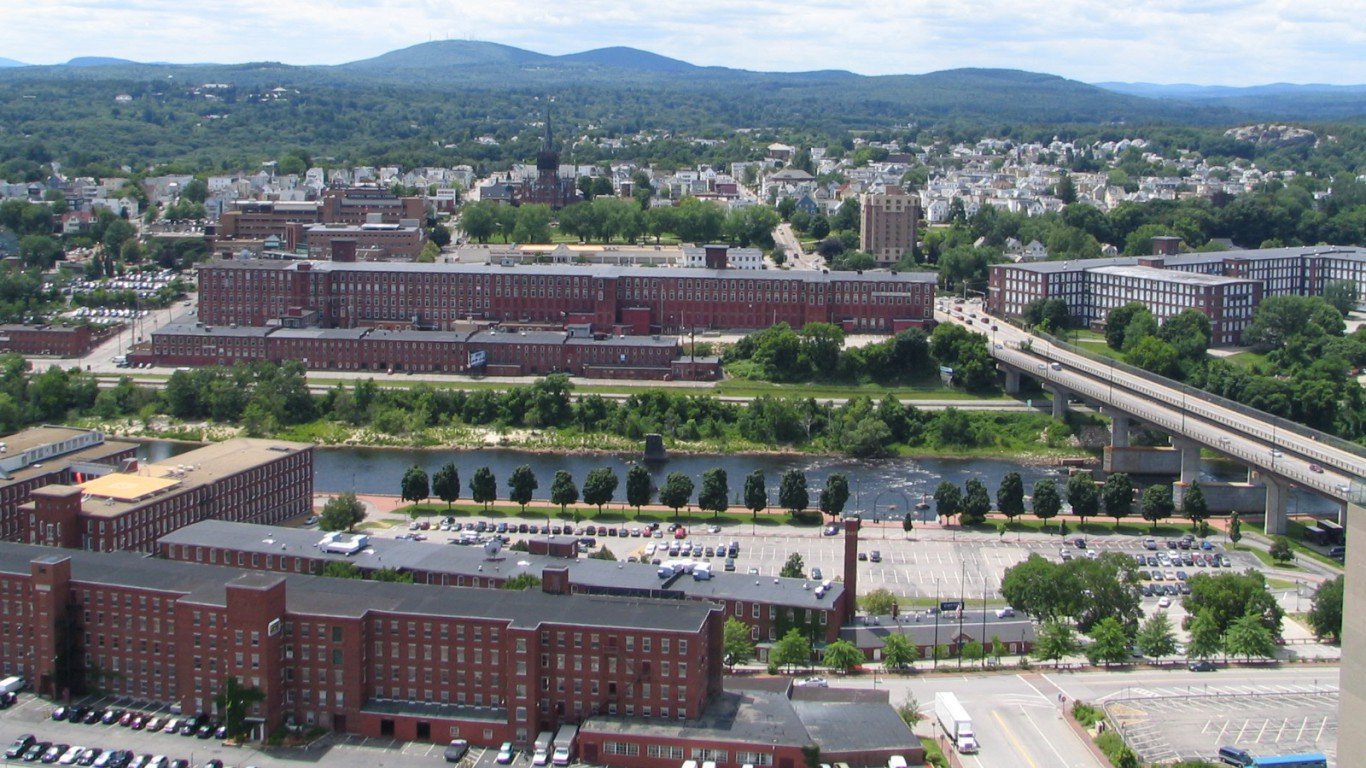
29. Manchester-Nashua, New Hampshire
> City violent crime rate: 281.4 per 100,000
> State violent crime rate: 199.3 per 100,000 (4th lowest)
> City poverty rate: 8.0%
> City unemployment rate: 2.7%
Manchester, the most dangerous city in New Hampshire, is not an especially dangerous metro area — not when compared to national or regional crime levels. There were only 281 violent crimes — mostly aggravated assaults — in the Manchester metro area for every 100,000 residents, well below the 373 incidents per 100,000 national violent crime rate. Manchester is also safer than many of the New England metro areas covered by the FBI.
Still, of the 14 murders reported in New Hampshire in 2015, 13 occurred in the Manchester metro area.
[in-text-ad-2]
30. Vineland-Bridgeton, New Jersey
> City violent crime rate: 583.4 per 100,000
> State violent crime rate: 255.4 per 100,000 (13th lowest)
> City poverty rate: 16.9%
> City unemployment rate: 5.9%
The most dangerous metro area in New Jersey, the violent crime rate in the Vineland-Bridgeton metro area of 583 incidents per 100,000 people is more than double the statewide violent crime rate. Unlike most states on this list, the Vineland metro area is the worst in the state in every category of violent crime: aggravated assault, rape, robbery, and homicide.
The metro area has something of a legacy of violence. The city’s founder, Charles Landis, in 1875 murdered a newspaper editor for reporting on his family in an unfavorable light. He was eventually acquitted of the crime on the grounds of temporary insanity.
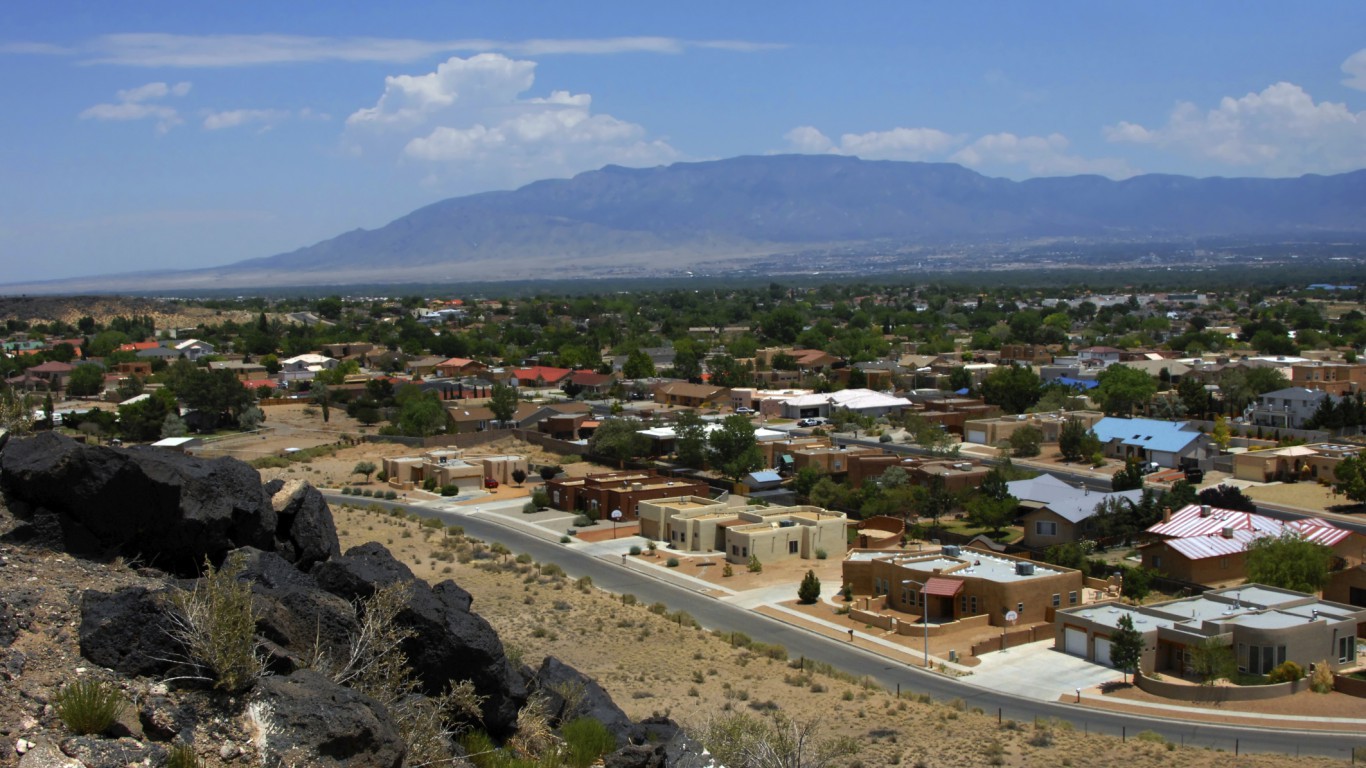
31. Albuquerque, New Mexico
> City violent crime rate: 792.6 per 100,000
> State violent crime rate: 656.1 per 100,000 (3rd highest)
> City poverty rate: 18.7%
> City unemployment rate: 6.2%
There were 793 violent crimes reported per 100,000 residents in Albuquerque in 2015, the most of any metro area in New Mexico and the 10th highest violent crime rate of any city in the country. The crime rate increased from three years prior, when 645 violent crimes were reported per 100,00 people. Property crime is also on the rise in the city. Roughly 6,100 motor vehicles were stolen on Albuquerque streets in 2015 alone, almost 2,000 more than in the year prior. Adjusted for population, the Albuquerque metro area has the second highest automobile theft rate in the country.
In an effort to combat the issue, New Mexico legislators have introduced bills in both the House and Senate that, if passed, would create a database that used car dealers could use to identify stolen automobiles.
[in-text-ad]
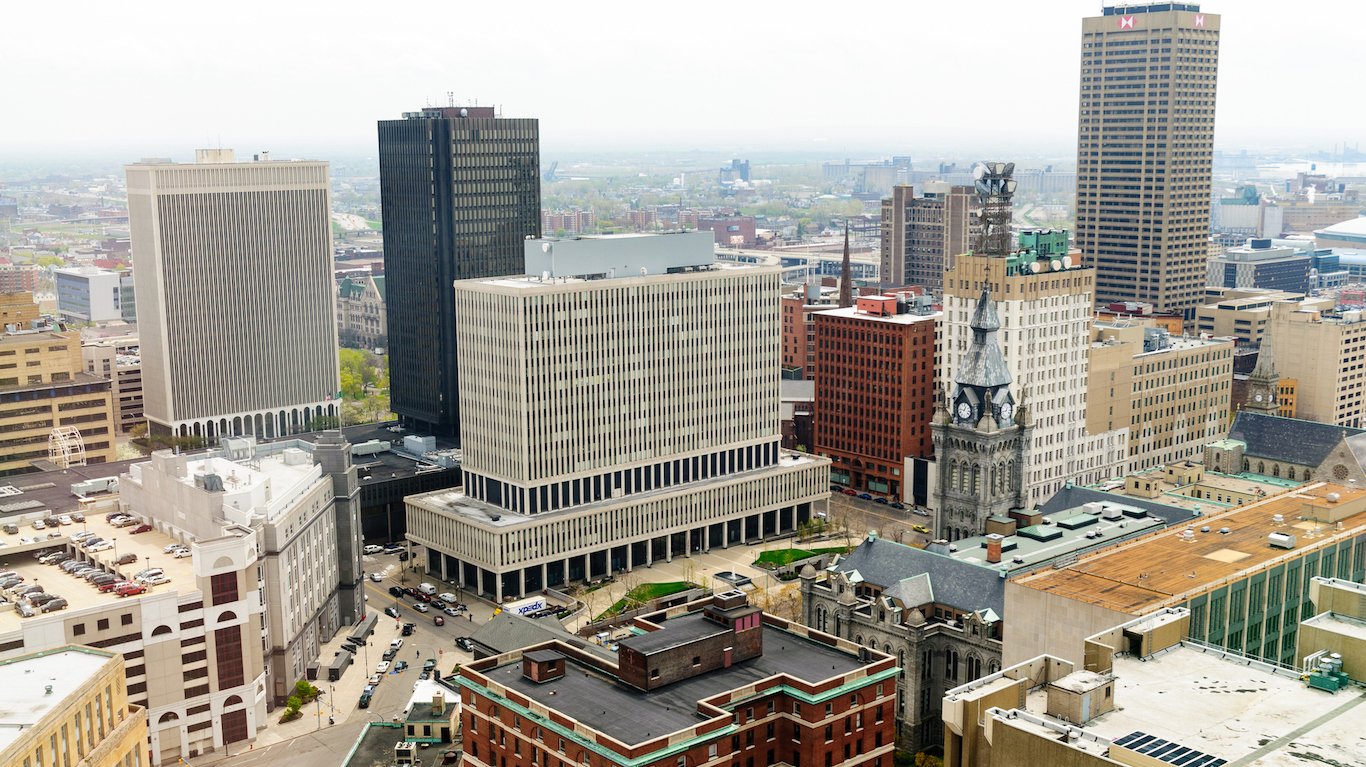
32. Buffalo-Cheektowaga-Niagara Falls, New York
> City violent crime rate: 401.8 per 100,000
> State violent crime rate: 379.7 per 100,000 (23rd highest)
> City poverty rate: 15.7%
> City unemployment rate: 4.8%
While the Buffalo-Cheektowaga-Niagara Falls metro area was once a major manufacturing center and industrial hub, years economic decline have left the city with the highest violent crime rate in New York. There were roughly 400 violent crimes reported per 100,000 Buffalo residents in 2015, more than twice the rate in several other upstate metro areas, such as Glens Falls and Kingston.
In recent years, however, Buffalo has shown signs of a major economic turnaround. New York Gov. Andrew Cuomo has committed over $1.5 billion in funding for economic development projects in the metro area as part of his “Buffalo Billion” initiative, which has attracted additional investments from solar energy, information technology, and biomedical companies. Since the revitalization project began in 2012, Buffalo’s violent crime rate has fallen by more than 10%.
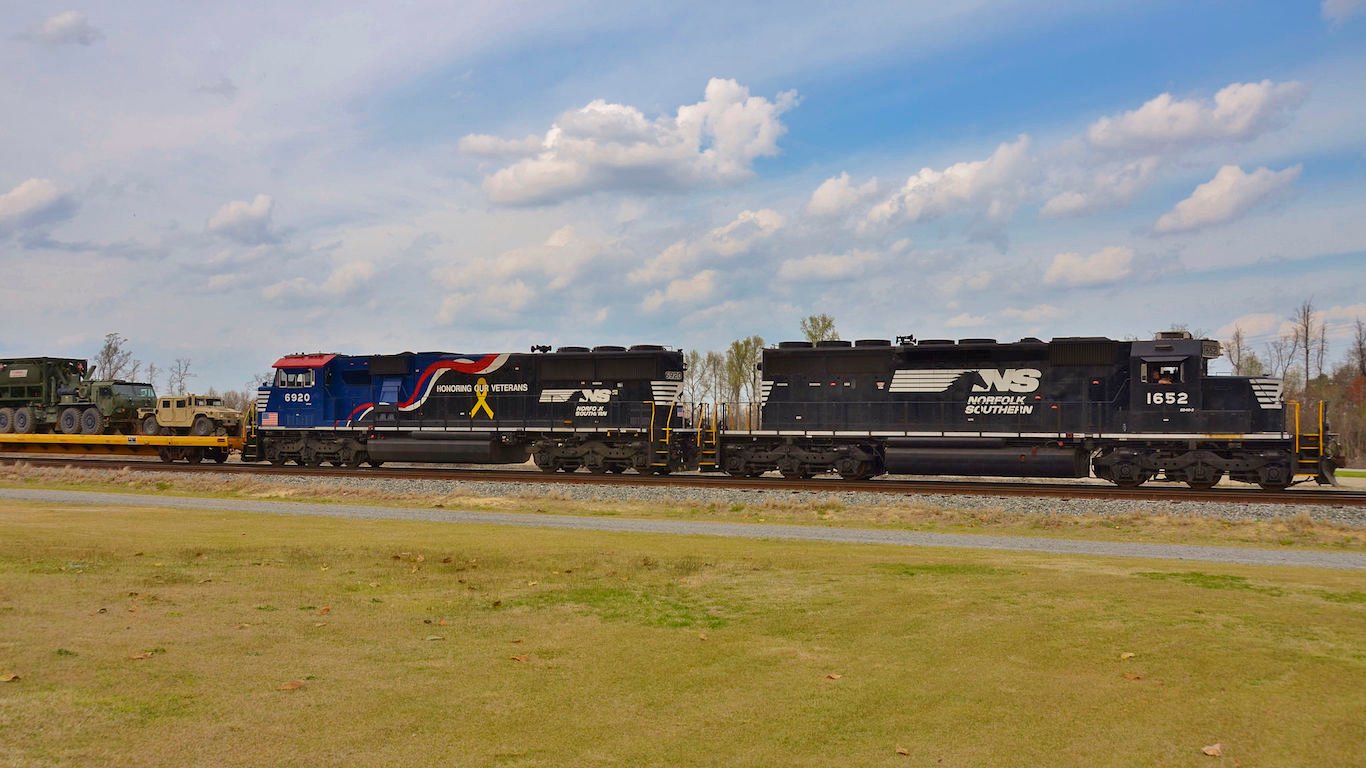
33. Goldsboro, North Carolina
> City violent crime rate: 494.3 per 100,000
> State violent crime rate: 347.0 per 100,000 (25th lowest)
> City poverty rate: 18.0%
> City unemployment rate: 5.4%
Crime has risen in Goldsboro in 2015, and the violent crime rate in the metro area has surpassed all cities in North Carolina. There were 494 violent crimes reported per 100,000 residents in 2015, an increase from 369 incidents per 100,000 in 2014 and far more than the statewide rate of 347 per 100,000.
Rampant poverty and unemployment are two of the largest contributors to crime. Goldsboro’s unemployment rate of 5.4% is the second highest in North Carolina. Close to half of all unemployed workers in Goldsboro live in poverty, which partially accounts for the high poverty rate in the city overall. Some 18.0% of Goldsboro residents live in poverty, compared to 16.4% of North Carolina residents across the state and 14.7% of Americans nationwide.

34. Fargo, North Dakota
> City violent crime rate: 249.3 per 100,000
> State violent crime rate: 239.4 per 100,000 (10th lowest)
> City poverty rate: 11.1%
> City unemployment rate: 2.5%
There is not much variance in the incidence of violent crime across North Dakota’s three metro areas tracked by the FBI. While Fargo is the most dangerous metro area in the state, it is still a relatively safe place. There were 249 violent crimes in the metro area in 2015 for every 100,000 residents, only slightly more than the violent crime rate in Bismarck, the safest metro area in the state, with 227 incidents per 100,000.
The six homicides reported in Fargo in 2015 accounted for 29% of all murders statewide, roughly in proportion with the city’s population as a percent of the total state population.
[in-text-ad-2]

35. Toledo, Ohio
> City violent crime rate: 583.6 per 100,000
> State violent crime rate: 291.9 per 100,000 (19th lowest)
> City poverty rate: 17.2%
> City unemployment rate: 4.9%
While the state of Ohio is slightly safer than the nation as a whole, not all corners of the state are devoid of danger. Toledo’s violent crime rate of 584 incidents per 100,000 people is well above the national violent crime rate of 373 per 100,000. Like in many larger U.S. cities, the situation appears to be only getting worse in Toledo. While the city proper had 24 homicides in 2015, the number jumped substantially to 38 the following year.
The prevalence of violent crime in Toledo may be partially attributable to an inadequately staffed police force. As of 2016, continuing a long standing problem, Toledo had the lowest police officer-to-citizen ratio of any large city in Ohio.
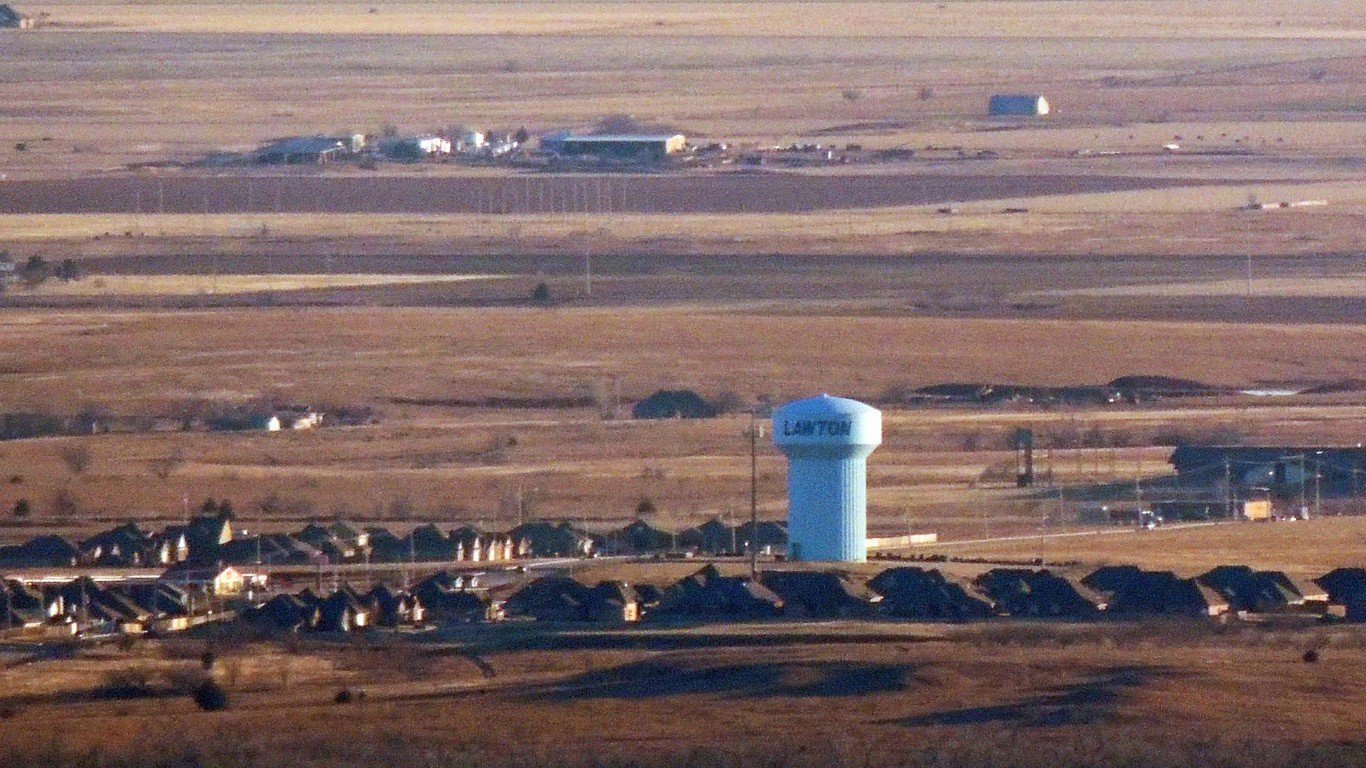
36. Lawton, Oklahoma
> City violent crime rate: 744.2 per 100,000
> State violent crime rate: 422.0 per 100,000 (14th highest)
> City poverty rate: 14.1%
> City unemployment rate: 4.3%
Despite falling roughly 27% since 2009, the violent crime rate in the Lawton metro area is the highest in Oklahoma. There were 744 violent crimes reported per 100,000 Lawton residents in 2015, far higher than the statewide rate of 422 incidents per 100,000 people and the 15th highest of any city in the country. Among the 976 violent crimes reported that year, there were 10 homicides, 214 robberies, and 691 aggravated assaults.
Individuals without a college education are less likely to find a steady, high-paying job and are ultimately more likely to break the law. Fewer than one in five adults in Lawton have a bachelor’s degree, the smallest share of any metro area in Oklahoma monitored by the FBI.
[in-text-ad]
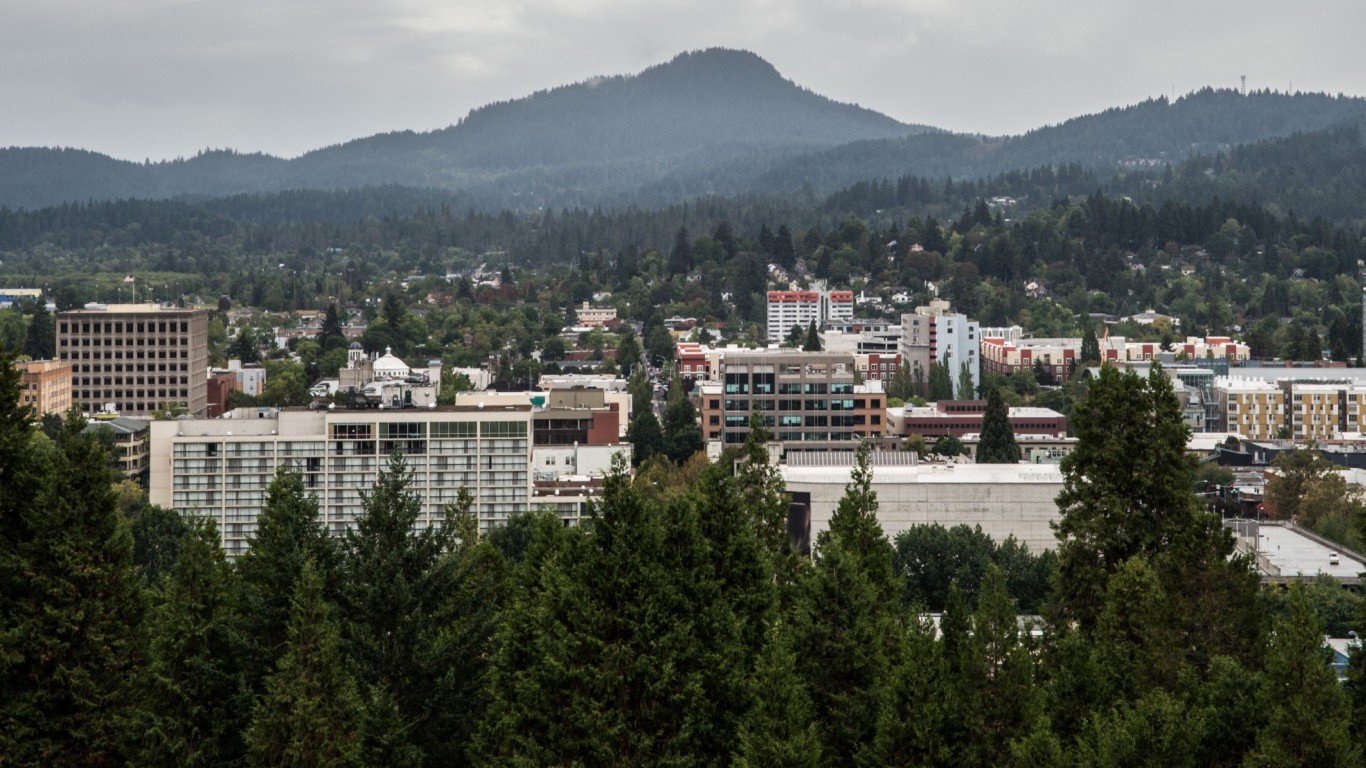
37. Eugene, Oregon
> City violent crime rate: 329.7 per 100,000
> State violent crime rate: 259.8 per 100,000 (14th lowest)
> City poverty rate: 19.4%
> City unemployment rate: 4.0%
Oregon is a relatively safe state. While Eugene is the most dangerous of Oregon’s seven metro areas monitored by the FBI, it is safer than the country as a whole. There were 330 violent crimes in Eugene in 2015 per 100,000 people, slightly below the national violent crime rate of 373 per 100,000. Aggravated assault is the most common violent crime in Eugene, followed by robbery.
Crime can be more common in economically troubled areas, and in Eugene 19.4% of residents live in poverty, a larger share than the statewide poverty rate of 15.4%.

38. Philadelphia-Camden-Wilmington, Pennsylvania
> City violent crime rate: 459.8 per 100,000
> State violent crime rate: 315.1 per 100,000 (22nd lowest)
> City poverty rate: 13.1%
> City unemployment rate: 4.5%
The fifth largest U.S. city, Philadelphia has a long history of organized crime, serial murder, and violence. The city accounts for 68% of all homicides in Pennsylvania, 81% of all robberies, and 66% of all aggravated assaults. In total, there were 460 violent crimes per 100,000 area residents in 2015, far more than the statewide rate of 315 incidents per 100,000 people.
Neighborhoods such as Kensington and Fairhill in the northeastern part of the city known as the Badlands have become major hotbeds for Philadelphia crime in recent decades. The neighborhoods are notorious for widespread drug trafficking, prostitution, light police presence, and a string of murders in 2011 committed by a serial killer referred to as the Kensington Strangler. Between 2014 and 2015, there were more than 30 homicides within roughly a half-mile radius of one Fairhill street corner.

39. Providence-Warwick, Rhode Island
> City violent crime rate: 333.7 per 100,000
> State violent crime rate: 242.5 per 100,000 (11th lowest)
> City poverty rate: 13.4%
> City unemployment rate: 4.3%
As the only metro area in Rhode Island, Providence is the most dangerous by default. Still, with 334 violent crimes for every 100,000 people, the metro is more dangerous than the state as a whole. With the exception of those in Massachusetts, it is also the most dangerous metro area in New England of those monitored by the FBI.
Last year, the city began expanding training scenarios for its now 30-member Special Response Unit. Historically, the SRU has been used in high intensity standoffs, including hostage situations and drug raids. Lately, the team’s training scenarios have been modified to prepare for the possibility of a mass shooting.
[in-text-ad-2]

40. Columbia, South Carolina
> City violent crime rate: 650.6 per 100,000
> State violent crime rate: 504.5 per 100,000 (7th highest)
> City poverty rate: 15.1%
> City unemployment rate: 4.1%
Columbia is the most dangerous metro area in a relatively dangerous state. Driven primarily by aggravated assaults, Columbia’s violent crime rate of 651 incidents per 100,000 residents is higher than any of the five other metro areas in the state and well above the nationwide violent crime rate of 373 per 100,000. While other metro areas in the state have higher murder rates, homicide is still a major problem in Columbia. Of the 56 murders in the metro area in 2015, at least one victim was an on-duty police officer.
The same year, the Columbia Police Department implemented a strategy known as Ceasefire Columbia to reduce gun violence. The program’s long-term efficacy remains to be seen.
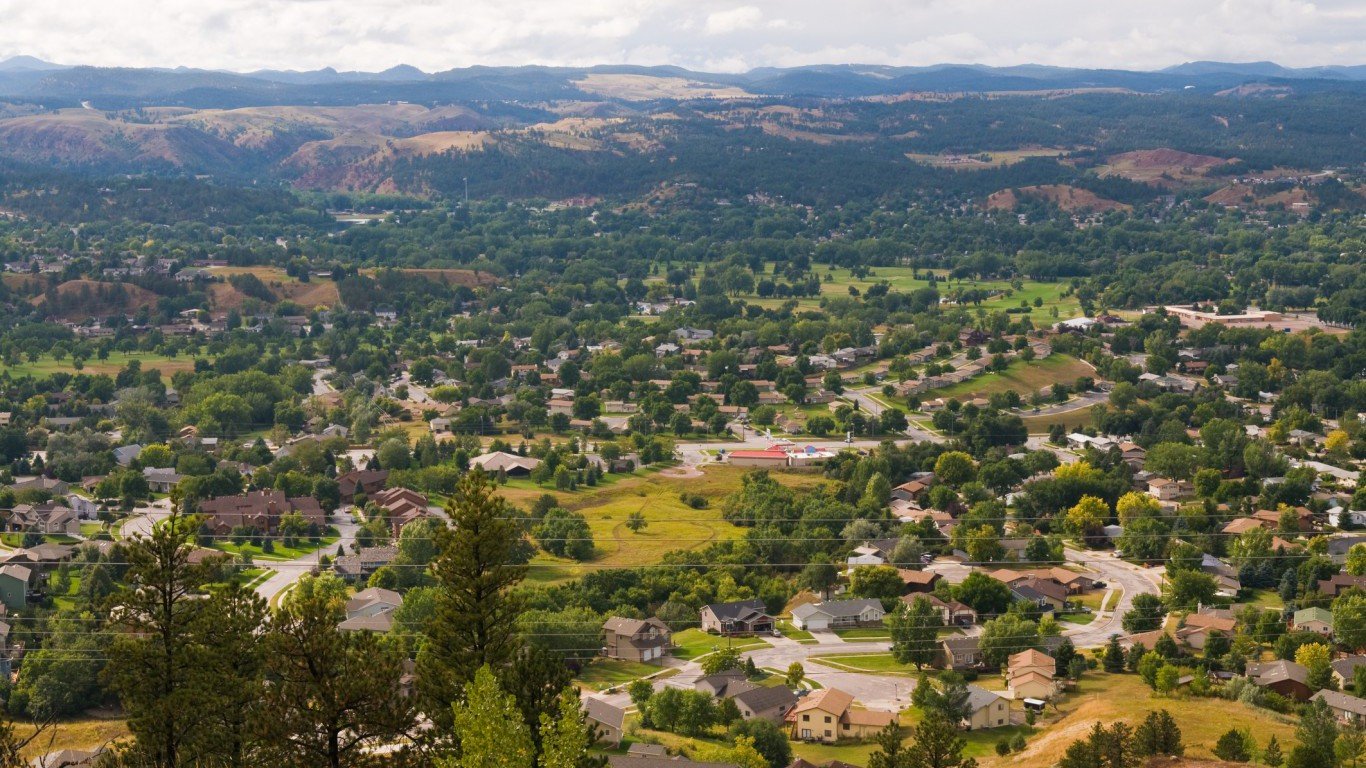
41. Rapid City, South Dakota
> City violent crime rate: 475.5 per 100,000
> State violent crime rate: 383.1 per 100,000 (22nd highest)
> City poverty rate: 10.5%
> City unemployment rate: 2.9%
There were 476 crimes reported per 100,000 Rapid City residents in 2015, roughly 30% more per capita than in Sioux Falls, the other metro area in South Dakota. Crime in the city has been increasing rapidly in recent years. There were roughly 140 more violent crimes in 2015 than the year prior. The number of murders rose from five to nine, robberies from 60 to 73, and aggravated assaults from 390 to 456.
While crime is often most prevalent in areas with high poverty and unemployment, the Rapid City economy is relatively healthy. The area’s poverty rate of 10.5% and unemployment rate of 2.9% are some of the lowest nationwide. Rapid City has the lowest unemployment rate of any metro area with a violent crime rate higher than 450 incidents per 100,000 people.
[in-text-ad]

42. Memphis, Tennessee
> City violent crime rate: 1,038.0 per 100,000
> State violent crime rate: 612.1 per 100,000 (4th highest)
> City poverty rate: 18.4%
> City unemployment rate: 5.0%
The most dangerous metro area in a relatively dangerous state, Memphis is also one of the most dangerous places in the country. Memphis is one of only four metro areas nationwide with a violent crime rate exceeding 1,000 incidents per 100,000 residents. While the metro area comprises only 20% of the Tennessee population, Memphis accounts for 38% of all homicides in the state. The metro area’s 155 homicide victims in 2015 include an active duty police officer who was shot and killed after approaching an illegally parked car.
Before taking office in January, 2016, Memphis Mayor Jim Strickland announced plans to reduce crime in the city. The initiative will include an increased police presence on the street and the enforcement of a curfew for juveniles.

43. Odessa, Texas
> City violent crime rate: 1,070.1 per 100,000
> State violent crime rate: 412.2 per 100,000 (16th highest)
> City poverty rate: 11.7%
> City unemployment rate: 5.7%
There were 1,070 violent crimes reported per 100,000 residents in Odessa in 2015, the most of any metro area in Texas and the second most of any city nationwide. Crime has skyrocketed in Odessa in recent years — it has more than doubled since 2007. The number of homicides rose from eight to in 2007 to 12 in 2015; the number of robberies rose from 104 to 201, and the number of aggravated assaults rose from 1,142 to 1,398.
People with high school and college education are more likely to find high-paying, full-time jobs and are ultimately less likely to commit a crime. More than two in three inmates in state and local prisons do not have a high school diploma. In Odessa, just 76.9% of adults have a high school diploma and 16.2% have a bachelor’s degree, each the second smallest share in Texas.

44. Salt Lake City, Utah
> City violent crime rate: 392.2 per 100,000
> State violent crime rate: 236.0 per 100,000 (9th lowest)
> City poverty rate: 10.2%
> City unemployment rate: 3.0%
Utah is one of the safest states in the country. In four of the state’s five metro areas with FBI crime data, the violent crime rate is less than half of the national figure. In Salt Lake City, however, there were 392 violent crimes reported per 100,000 residents, more than the national violent crime rate of 373 incidence per 100,000 Americans. The Salt Lake City metro area accounts for 65% of all crime in Utah.
In a recent vote, Salt Lake City leaders decided to implement a new approach to crime prevention. The City Council approved the hiring of eight social workers to assist police interacting with homeless people and the hiring of eight new bicycle-patrol police officers.
[in-text-ad-2]
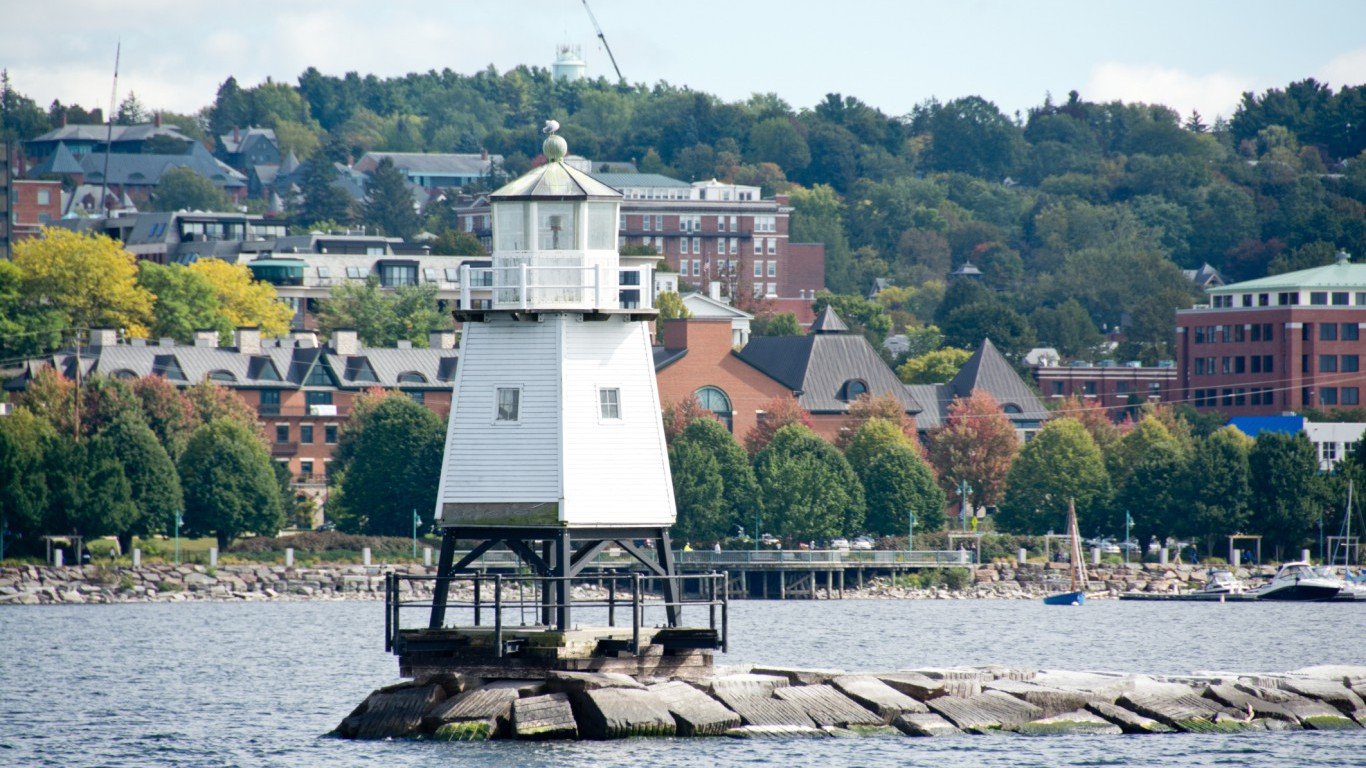
45. Burlington-South Burlington, Vermont
> City violent crime rate: 128.5 per 100,000
> State violent crime rate: 118.0 per 100,000 (the lowest)
> City poverty rate: 10.4%
> City unemployment rate: 2.5%
The only metro area in Vermont with reported FBI data, Burlington-South Burlington is the most dangerous city in the state by default. In any other state, however, Burlington would be one of the safer cities. There were 125 violent crimes reported per 100,000 Burlington residents in 2015, nearly one-third of the national crime rate of 373 incidents per 100,000 Americans and the 13th lowest of any metro area nationwide.
While Burlington has one of the lower crime rates of any U.S. city today, the metro area did experience a strong spike in robbery several years ago. In 2012, the number of robberies doubled and included three robberies that occurred over a 72-hour period. In 2015, however, there were just 22 robberies per 100,000 residents, one-fourth of the national figure.

46. Virginia Beach-Norfolk-Newport News, Virginia
> City violent crime rate: 309.3 per 100,000
> State violent crime rate: 195.6 per 100,000 (3rd lowest)
> City poverty rate: 12.3%
> City unemployment rate: 4.1%
Virginia is one of only four states with fewer than 200 violent crimes for every 100,000 people. A relatively safe state, even its most dangerous metro area, Virginia Beach, has a lower violent crime rate than the nation as a whole. There were 309 violent crimes in Virginia Beach for every 100,000 residents in 2015, well below the national violent crime rate of 373 incidents per 100,000.
Despite a low overall violent crime rate, the murder rate in Virginia beach is disproportionately high. There were 137 homicides in the area in 2015, about 8 for every 100,000 people. In comparison, the statewide murder rate is slightly less than 5 per 100,000 people.
[in-text-ad]
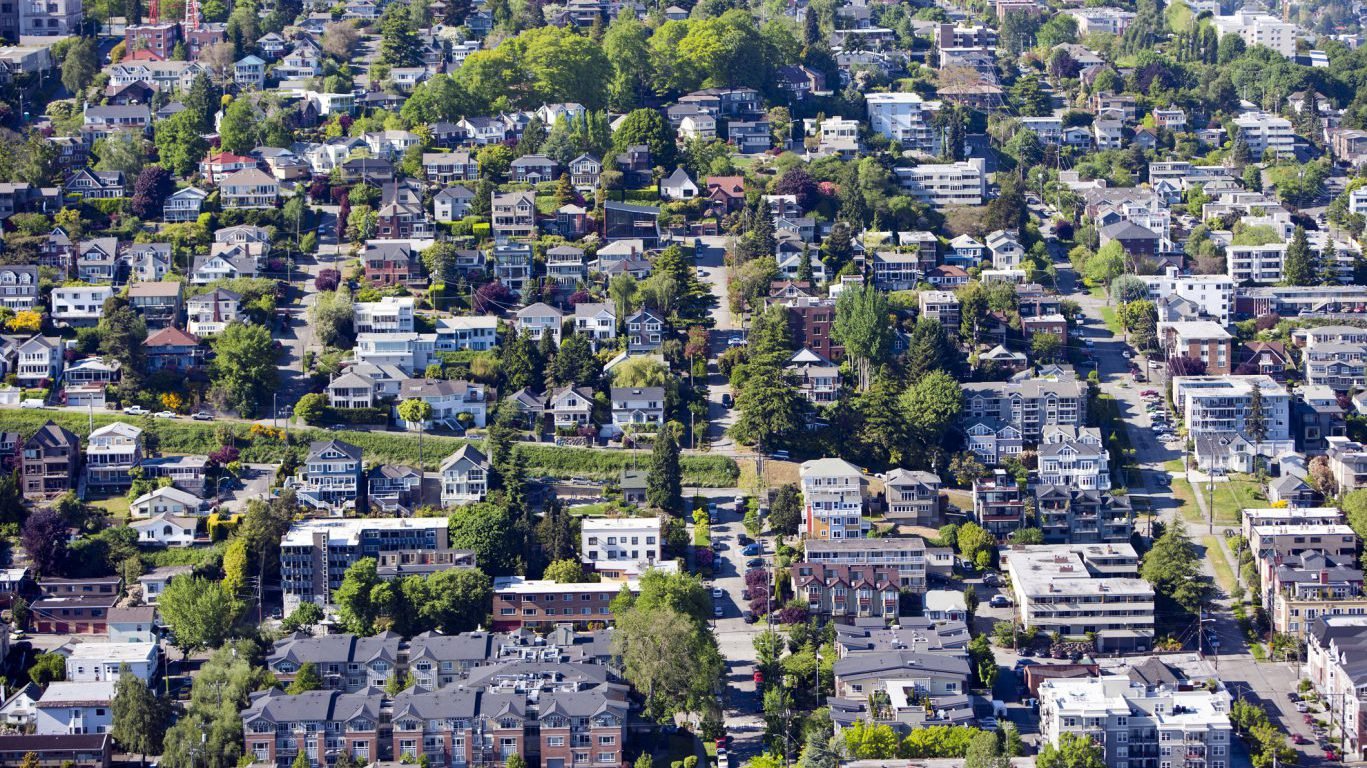
47. Seattle-Tacoma-Bellevue, Washington
> City violent crime rate: 324.1 per 100,000
> State violent crime rate: 284.4 per 100,000 (17th lowest)
> City poverty rate: 10.2%
> City unemployment rate: 3.5%
There were 324 violent crimes per 100,000 residents in the Seattle-Tacoma-Bellevue metro area in 2015. While this was the highest violent crime rate in Washington state, it was lower than the national rate of 373 incidents per 100,000 Americans. Among the 12,130 violent crimes reported were 112 murders, 3,885 robberies, and 6,952 aggravated assaults.
Crime is less likely in areas where residents have high-paying, full-time jobs and other opportunities for gainful employment. While Seattle is the most dangerous metropolitan area in Washington, the city has the most robust economy in the state. An estimated 41.2% of Seattle adults have a bachelor’s degree, the largest share of any metro area in the state. This may be one reason why just 3.5% of workers in Seattle are unemployed, the lowest unemployment rate statewide.
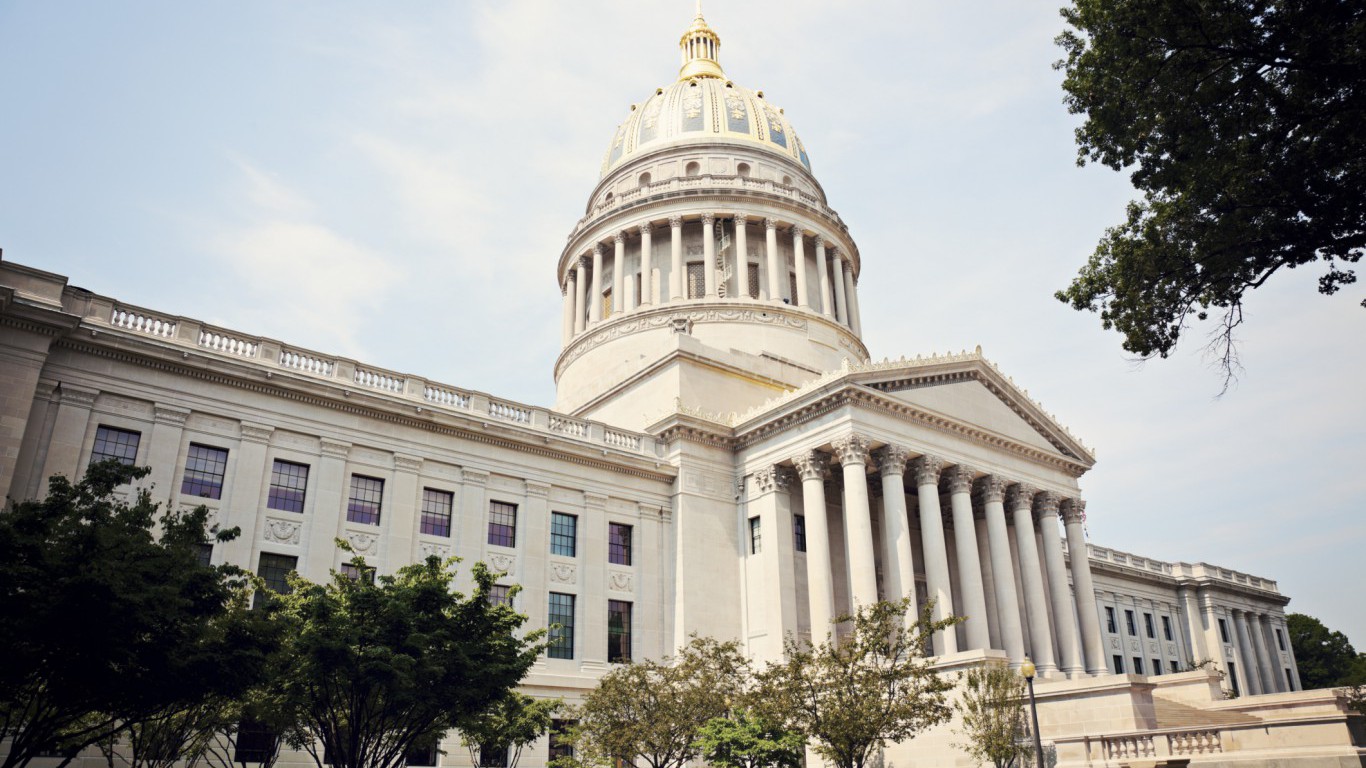
48. Charleston, West Virginia
> City violent crime rate: 530.3 per 100,000
> State violent crime rate: 337.9 per 100,000 (24th lowest)
> City poverty rate: 18.6%
> City unemployment rate: 4.8%
There were 530 violent crimes reported per 100,000 Charleston residents in 2015, the most of any metro area in West Virginia and far more than the state rate of 338 incidents per 100,000 people. Among the 1,173 violent crimes reported were 18 murders, 206 robberies, and 832 aggravated assaults.
Charleston is one of the cities hit hardest by the opioid epidemic. While drug use is a nonviolent crime, addicts in need of money may engage in criminal activity. Many believe the rising heroin usage has led to an increase in crime in the city. Motor vehicle theft has also increased substantially. There were 619 reported motor vehicle thefts in Charleston in 2015, an increase of more than 200 automobiles from the prior year.

49. Milwaukee-Waukesha-West Allis, Wisconsin
> City violent crime rate: 680.1 per 100,000
> State violent crime rate: 305.8 per 100,000 (21st lowest)
> City poverty rate: 14.0%
> City unemployment rate: 3.5%
Milwaukee is one of only a handful of metro areas with a violent crime rate that is more than double its home state rate. Driven largely by aggravated assault and robbery, there were 680 violent crimes in Milwaukee for every 100,000 metro area residents in 2015, compared to Wisconsin’s below average rate of 306 per 100,000.
Homicide also contributed to Milwaukee’s violent crime rate more than is typical. There were 155 murders in the city in 2015, or a murder rate of 9.8 per 100,000 people — well above the 4.9 per 100,000 national murder rate and 4.2 per 100,000 statewide rate. As was the case in many cities on this list, 2015 was an especially bad year for the Midwestern city. In the first 10 months of the year alone, 2015 became the city’s deadliest year in a decade.
[in-text-ad-2]
50. Casper, Wyoming
> City violent crime rate: 234.3 per 100,000
> State violent crime rate: 222.1 per 100,000 (8th lowest)
> City poverty rate: 11.6%
> City unemployment rate: 5.9%
Wyoming has one of the lowest violent crime rates of any states. Even Casper, the most dangerous metro area in the state, is considerably safer than the nation as a whole. There were 234 violent crimes in Casper for every 100,000 residents in 2015, well below the national violent crime rate of 373 incidents per 100,000.
The least populated state in the country, Wyoming had only 16 murders in 2015, fewer than a majority of cities on this list. Similarly, Casper was one of three cities on this list to report a single murder in 2015.
Detailed Findings and Methodology
Violent crime, as defined by the FBI, consists of four distinct categories: aggravated assault, robbery, rape, and murder. While murders tend to receive the most press coverage, they are far less common than the other types of violent crime. Nationwide, and in every metro area on this list, aggravated assault is the most common form of violent crime. There were 238 aggravated assaults in 2015 for every 100,000 Americans in 2015. In comparison, there were only five homicides for every 100,000 people the same year.
However, murder rates were up over 10% in the U.S. in 2015, and many cities on this list reported a record number of homicides that year. For example, Louisville, the most dangerous metro area in Kentucky, reported 96 total murders in 2015 — its deadliest year in decades. Similarly, the 344 murders reported in Baltimore, Maryland’s most dangerous city, marked a 63% increase over the previous year — and the highest body count in the city since 1993.
What drives violent crime is not entirely clear, nor is it the same from one city to another. The opioid epidemic, which lawmakers and even the White House have targeted lately as a serious crisis, is likely contributing to increased violence. On a local level, explanations are more nuanced. For example, in Pueblo, the most dangerous metro area in Colorado, gang-related violence is largely to blame for a high violent crime rate. Meanwhile, Baltimore city officials theorize the increase in violent crime was fueled by civil unrest following the death of Freddie Gray while in police custody.
Many cities on this list are taking active measures to combat relatively high violent crime rates. A number of cities on this list, including Memphis, Tennessee and Tallahassee, Florida have street-level visibility of police officers.
Other cities on this list, including Philadelphia, Pennsylvania and Louisville, Kentucky partially attribute their high violent crime rate to limited police resources.
Just because a given metro area has the highest violent crime rate in its respective state does not necessarily mean it is especially dangerous. Of the 50 metro areas on this list, 15 have a lower violent crime rate than the national rate of 373 incidents per 100,000 people. The majority of those cities are in states with similarly low violent crime rates.
To identify the most dangerous city in each state, 24/7 Wall St. reviewed violent crime rate data for the 347 metropolitan statistical areas reviewed in the FBI’s 2015 Uniform Crime Report. The total number and rates of murder, nonnegligent manslaughter, rape, robbery, and aggravated assault, which are included in the violent crime rate, as well as burglaries, larceny, motor vehicle theft, and arson — all classified as property crime — also came from the FBI’s report. We also considered these data for each year from 2011 through 2015. Unemployment rates for March 2017 came from the Bureau of Labor Statistics (BLS). Poverty rates, the percentage of adults with at least a bachelor’s degree, and the percentage of adults with at least a high school diploma came from the U.S. Census Bureau’s American Community Survey (ACS) and are for 2015.
Ever wanted an extra set of eyes on an investment you’re considering? Now you can speak with up to 3 financial experts in your area for FREE. By simply
clicking here you can begin to match with financial professionals who can help guide you through the financial decisions you’re making. And the best part? The first conversation with them is free.
Click here to match with up to 3 financial pros who would be excited to help you make financial decisions.
Thank you for reading! Have some feedback for us?
Contact the 24/7 Wall St. editorial team.


 24/7 Wall St.
 24/7 Wall St.
 24/7 Wall St.
 24/7 Wall St.