Special Report
States Where the Most People Work for the Government

Published:
Last Updated:
Despite consistent urging from a portion of the American public to slim down government, a large number of residents continue to make a living by working in government. In 2016, more than 3 out of every 20 American jobs involved working for the federal, state, or local government. Not all states, however, have the same concentration of government jobs. In fact, the percentages vary greatly across the country.
24/7 Wall St. reviewed the number of government positions as a share of the total number of jobs in each state using data from the Bureau of Labor Statistics (BLS). Nationally, 15.4% of the workforce is employed by the government.
In the state with the largest concentration of government workers, that share shoots up to 25.4%. This is the only state to cross the 25% threshold. On the other end of the spectrum, the portion of the workforce that is in government falls as low as 12% in one state.
Click here to see the states where the most people work for the government.
Click here to see the detailed findings.
Click here to see the methodology.
These are the states with the most and least government workers.
Correction: Due to a transcription error, the number of government employees was incorrect in a previous version of this article. The error has been corrected.

50. Pennsylvania
> Gov’t jobs, 2016: 12.0%
> Gov’t employment, 2016: 704,000 (9th highest)
> Gov’t jobs, 2006: 13.1% (2nd lowest)
> Gov’t employment chg. (2006-2016): -6.8% (3rd lowest)
[in-text-ad]

49. Nevada
> Gov’t jobs, 2016: 12.1%
> Gov’t employment, 2016: 158,000 (14th lowest)
> Gov’t jobs, 2006: 11.7% (the lowest)
> Gov’t employment chg. (2006-2016): 5.6% (17th highest)
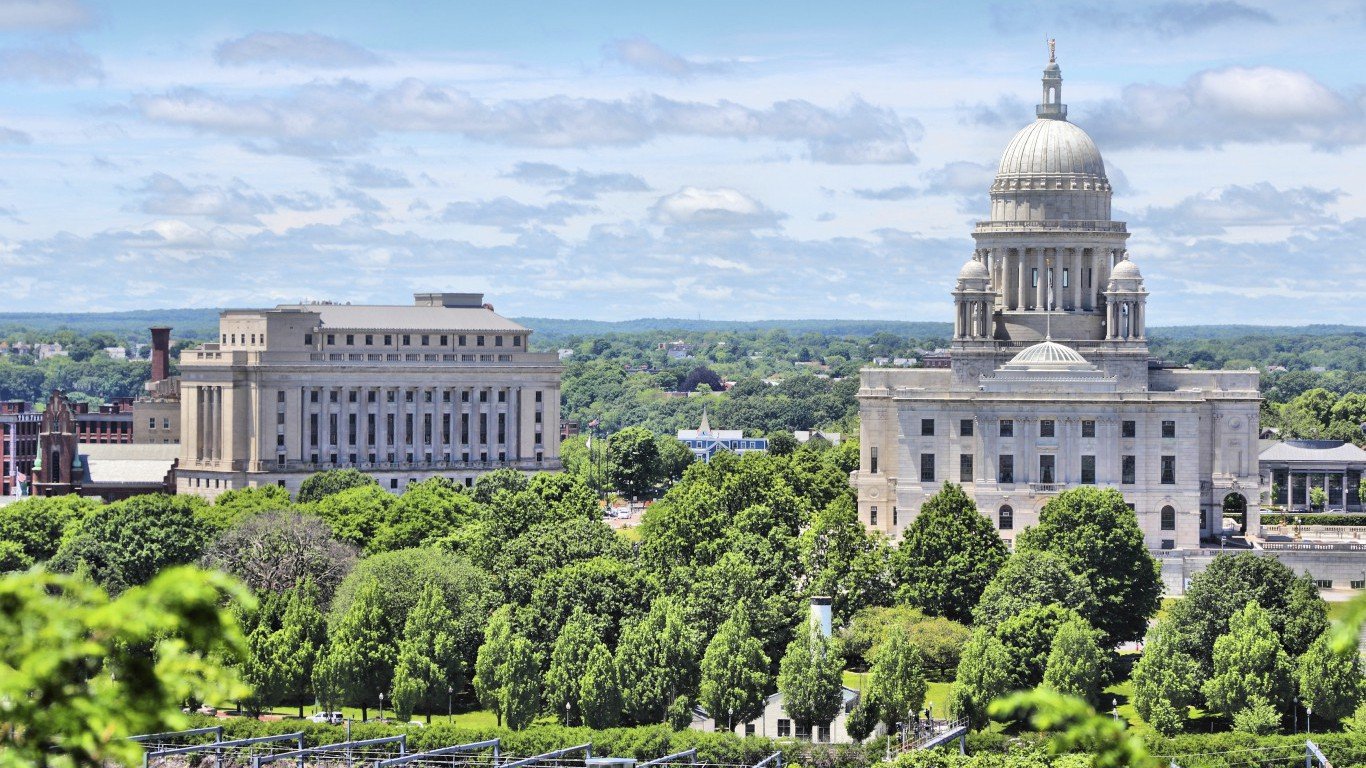
48. Rhode Island
> Gov’t jobs, 2016: 12.3%
> Gov’t employment, 2016: 61,000 (2nd lowest)
> Gov’t jobs, 2006: 13.2% (4th lowest)
> Gov’t employment chg. (2006-2016): -6.8% (2nd lowest)

47. Massachusetts
> Gov’t jobs, 2016: 12.8%
> Gov’t employment, 2016: 456,000 (15th highest)
> Gov’t jobs, 2006: 13.1% (3rd lowest)
> Gov’t employment chg. (2006-2016): 6.2% (13th highest)
[in-text-ad-2]

46. Florida
> Gov’t jobs, 2016: 13.1%
> Gov’t employment, 2016: 1,095,000 (4th highest)
> Gov’t jobs, 2006: 13.8% (5th lowest)
> Gov’t employment chg. (2006-2016): -0.4% (14th lowest)
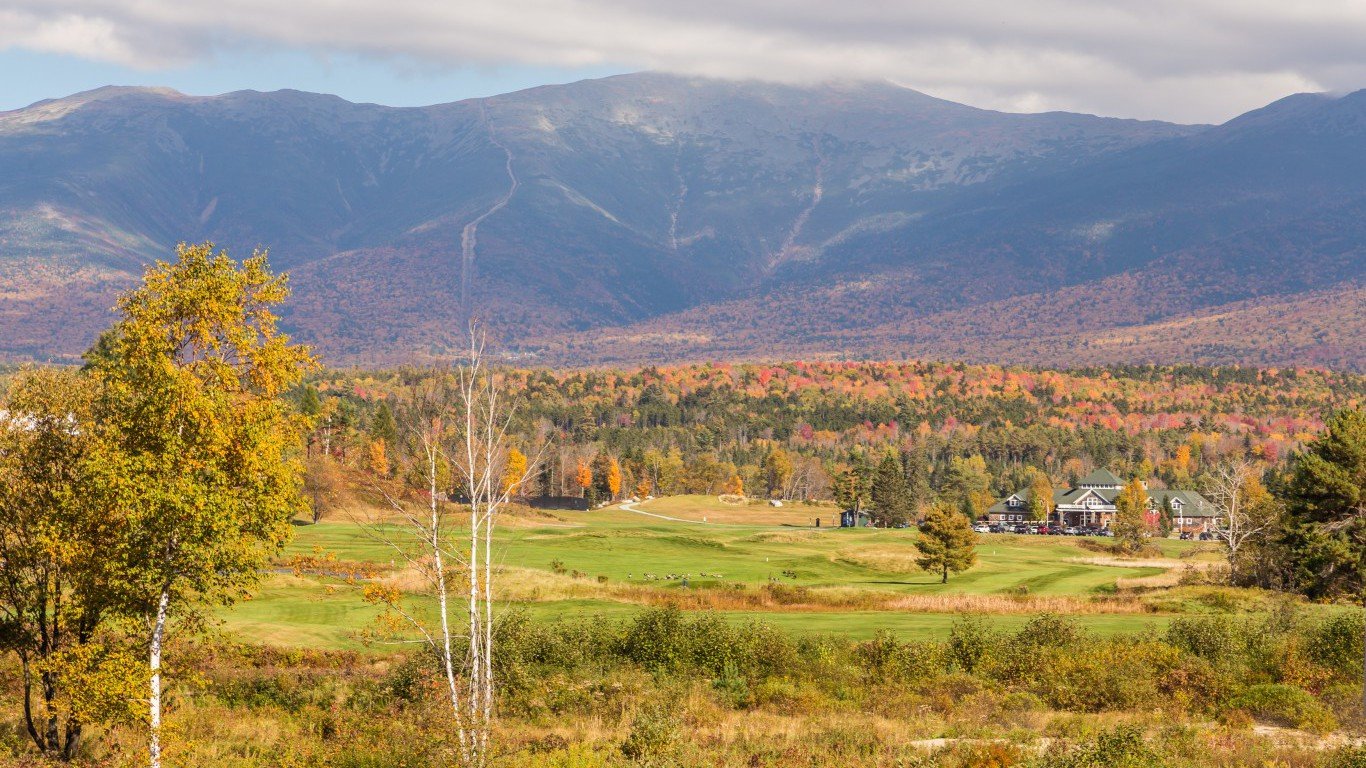
45. New Hampshire
> Gov’t jobs, 2016: 13.6%
> Gov’t employment, 2016: 91,000 (8th lowest)
> Gov’t jobs, 2006: 14.4% (9th lowest)
> Gov’t employment chg. (2006-2016): -1.5% (12th lowest)
[in-text-ad]

44. Illinois
> Gov’t jobs, 2016: 13.8%
> Gov’t employment, 2016: 829,000 (5th highest)
> Gov’t jobs, 2006: 14.3% (7th lowest)
> Gov’t employment chg. (2006-2016): -1.9% (11th lowest)

43. Michigan
> Gov’t jobs, 2016: 13.9%
> Gov’t employment, 2016: 601,000 (12th highest)
> Gov’t jobs, 2006: 15.4% (15th lowest)
> Gov’t employment chg. (2006-2016): -9.7% (the lowest)

42. Indiana
> Gov’t jobs, 2016: 13.9%
> Gov’t employment, 2016: 429,000 (17th highest)
> Gov’t jobs, 2006: 14.3% (8th lowest)
> Gov’t employment chg. (2006-2016): 0.6% (19th lowest)
[in-text-ad-2]

41. Connecticut
> Gov’t jobs, 2016: 14.1%
> Gov’t employment, 2016: 236,000 (18th lowest)
> Gov’t jobs, 2006: 14.8% (12th lowest)
> Gov’t employment chg. (2006-2016): -4.8% (6th lowest)

40. Wisconsin
> Gov’t jobs, 2016: 14.1%
> Gov’t employment, 2016: 413,000 (21st highest)
> Gov’t jobs, 2006: 14.5% (10th lowest)
> Gov’t employment chg. (2006-2016): -0.7% (13th lowest)
[in-text-ad]
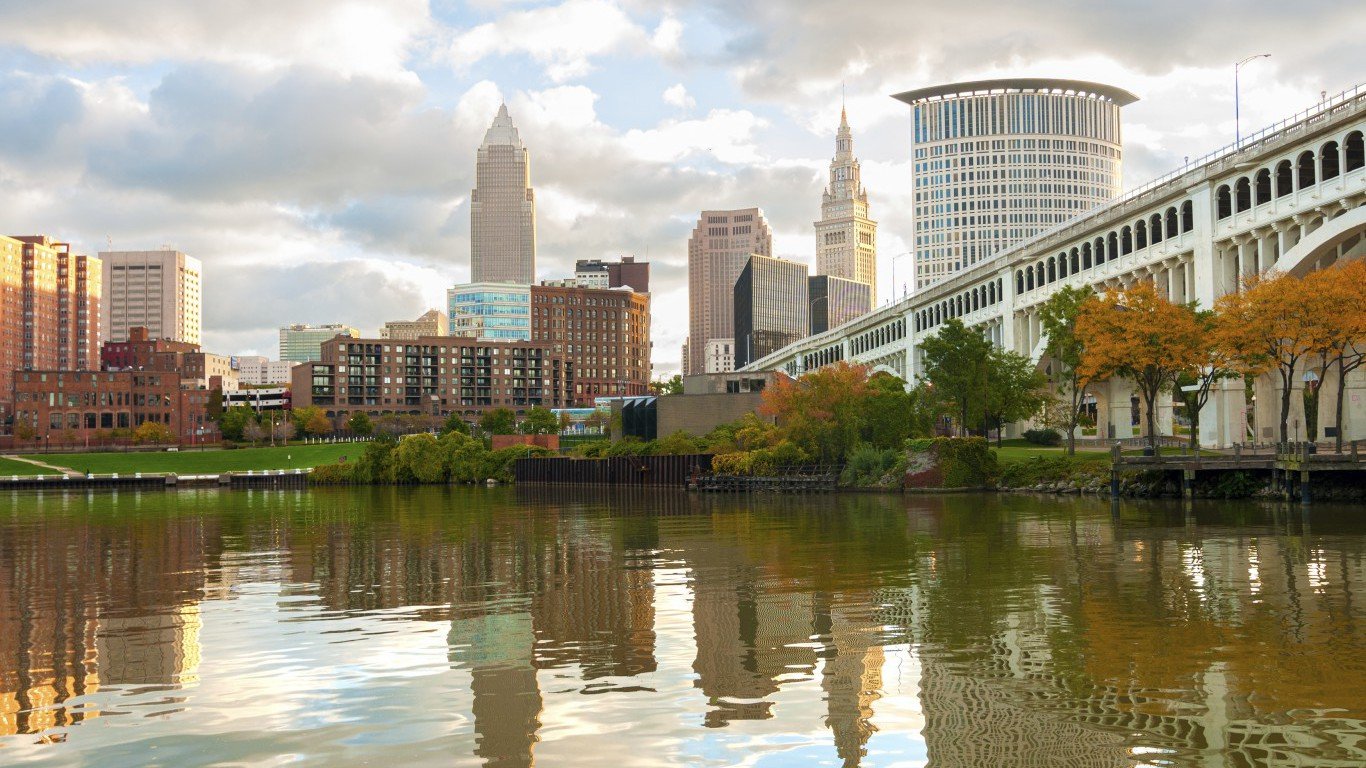
39. Ohio
> Gov’t jobs, 2016: 14.2%
> Gov’t employment, 2016: 777,000 (6th highest)
> Gov’t jobs, 2006: 14.7% (11th lowest)
> Gov’t employment chg. (2006-2016): -2.9% (9th lowest)

38. Tennessee
> Gov’t jobs, 2016: 14.4%
> Gov’t employment, 2016: 428,000 (18th highest)
> Gov’t jobs, 2006: 14.9% (13th lowest)
> Gov’t employment chg. (2006-2016): 3.2% (25th highest)

37. Delaware
> Gov’t jobs, 2016: 14.4%
> Gov’t employment, 2016: 65,000 (3rd lowest)
> Gov’t jobs, 2006: 13.9% (6th lowest)
> Gov’t employment chg. (2006-2016): 7.0% (11th highest)
[in-text-ad-2]

36. Minnesota
> Gov’t jobs, 2016: 14.6%
> Gov’t employment, 2016: 424,000 (20th highest)
> Gov’t jobs, 2006: 15.1% (14th lowest)
> Gov’t employment chg. (2006-2016): 1.9% (21st lowest)

35. New Jersey
> Gov’t jobs, 2016: 15.1%
> Gov’t employment, 2016: 614,000 (11th highest)
> Gov’t jobs, 2006: 15.9% (18th lowest)
> Gov’t employment chg. (2006-2016): -5.3% (5th lowest)
[in-text-ad]

34. Arizona
> Gov’t jobs, 2016: 15.2%
> Gov’t employment, 2016: 411,000 (22nd highest)
> Gov’t jobs, 2006: 15.5% (16th lowest)
> Gov’t employment chg. (2006-2016): 0.6% (18th lowest)

33. California
> Gov’t jobs, 2016: 15.3%
> Gov’t employment, 2016: 2,515,000 (the highest)
> Gov’t jobs, 2006: 16.0% (19th lowest)
> Gov’t employment chg. (2006-2016): 2.5% (25th lowest)
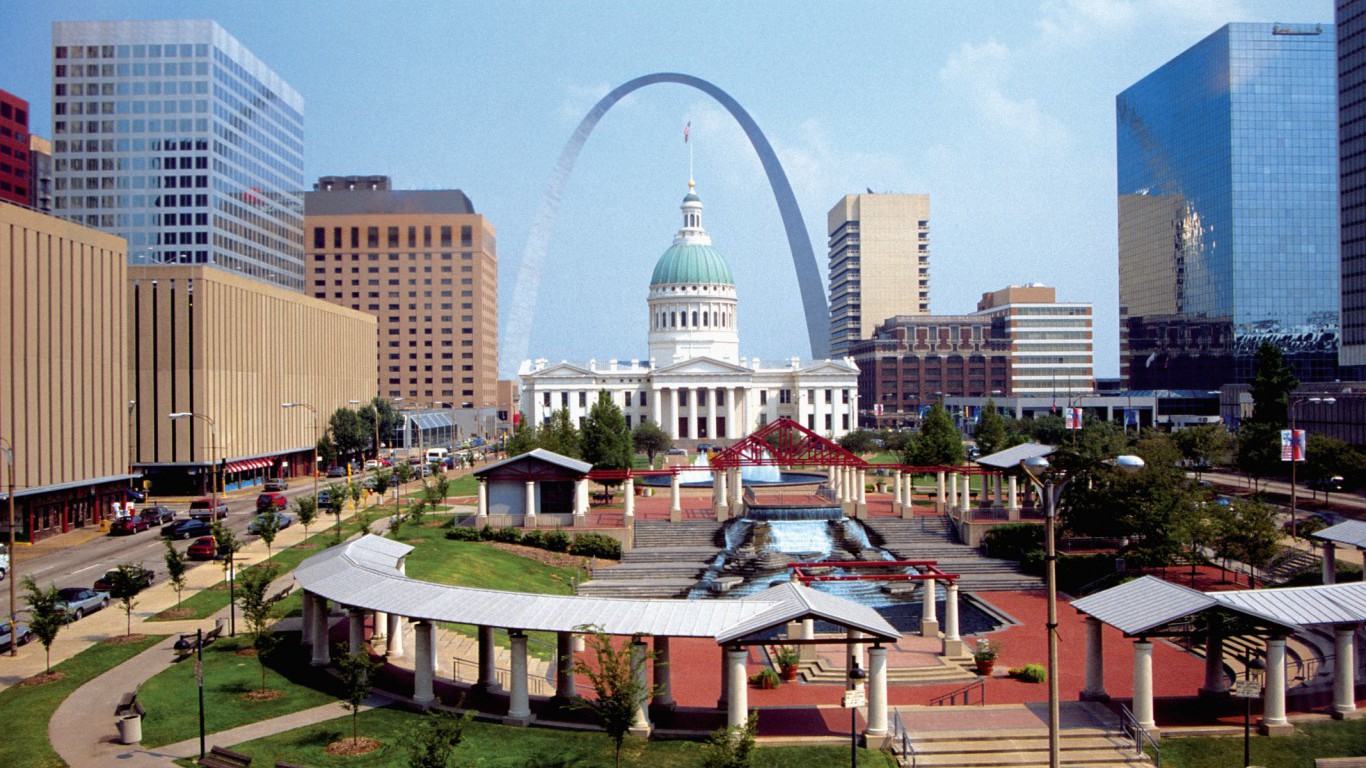
32. Missouri
> Gov’t jobs, 2016: 15.3%
> Gov’t employment, 2016: 434,000 (16th highest)
> Gov’t jobs, 2006: 15.6% (17th lowest)
> Gov’t employment chg. (2006-2016): 0.0% (15th lowest)
[in-text-ad-2]

31. New York
> Gov’t jobs, 2016: 15.4%
> Gov’t employment, 2016: 1,447,000 (3rd highest)
> Gov’t jobs, 2006: 17.3% (21st highest)
> Gov’t employment chg. (2006-2016): -2.6% (10th lowest)

30. Georgia
> Gov’t jobs, 2016: 15.7%
> Gov’t employment, 2016: 686,000 (10th highest)
> Gov’t jobs, 2006: 16.5% (22nd lowest)
> Gov’t employment chg. (2006-2016): 0.9% (20th lowest)
[in-text-ad]

29. Texas
> Gov’t jobs, 2016: 16.0%
> Gov’t employment, 2016: 1,924,000 (2nd highest)
> Gov’t jobs, 2006: 17.2% (22nd highest)
> Gov’t employment chg. (2006-2016): 10.9% (3rd highest)

28. Maine
> Gov’t jobs, 2016: 16.2%
> Gov’t employment, 2016: 100,000 (10th lowest)
> Gov’t jobs, 2006: 17.0% (25th lowest)
> Gov’t employment chg. (2006-2016): -4.1% (7th lowest)

27. Colorado
> Gov’t jobs, 2016: 16.4%
> Gov’t employment, 2016: 426,000 (19th highest)
> Gov’t jobs, 2006: 16.1% (20th lowest)
> Gov’t employment chg. (2006-2016): 16.1% (2nd highest)
[in-text-ad-2]
26. Iowa
> Gov’t jobs, 2016: 16.4%
> Gov’t employment, 2016: 258,000 (22nd lowest)
> Gov’t jobs, 2006: 16.4% (21st lowest)
> Gov’t employment chg. (2006-2016): 4.4% (20th highest)

25. Louisiana
> Gov’t jobs, 2016: 16.5%
> Gov’t employment, 2016: 325,000 (25th lowest)
> Gov’t jobs, 2006: 18.8% (12th highest)
> Gov’t employment chg. (2006-2016): -6.5% (4th lowest)
[in-text-ad]

24. Kentucky
> Gov’t jobs, 2016: 16.6%
> Gov’t employment, 2016: 319,000 (24th lowest)
> Gov’t jobs, 2006: 16.6% (23rd lowest)
> Gov’t employment chg. (2006-2016): 4.4% (21st highest)

23. Utah
> Gov’t jobs, 2016: 16.7%
> Gov’t employment, 2016: 238,000 (19th lowest)
> Gov’t jobs, 2006: 17.0% (25th highest)
> Gov’t employment chg. (2006-2016): 16.4% (the highest)
22. North Carolina
> Gov’t jobs, 2016: 16.7%
> Gov’t employment, 2016: 727,000 (7th highest)
> Gov’t jobs, 2006: 17.0% (24th highest)
> Gov’t employment chg. (2006-2016): 5.7% (16th highest)
[in-text-ad-2]

21. Oregon
> Gov’t jobs, 2016: 16.8%
> Gov’t employment, 2016: 307,000 (23rd lowest)
> Gov’t jobs, 2006: 16.8% (24th lowest)
> Gov’t employment chg. (2006-2016): 7.3% (8th highest)
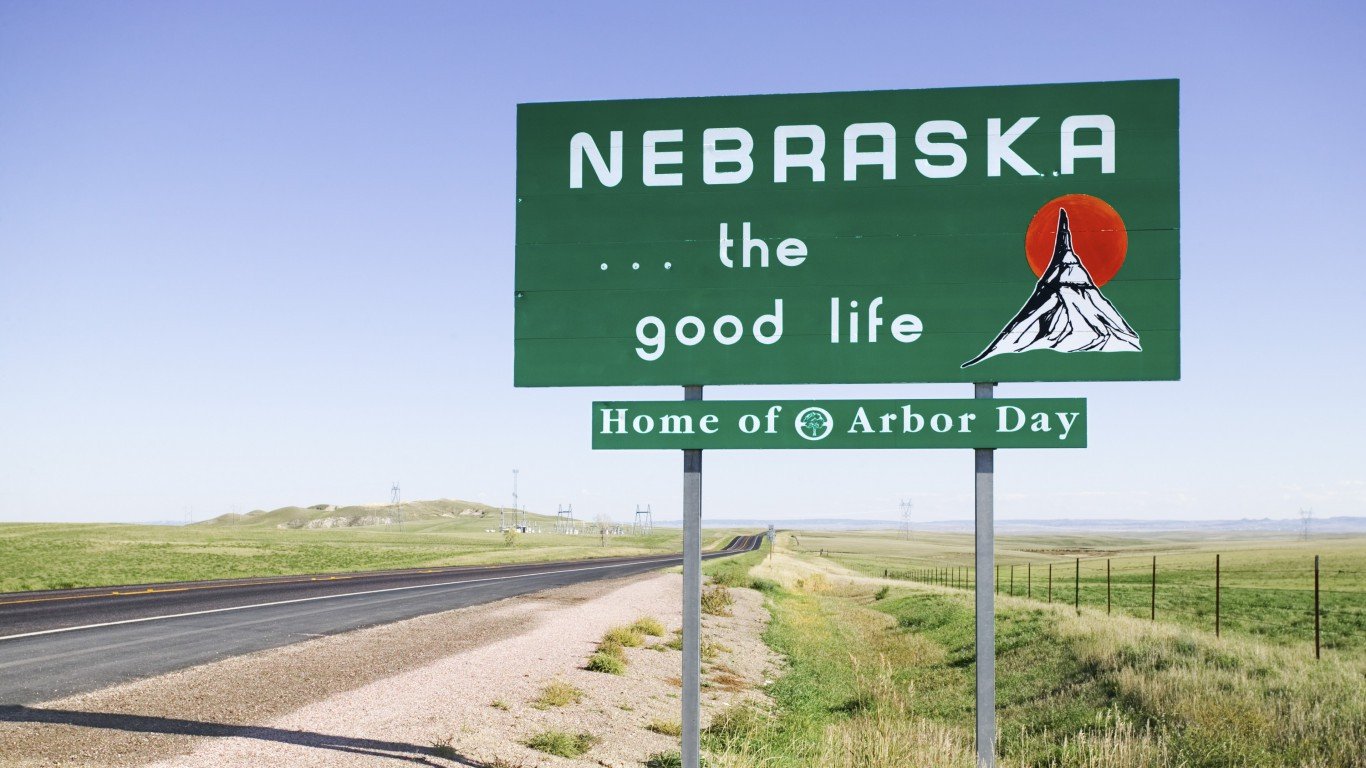
20. Nebraska
> Gov’t jobs, 2016: 17.0%
> Gov’t employment, 2016: 172,000 (15th lowest)
> Gov’t jobs, 2006: 17.2% (23rd highest)
> Gov’t employment chg. (2006-2016): 6.1% (14th highest)
[in-text-ad]

19. Arkansas
> Gov’t jobs, 2016: 17.3%
> Gov’t employment, 2016: 212,000 (17th lowest)
> Gov’t jobs, 2006: 17.3% (20th highest)
> Gov’t employment chg. (2006-2016): 2.3% (23rd lowest)

18. Idaho
> Gov’t jobs, 2016: 17.5%
> Gov’t employment, 2016: 122,000 (11th lowest)
> Gov’t jobs, 2006: 18.2% (15th highest)
> Gov’t employment chg. (2006-2016): 4.7% (18th highest)

17. Washington
> Gov’t jobs, 2016: 17.7%
> Gov’t employment, 2016: 573,000 (13th highest)
> Gov’t jobs, 2006: 18.3% (14th highest)
> Gov’t employment chg. (2006-2016): 8.1% (6th highest)
[in-text-ad-2]

16. South Carolina
> Gov’t jobs, 2016: 17.7%
> Gov’t employment, 2016: 364,000 (24th highest)
> Gov’t jobs, 2006: 17.8% (18th highest)
> Gov’t employment chg. (2006-2016): 7.2% (10th highest)

15. Vermont
> Gov’t jobs, 2016: 17.9%
> Gov’t employment, 2016: 56,000 (the lowest)
> Gov’t jobs, 2006: 17.5% (19th highest)
> Gov’t employment chg. (2006-2016): 4.1% (23rd highest)
[in-text-ad]

14. Kansas
> Gov’t jobs, 2016: 18.2%
> Gov’t employment, 2016: 256,000 (21st lowest)
> Gov’t jobs, 2006: 18.8% (11th highest)
> Gov’t employment chg. (2006-2016): 0.6% (17th lowest)
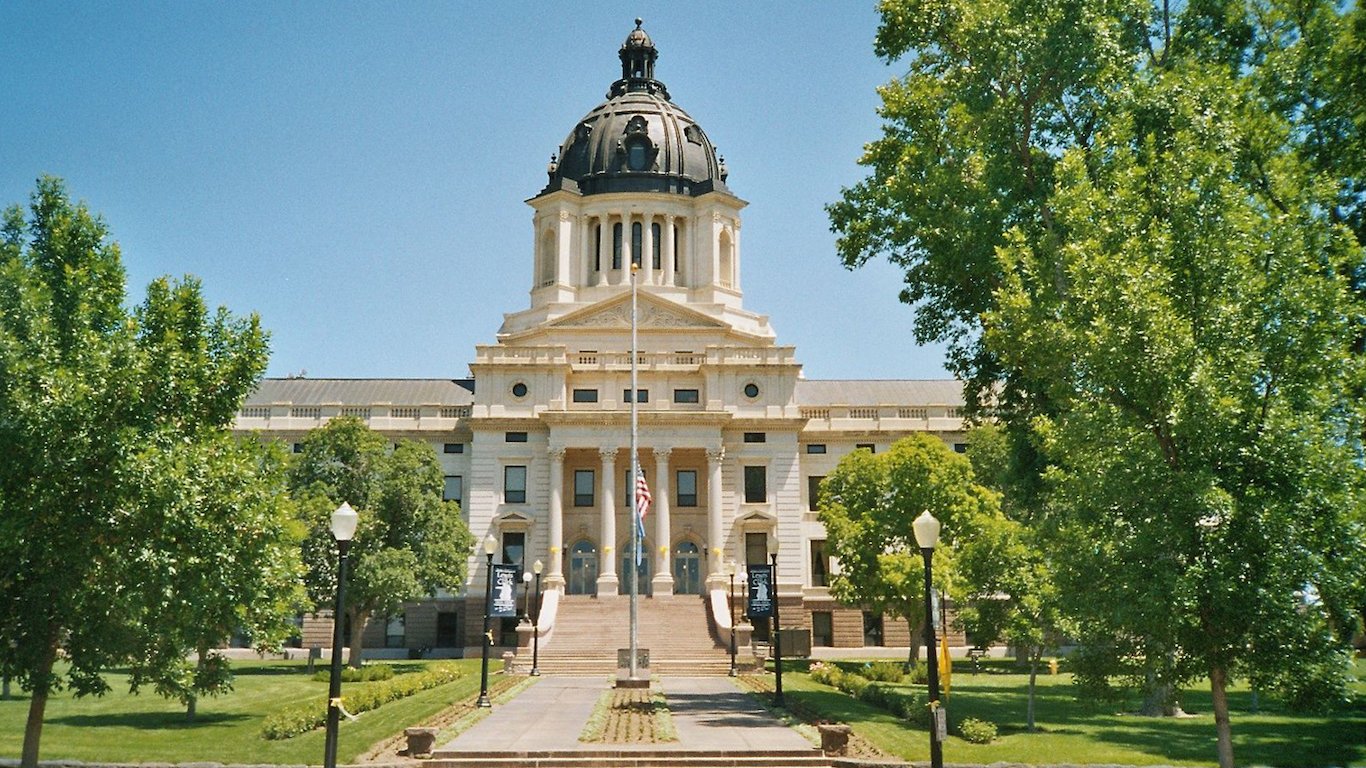
13. South Dakota
> Gov’t jobs, 2016: 18.2%
> Gov’t employment, 2016: 79,000 (5th lowest)
> Gov’t jobs, 2006: 18.9% (10th highest)
> Gov’t employment chg. (2006-2016): 4.5% (19th highest)
12. Virginia
> Gov’t jobs, 2016: 18.2%
> Gov’t employment, 2016: 714,000 (8th highest)
> Gov’t jobs, 2006: 18.1% (17th highest)
> Gov’t employment chg. (2006-2016): 5.9% (15th highest)
[in-text-ad-2]

11. Maryland
> Gov’t jobs, 2016: 18.6%
> Gov’t employment, 2016: 504,000 (14th highest)
> Gov’t jobs, 2006: 18.2% (16th highest)
> Gov’t employment chg. (2006-2016): 6.9% (12th highest)
10. North Dakota
> Gov’t jobs, 2016: 19.2%
> Gov’t employment, 2016: 83,000 (7th lowest)
> Gov’t jobs, 2006: 21.4% (4th highest)
> Gov’t employment chg. (2006-2016): 10.3% (4th highest)
[in-text-ad]

9. Alabama
> Gov’t jobs, 2016: 19.2%
> Gov’t employment, 2016: 379,000 (23rd highest)
> Gov’t jobs, 2006: 18.7% (13th highest)
> Gov’t employment chg. (2006-2016): 2.5% (24th lowest)

8. Hawaii
> Gov’t jobs, 2016: 19.5%
> Gov’t employment, 2016: 126,000 (12th lowest)
> Gov’t jobs, 2006: 19.7% (8th highest)
> Gov’t employment chg. (2006-2016): 4.1% (22nd highest)
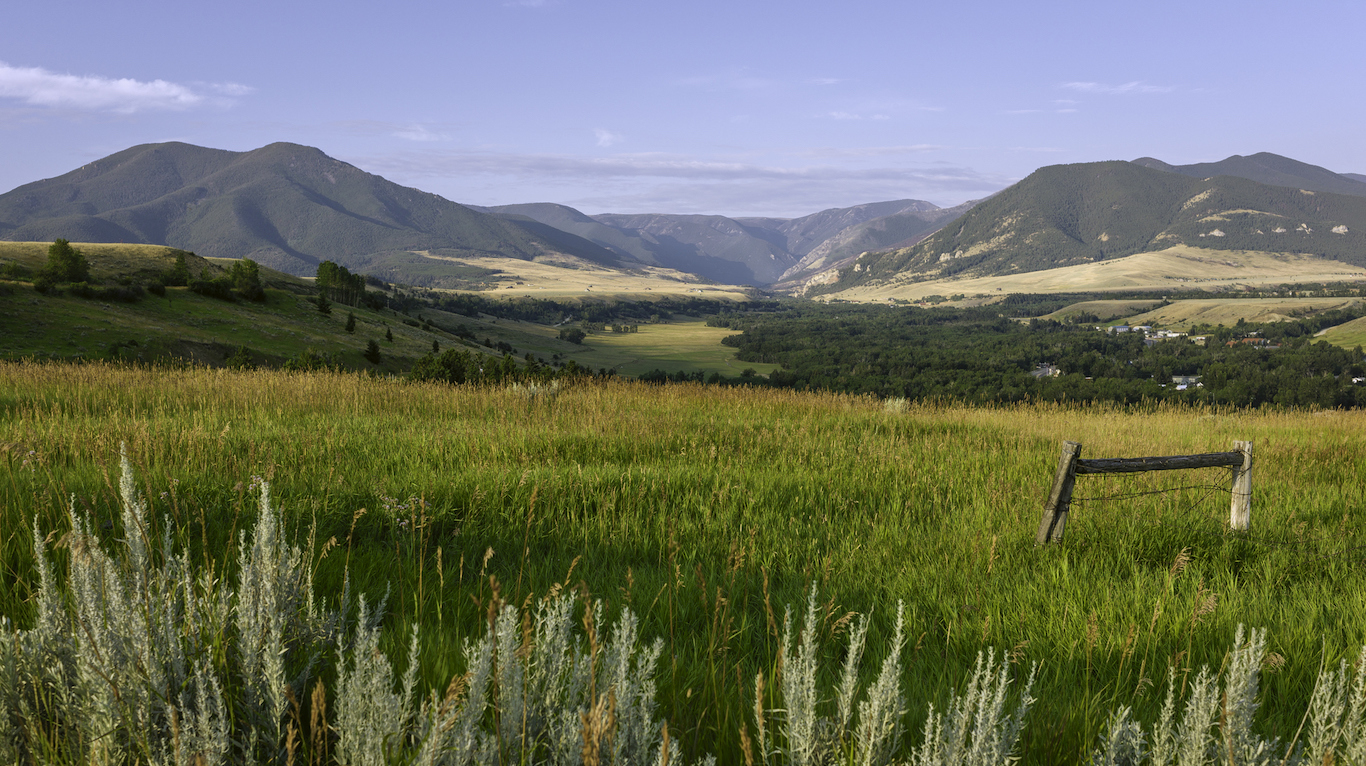
7. Montana
> Gov’t jobs, 2016: 19.5%
> Gov’t employment, 2016: 91,000 (9th lowest)
> Gov’t jobs, 2006: 20.2% (7th highest)
> Gov’t employment chg. (2006-2016): 4.0% (24th highest)
[in-text-ad-2]
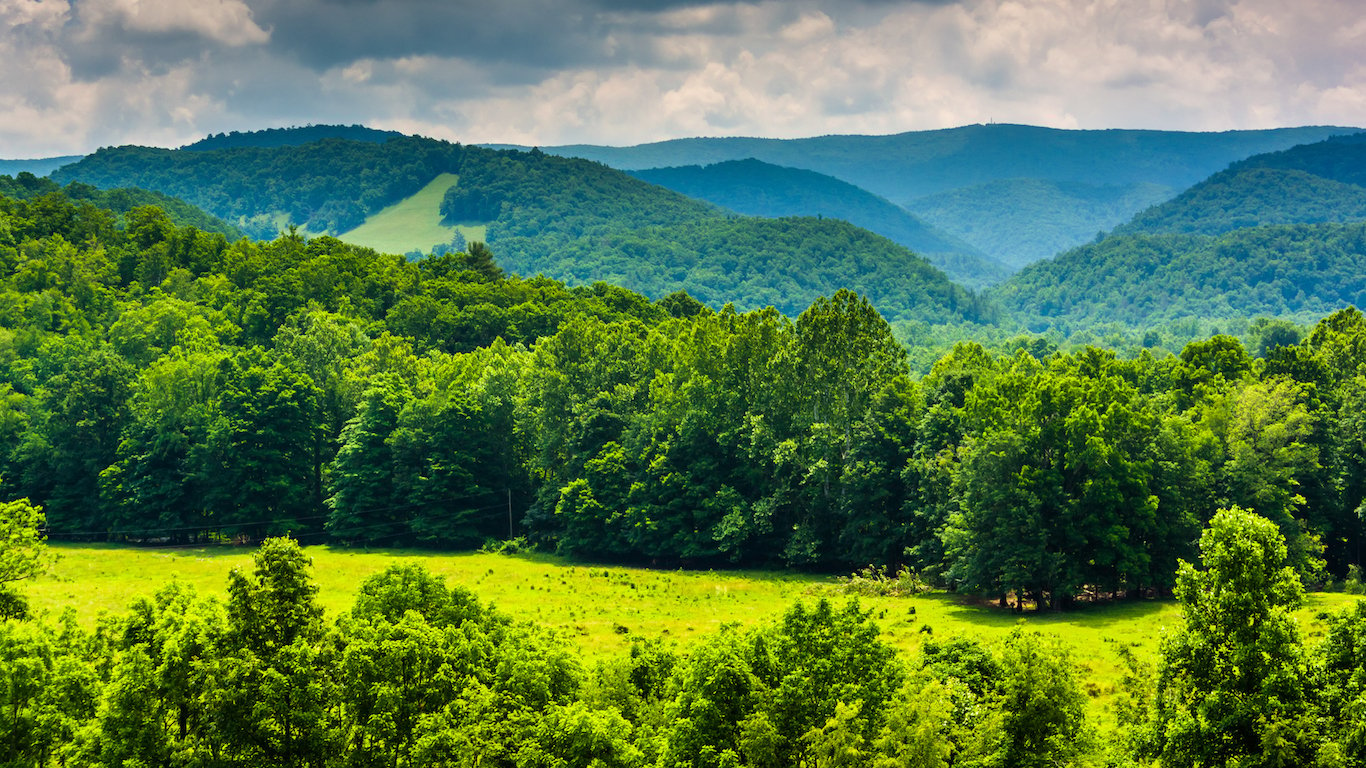
6. West Virginia
> Gov’t jobs, 2016: 20.9%
> Gov’t employment, 2016: 156,000 (13th lowest)
> Gov’t jobs, 2006: 19.2% (9th highest)
> Gov’t employment chg. (2006-2016): 7.5% (7th highest)
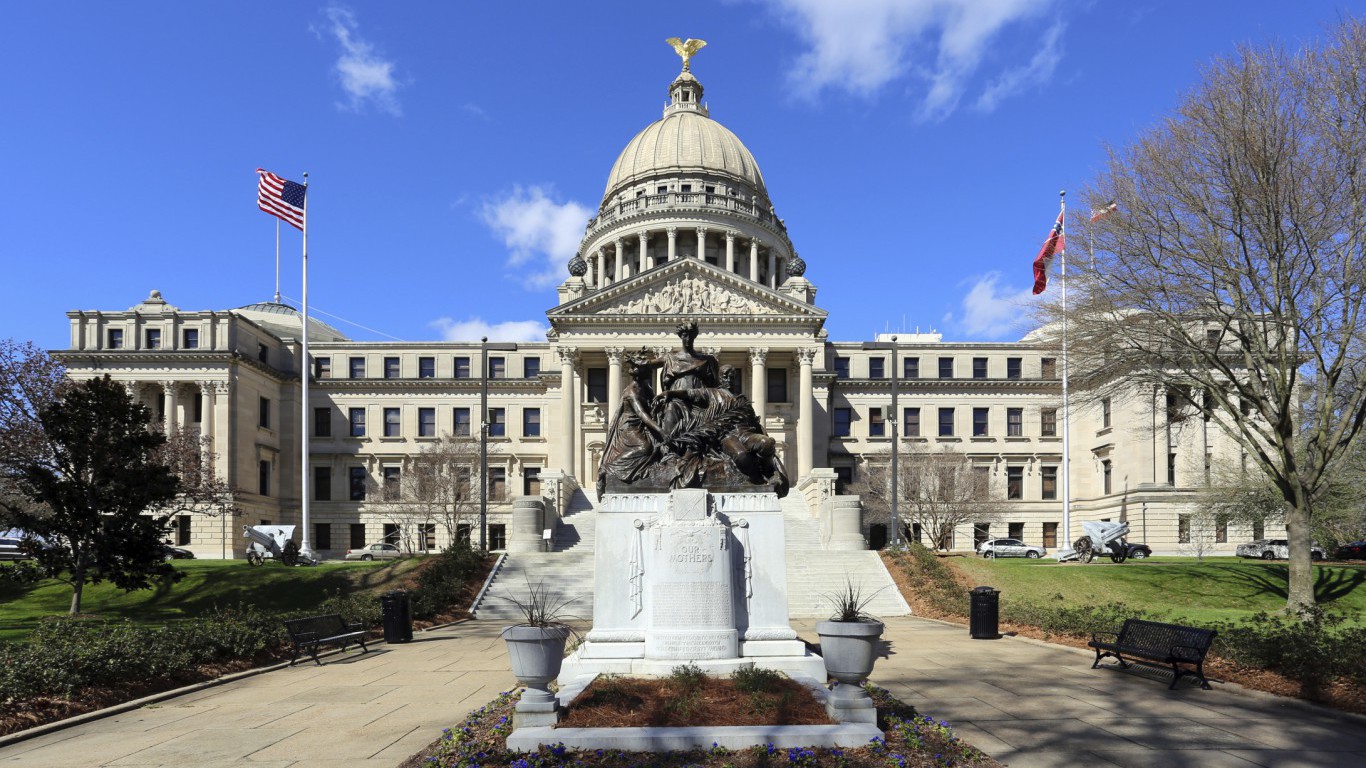
5. Mississippi
> Gov’t jobs, 2016: 21.4%
> Gov’t employment, 2016: 244,000 (20th lowest)
> Gov’t jobs, 2006: 21.0% (6th highest)
> Gov’t employment chg. (2006-2016): 2.1% (22nd lowest)
[in-text-ad]
4. Oklahoma
> Gov’t jobs, 2016: 21.4%
> Gov’t employment, 2016: 354,000 (25th highest)
> Gov’t jobs, 2006: 21.1% (5th highest)
> Gov’t employment chg. (2006-2016): 7.3% (9th highest)

3. New Mexico
> Gov’t jobs, 2016: 23.0%
> Gov’t employment, 2016: 191,000 (16th lowest)
> Gov’t jobs, 2006: 23.8% (2nd highest)
> Gov’t employment chg. (2006-2016): -3.2% (8th lowest)

2. Alaska
> Gov’t jobs, 2016: 24.4%
> Gov’t employment, 2016: 81,000 (6th lowest)
> Gov’t jobs, 2006: 25.7% (the highest)
> Gov’t employment chg. (2006-2016): 0.2% (16th lowest)
[in-text-ad-2]
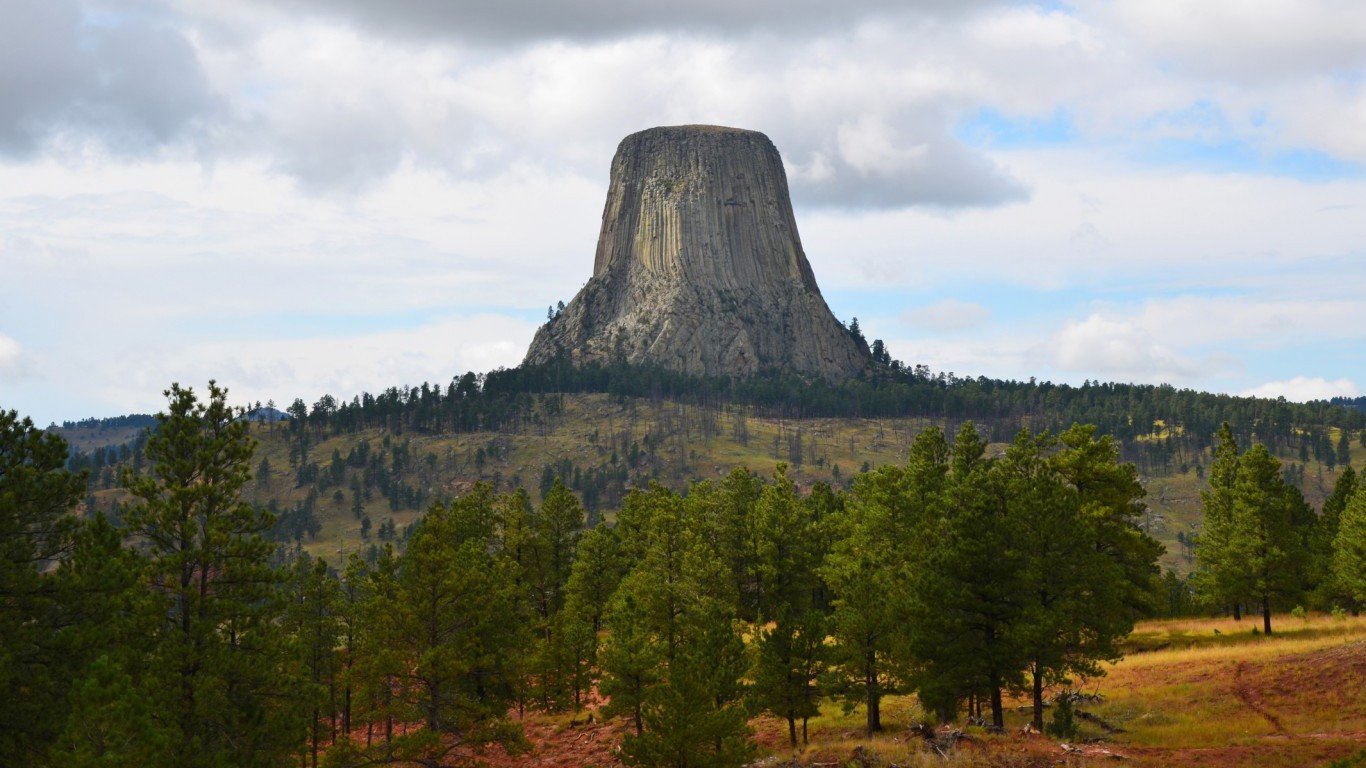
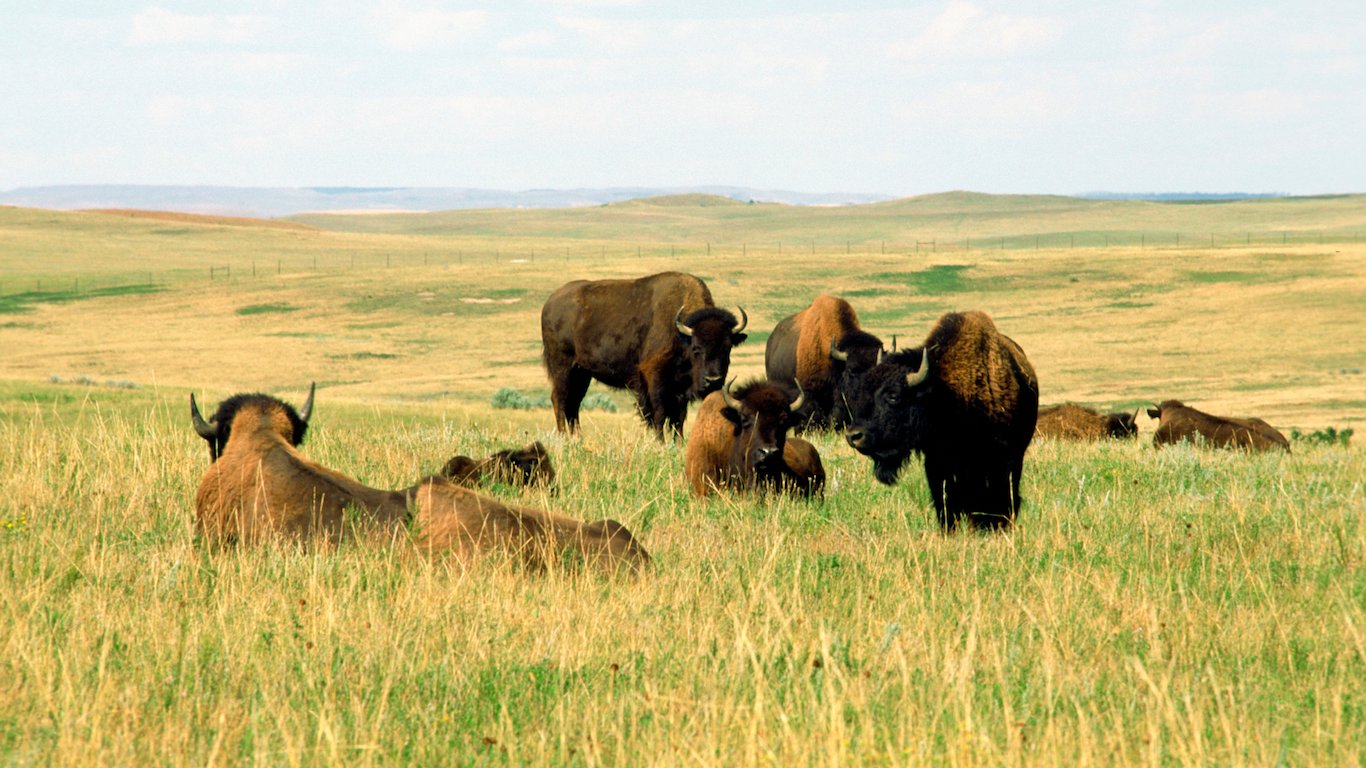
1. Wyoming
> Gov’t jobs, 2016: 25.4%
> Gov’t employment, 2016: 71,000 (4th lowest)
> Gov’t jobs, 2006: 23.6% (3rd highest)
> Gov’t employment chg. (2006-2016): 9.2% (5th highest)
While federal workers tend to gain the most national attention, they are a minority among government employees. The vast majority of government employees – 64.5% – actually work at the local level. This includes employees that comprise the administrative organization and management of cities, counties, and districts, as well as workers who help maintain public services such as education and waste management. In comparison, only 12.6% of government jobs are at the federal level.
One trait shared by the states with high government employment is that they tend to have especially low levels of population density. Alaska, which has the second highest share of government employees, has the lowest population density in the country with only 1.2 people per square mile. Wyoming, which has the largest concentration of government workers, has the second lowest population density among states, with only 5.8 people per square mile. These two states also have relatively small workforces in general. Due to the many basic societal services provided by government, such jobs will be needed in sparsely populated states as well as densely populated ones. Larger populations do not necessitate a proportional number of government jobs, however.
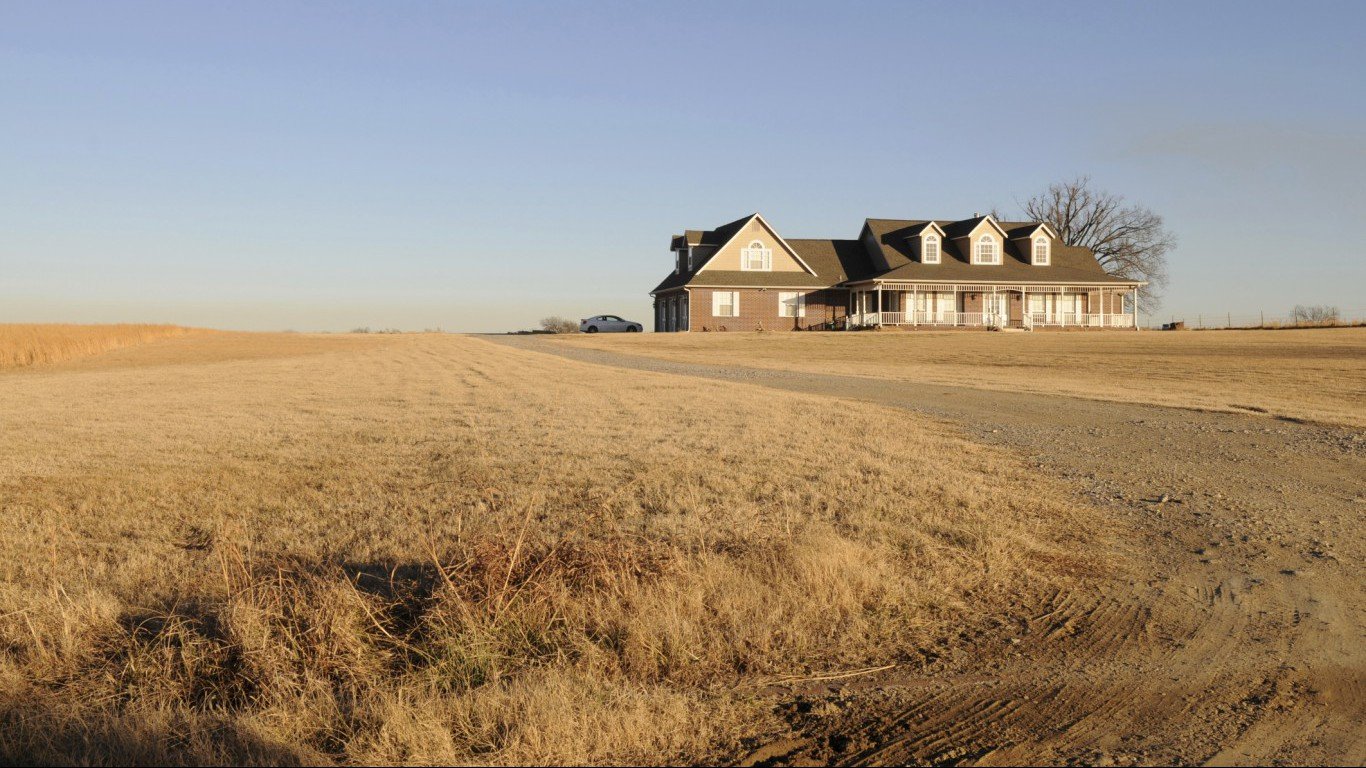
States with lower government employment, such as Massachusetts, Rhode Island, and Pennsylvania, tend to be much more densely packed. Rhode Island, for example, has 1,018.1 people per square mile.
In 31 states, a higher share of workers is employed by the government today compared to a decade ago. Among the 10 states with the greatest shares of those working in government, the percentages have increased in every state except for New Mexico. The opposite trend can be seen among the 10 states with the lowest share of government workers. In 8 of the 10 states, government employment as a share of total jobs has declined.
To determine government employment at the state, local, or federal level as a share of all jobs in each state, 24/7 Wall St. used employment data from the Bureau of Labor Statistics (BLS) for 2016. The percentage of the population working in a particular industry is relative to the state’s total nonfarm payrolls. State employment-to-population ratios are also from the BLS. Population density is from the U.S. Census Bureau’s 2015 American Community Survey.
Take the quiz below to get matched with a financial advisor today.
Each advisor has been vetted by SmartAsset and is held to a fiduciary standard to act in your best interests.
Here’s how it works:
1. Answer SmartAsset advisor match quiz
2. Review your pre-screened matches at your leisure. Check out the
advisors’ profiles.
3. Speak with advisors at no cost to you. Have an introductory call on the phone or introduction in person and choose whom to work with in the future
Take the retirement quiz right here.
Thank you for reading! Have some feedback for us?
Contact the 24/7 Wall St. editorial team.


 24/7 Wall St.
 24/7 Wall St.
 24/7 Wall St.