Special Report
The States With the Most Dangerous Roads

Published:
Last Updated:
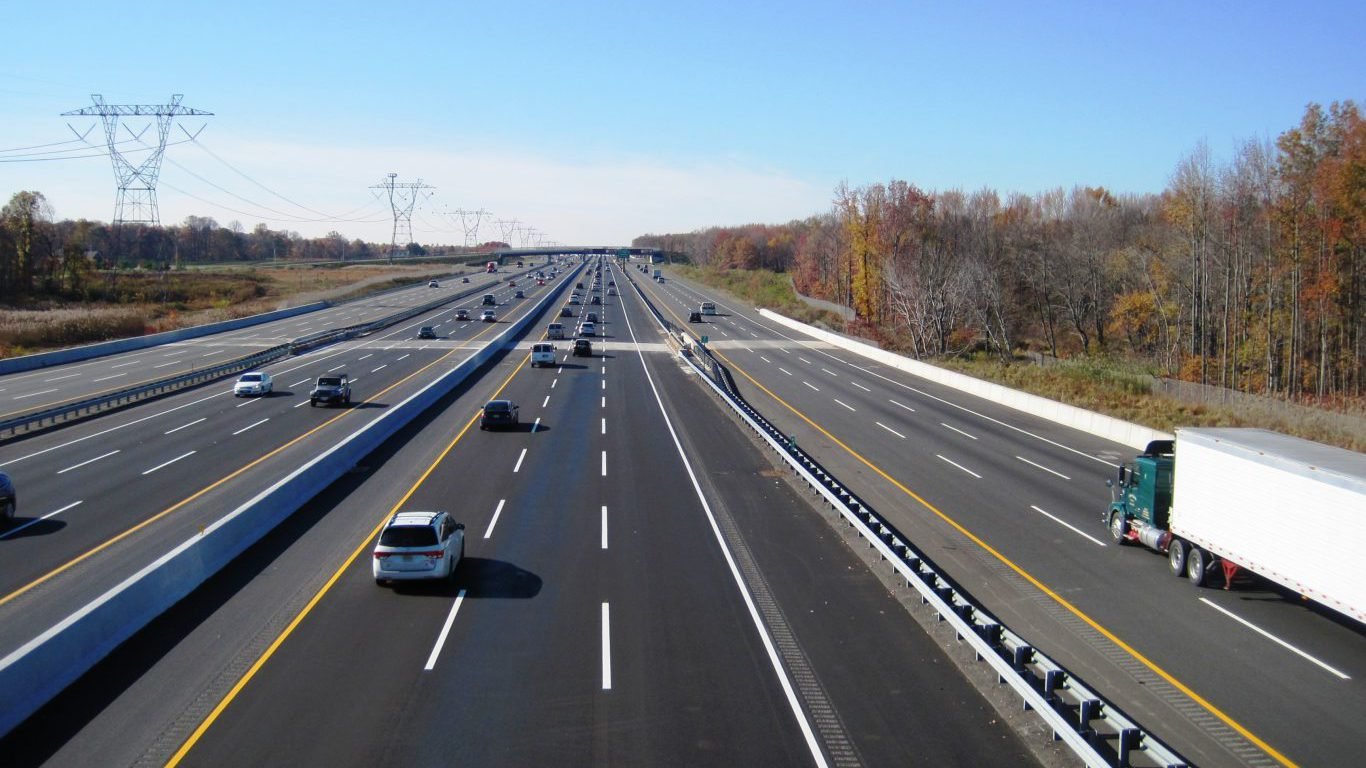
Motor vehicle crashes are one of the leading causes of death in the United States despite substantial improvement in recent decades. The fatality rate from car crashes has decreased to 10.9 deaths per 100,000 people in 2015 from 14.7 per 100,000 people a decade ago. Still, 35,092 lives were lost nationwide due to car accidents that year. The economic toll was $242 billion.
The rate of car crash deaths varies between states, however. In a number of safer states in areas such as New England, vehicular death rates that are less than one-fifth the rates in other parts of the country.
There are a number of factors that that affect how dangerous it is to drive in some states compared to others. 24/7 Wall St. reviewed the rates of deaths from car crashes in each state. To get a better understanding of the problem, we also examined data on rates of seatbelt use, the involvement of alcohol in fatal accidents, and the share of deadly accidents that take place on rural versus urban roads.
Click here to see the most and least dangerous states for driving.
Click here to see the detailed findings.
Click here to see the methodology.
These are the most (and least) dangerous states for driving.

50. Rhode Island
> Road deaths per 100,000: 4.3
> 2015 roadway fatalities: 45 (the lowest)
> Seat belt use: 87% (tied-24th highest)
> Drivers killed w/ BAC ≥ 0.08: 40% (6th highest)
> Fatal crashes on rural roads: 16% (6th lowest)
[in-text-ad]

49. Massachusetts
> Road deaths per 100,000: 4.5
> 2015 roadway fatalities: 306 (18th lowest)
> Seat belt use: 74% (tied-2nd lowest)
> Drivers killed w/ BAC ≥ 0.08: 30% (tied-21st highest)
> Fatal crashes on rural roads: 6% (the lowest)

48. New York
> Road deaths per 100,000: 5.7
> 2015 roadway fatalities: 1,121 (7th highest)
> Seat belt use: 92% (tied-13th highest)
> Drivers killed w/ BAC ≥ 0.08: 24% (tied-4th lowest)
> Fatal crashes on rural roads: 40% (12th lowest)
47. New Jersey
> Road deaths per 100,000: 6.3
> 2015 roadway fatalities: 562 (24th highest)
> Seat belt use: 91% (tied-17th highest)
> Drivers killed w/ BAC ≥ 0.08: 21% (tied-2nd lowest)
> Fatal crashes on rural roads: 11% (3rd lowest)
[in-text-ad-2]
46. Hawaii
> Road deaths per 100,000: 6.6
> 2015 roadway fatalities: 94 (4th lowest)
> Seat belt use: 93% (tied-7th highest)
> Drivers killed w/ BAC ≥ 0.08: 44% (3rd highest)
> Fatal crashes on rural roads: 14% (4th lowest)

45. Connecticut
> Road deaths per 100,000: 7.4
> 2015 roadway fatalities: 266 (14th lowest)
> Seat belt use: 85% (tied-16th lowest)
> Drivers killed w/ BAC ≥ 0.08: 38% (8th highest)
> Fatal crashes on rural roads: 17% (7th lowest)
[in-text-ad]

44. Minnesota
> Road deaths per 100,000: 7.5
> 2015 roadway fatalities: 411 (22nd lowest)
> Seat belt use: 94% (6th highest)
> Drivers killed w/ BAC ≥ 0.08: 29% (tied-24th highest)
> Fatal crashes on rural roads: 67% (17th highest)

43. Illinois
> Road deaths per 100,000: 7.8
> 2015 roadway fatalities: 998 (9th highest)
> Seat belt use: 95% (tied-4th highest)
> Drivers killed w/ BAC ≥ 0.08: 31% (tied-18th highest)
> Fatal crashes on rural roads: 42% (tied-13th lowest)

42. Washington
> Road deaths per 100,000: 7.9
> 2015 roadway fatalities: 568 (22nd highest)
> Seat belt use: 95% (tied-4th highest)
> Drivers killed w/ BAC ≥ 0.08: 28% (tied-11th lowest)
> Fatal crashes on rural roads: 51% (tied-20th lowest)
[in-text-ad-2]
41. California
> Road deaths per 100,000: 8.1
> 2015 roadway fatalities: 3,176 (2nd highest)
> Seat belt use: 97% (tied-highest)
> Drivers killed w/ BAC ≥ 0.08: N/A
> Fatal crashes on rural roads: 43% (15th lowest)

40. Maryland
> Road deaths per 100,000: 8.5
> 2015 roadway fatalities: 513 (24th lowest)
> Seat belt use: 93% (tied-7th highest)
> Drivers killed w/ BAC ≥ 0.08: 34% (13th highest)
> Fatal crashes on rural roads: 8% (2nd lowest)
[in-text-ad]

39. New Hampshire
> Road deaths per 100,000: 8.6
> 2015 roadway fatalities: 114 (5th lowest)
> Seat belt use: 70% (the lowest)
> Drivers killed w/ BAC ≥ 0.08: 24% (tied-4th lowest)
> Fatal crashes on rural roads: 58% (25th highest)

38. Alaska
> Road deaths per 100,000: 8.8
> 2015 roadway fatalities: 65 (3rd lowest)
> Seat belt use: 89% (tied-21st highest)
> Drivers killed w/ BAC ≥ 0.08: 48% (the highest)
> Fatal crashes on rural roads: 51% (tied-20th lowest)

37. Virginia
>Road deaths per 100,000: 9.0
> 2015 roadway fatalities: 753 (18th highest)
> Seat belt use: 81% (tied-11th lowest)
> Drivers killed w/ BAC ≥ 0.08: 26% (tied-8th lowest)
> Fatal crashes on rural roads: 64% (tied-19th highest)
[in-text-ad-2]
36. Vermont
> Road deaths per 100,000: 9.1
> 2015 roadway fatalities: 57 (12th lowest)
> Seat belt use: 86% (tied-19th lowest)
> Drivers killed w/ BAC ≥ 0.08: 30% (tied-21st highest)
> Fatal crashes on rural roads: 84% (4th highest)
35. Utah
> Road deaths per 100,000: 9.2
> 2015 roadway fatalities: 276 (16th lowest)
> Seat belt use: 87% (tied-24th highest)
> Drivers killed w/ BAC ≥ 0.08: 17% (the lowest)
> Fatal crashes on rural roads: 39% (tied-10th lowest)
[in-text-ad]

34. Pennsylvania
> Road deaths per 100,000: 9.4
> 2015 roadway fatalities: 1,200 (6th highest)
> Seat belt use: 83% (14th lowest)
> Drivers killed w/ BAC ≥ 0.08: 29% (tied-24th highest)
> Fatal crashes on rural roads: 51% (tied-20th lowest)

33. Ohio
> Road deaths per 100,000: 9.6
> 2015 roadway fatalities: 1,110 (8th highest)
> Seat belt use: 84% (15th lowest)
> Drivers killed w/ BAC ≥ 0.08: 30% (tied-21st highest)
> Fatal crashes on rural roads: 44% (16th lowest)
32. Michigan
> Road deaths per 100,000: 9.7
> 2015 roadway fatalities: 963 (11th highest)
> Seat belt use: 93% (tied-7th highest)
> Drivers killed w/ BAC ≥ 0.08: N/A
> Fatal crashes on rural roads: 60% (23rd highest)
[in-text-ad-2]
31. Wisconsin
> Road deaths per 100,000: 9.8
> 2015 roadway fatalities: 566 (23rd highest)
> Seat belt use: 86% (tied-19th lowest)
> Drivers killed w/ BAC ≥ 0.08: 32% (tied-15th highest)
> Fatal crashes on rural roads: 64% (tied-19th highest)
30. Colorado
> Road deaths per 100,000: 10.0
> 2015 roadway fatalities: 546 (25th highest)
> Seat belt use: 85% (tied-16th lowest)
> Drivers killed w/ BAC ≥ 0.08: 28% (tied-11th lowest)
> Fatal crashes on rural roads: 48% (17th lowest)
[in-text-ad]
29. Iowa
> Road deaths per 100,000: 10.2
> 2015 roadway fatalities: 320 (19th lowest)
> Seat belt use: 93% (tied-7th highest)
> Drivers killed w/ BAC ≥ 0.08: N/A
> Fatal crashes on rural roads: 72% (tied-11th highest)

28. Oregon
> Road deaths per 100,000: 11.1
> 2015 roadway fatalities: 447 (23rd lowest)
> Seat belt use: 96% (3rd highest)
> Drivers killed w/ BAC ≥ 0.08: 36% (tied-10th highest)
> Fatal crashes on rural roads: 70% (tied-15th highest)

27. Nevada
> Road deaths per 100,000: 11.2
> 2015 roadway fatalities: 325 (20th lowest)
> Seat belt use: 92% (tied-13th highest)
> Drivers killed w/ BAC ≥ 0.08: 33% (14th highest)
> Fatal crashes on rural roads: 33% (8th lowest)
[in-text-ad-2]
26. Maine
> Road deaths per 100,000: 11.7
> 2015 roadway fatalities: 156 (10th lowest)
> Seat belt use: 86% (tied-19th lowest)
> Drivers killed w/ BAC ≥ 0.08: 35% (12th highest)
> Fatal crashes on rural roads: 83% (tied-5th highest)

25. Kansas
> Road deaths per 100,000: 12.2
> 2015 roadway fatalities: 355 (21st lowest)
> Seat belt use: 82% (13th lowest)
> Drivers killed w/ BAC ≥ 0.08: N/A
> Fatal crashes on rural roads: 78% (tied-8th highest)
[in-text-ad]
24. Indiana
> Road deaths per 100,000: 12.4
> 2015 roadway fatalities: 821 (16th highest)
> Seat belt use: 92% (tied-13th highest)
> Drivers killed w/ BAC ≥ 0.08: N/A
> Fatal crashes on rural roads: 64% (tied-19th highest)

23. Texas
> Road deaths per 100,000: 12.8
> 2015 roadway fatalities: 3,516 (the highest)
> Seat belt use: 91% (tied-17th highest)
> Drivers killed w/ BAC ≥ 0.08: N/A
> Fatal crashes on rural roads: 42% (tied-13th lowest)
22. Nebraska
> Road deaths per 100,000: 13.0
> 2015 roadway fatalities: 246 (13th lowest)
> Seat belt use: 80% (tied-6th lowest)
> Drivers killed w/ BAC ≥ 0.08: 31% (tied-18th highest)
> Fatal crashes on rural roads: 70% (tied-15th highest)
[in-text-ad-2]
21. Arizona
> Road deaths per 100,000: 13.1
> 2015 roadway fatalities: 893 (13th highest)
> Seat belt use: 87% (tied-24th highest)
> Drivers killed w/ BAC ≥ 0.08: 31% (tied-18th highest)
> Fatal crashes on rural roads: 38% (9th lowest)

20. Idaho
> Road deaths per 100,000: 13.1
> 2015 roadway fatalities: 216 (11th lowest)
> Seat belt use: 81% (tied-11th lowest)
> Drivers killed w/ BAC ≥ 0.08: 32% (tied-15th highest)
> Fatal crashes on rural roads: 75% (10th highest)
[in-text-ad]
19. Delaware
> Road deaths per 100,000: 13.3
> 2015 roadway fatalities: 126 (6th lowest)
> Seat belt use: 90% (tied-19th highest)
> Drivers killed w/ BAC ≥ 0.08: 42% (tied-4th highest)
> Fatal crashes on rural roads: 52% (23rd lowest)
18. North Carolina
> Road deaths per 100,000: 13.7
> 2015 roadway fatalities: 1,379 (5th highest)
> Seat belt use: 90% (tied-19th highest)
> Drivers killed w/ BAC ≥ 0.08: 28% (tied-11th lowest)
> Fatal crashes on rural roads: 66% (18th highest)
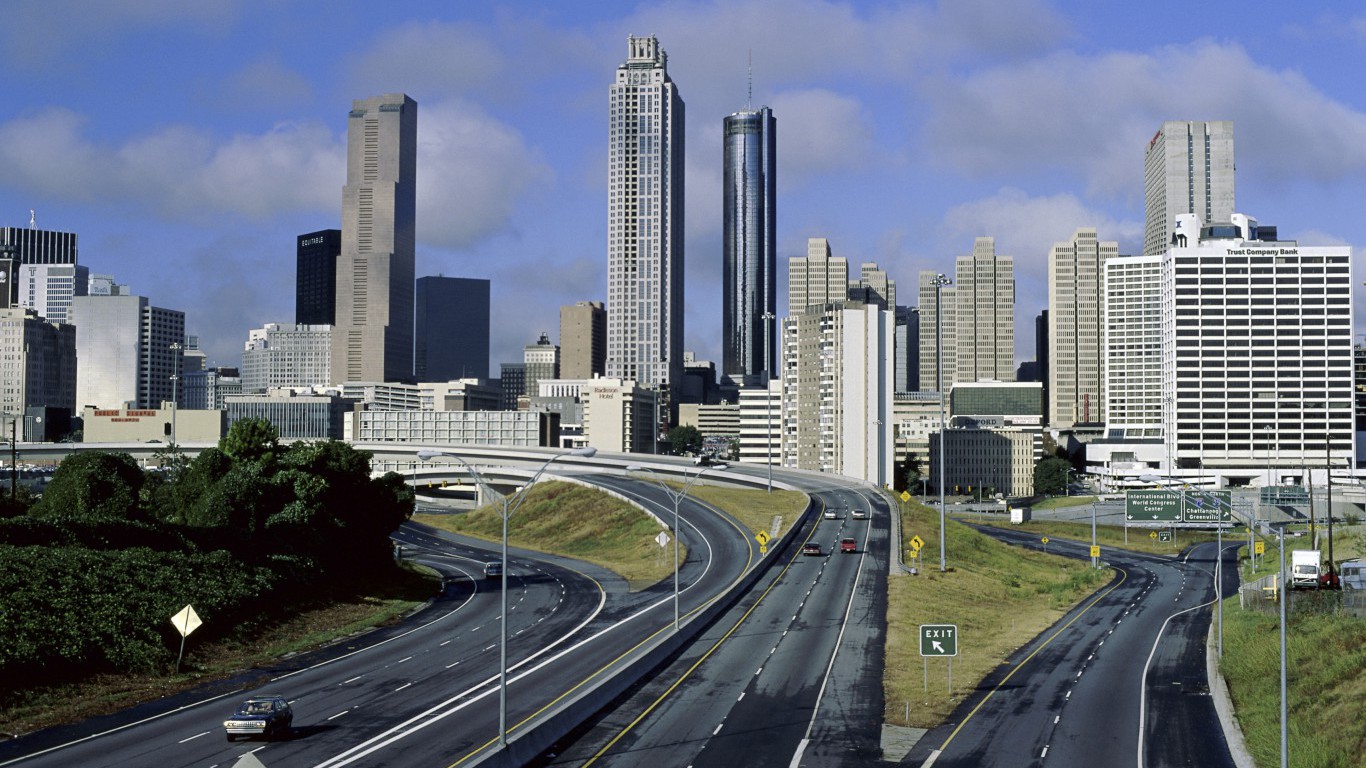
17. Georgia
> Road deaths per 100,000: 14.0
> 2015 roadway fatalities: 1,430 (4th highest)
> Seat belt use: 97% (tied-highest)
> Drivers killed w/ BAC ≥ 0.08: N/A
> Fatal crashes on rural roads: 39% (tied-10th lowest)
[in-text-ad-2]
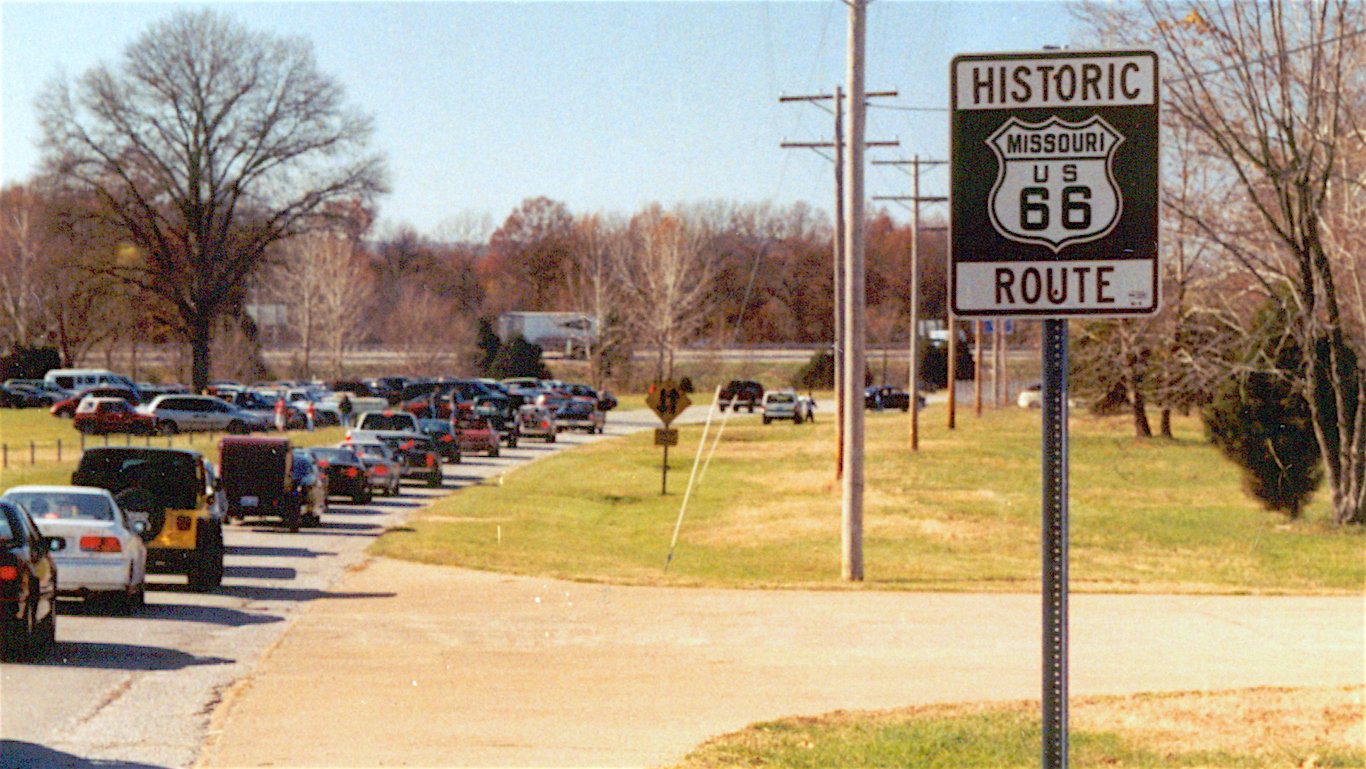
16. Missouri
> Road deaths per 100,000: 14.3
> 2015 roadway fatalities: 869 (14th highest)
> Seat belt use: 80% (tied-6th lowest)
> Drivers killed w/ BAC ≥ 0.08: 27% (10th lowest)
> Fatal crashes on rural roads: 57% (tied-24th lowest)
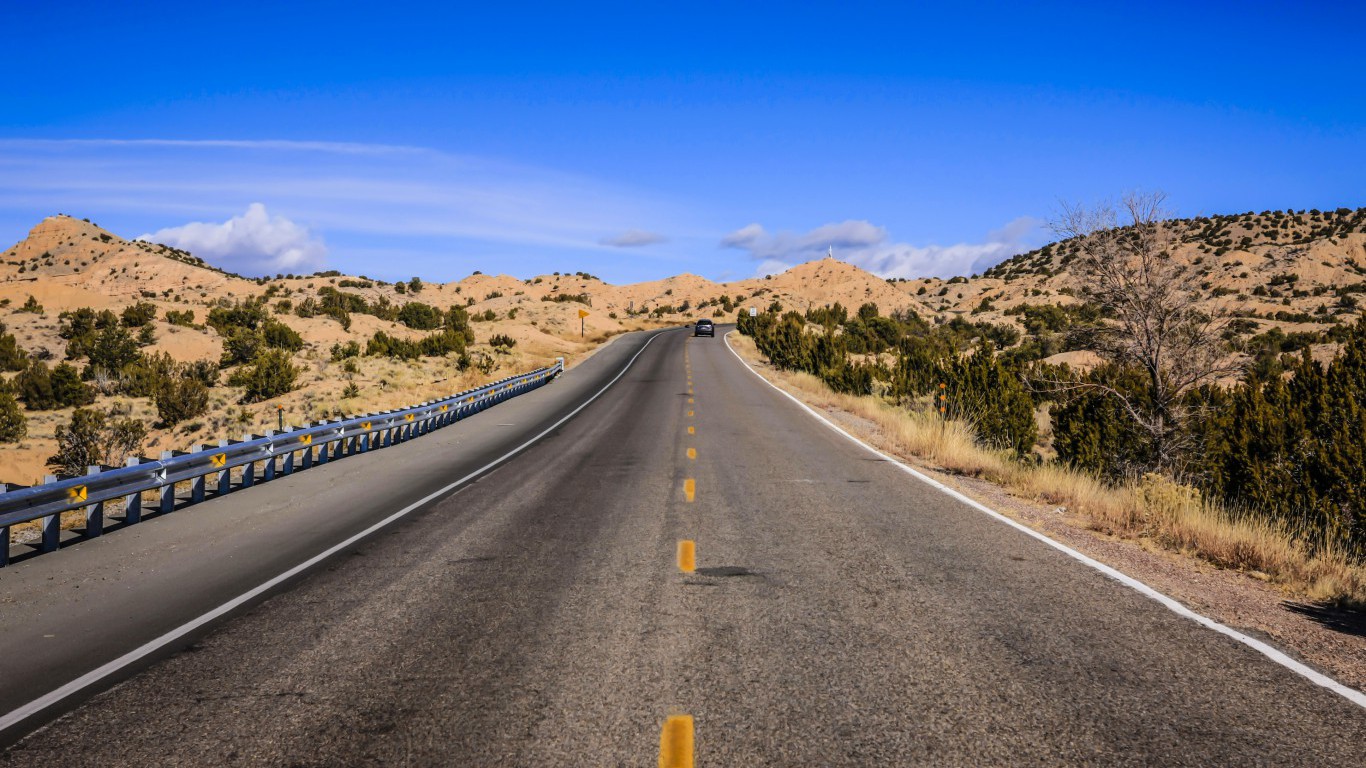
15. New Mexico
> Road deaths per 100,000: 14.3
> 2015 roadway fatalities: 298 (17th lowest)
> Seat belt use: 93% (tied-7th highest)
> Drivers killed w/ BAC ≥ 0.08: 39% (7th highest)
> Fatal crashes on rural roads: 59% (24th highest)
[in-text-ad]

14. Florida
> Road deaths per 100,000: 14.5
> 2015 roadway fatalities: 2,939 (3rd highest)
> Seat belt use: 89% (tied-21st highest)
> Drivers killed w/ BAC ≥ 0.08: N/A
> Fatal crashes on rural roads: 15% (5th lowest)

13. Tennessee
> Road deaths per 100,000: 14.5
> 2015 roadway fatalities: 958 (12th highest)
> Seat belt use: 86% (tied-19th lowest)
> Drivers killed w/ BAC ≥ 0.08: 26% (tied-8th lowest)
> Fatal crashes on rural roads: 50% (19th lowest)
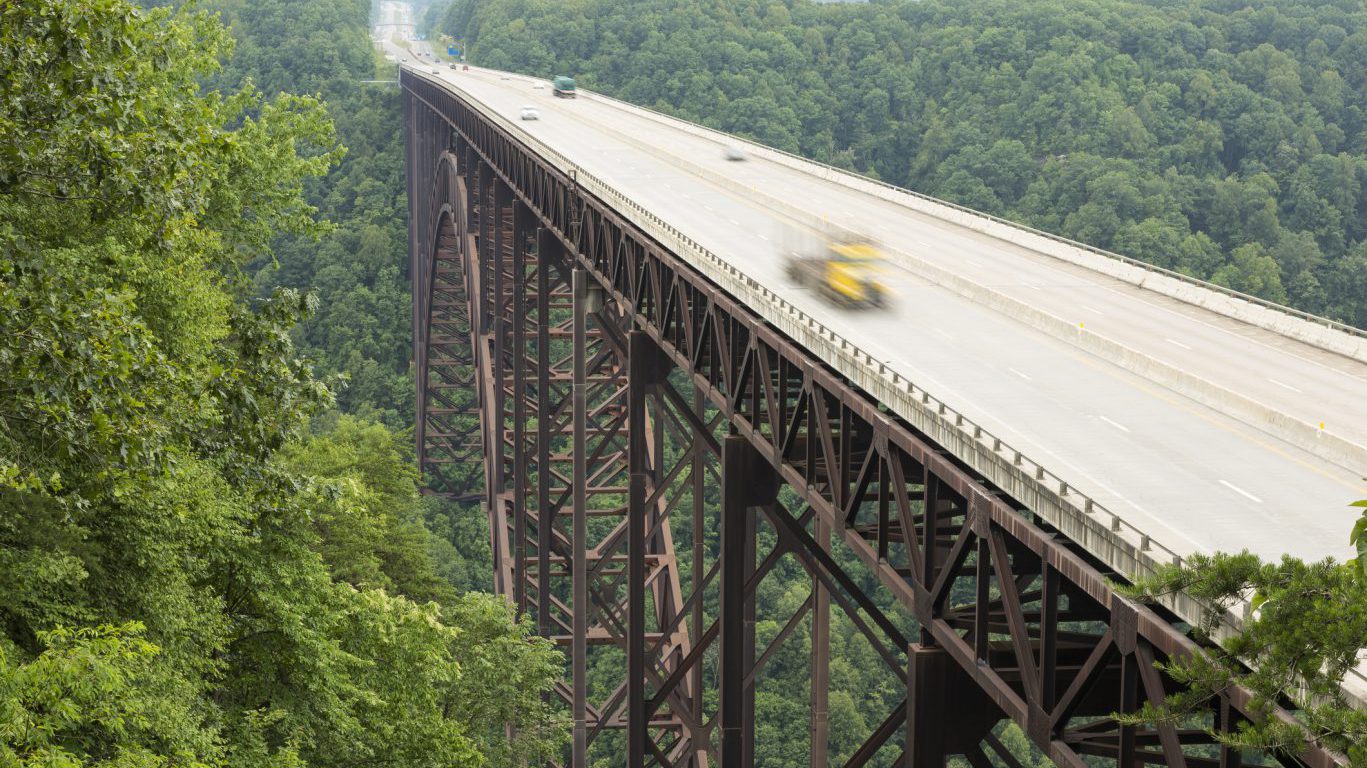
12. West Virginia
> Road deaths per 100,000: 14.5
> 2015 roadway fatalities: 268 (15th lowest)
> Seat belt use: 89% (tied-21st highest)
> Drivers killed w/ BAC ≥ 0.08: 21% (tied-2nd lowest)
> Fatal crashes on rural roads: 71% (tied-13th highest)
[in-text-ad-2]

11. Louisiana
> Road deaths per 100,000: 15.5
> 2015 roadway fatalities: 726 (19th highest)
> Seat belt use: 86% (tied-19th lowest)
> Drivers killed w/ BAC ≥ 0.08: 36% (tied-10th highest)
> Fatal crashes on rural roads: 49% (18th lowest)
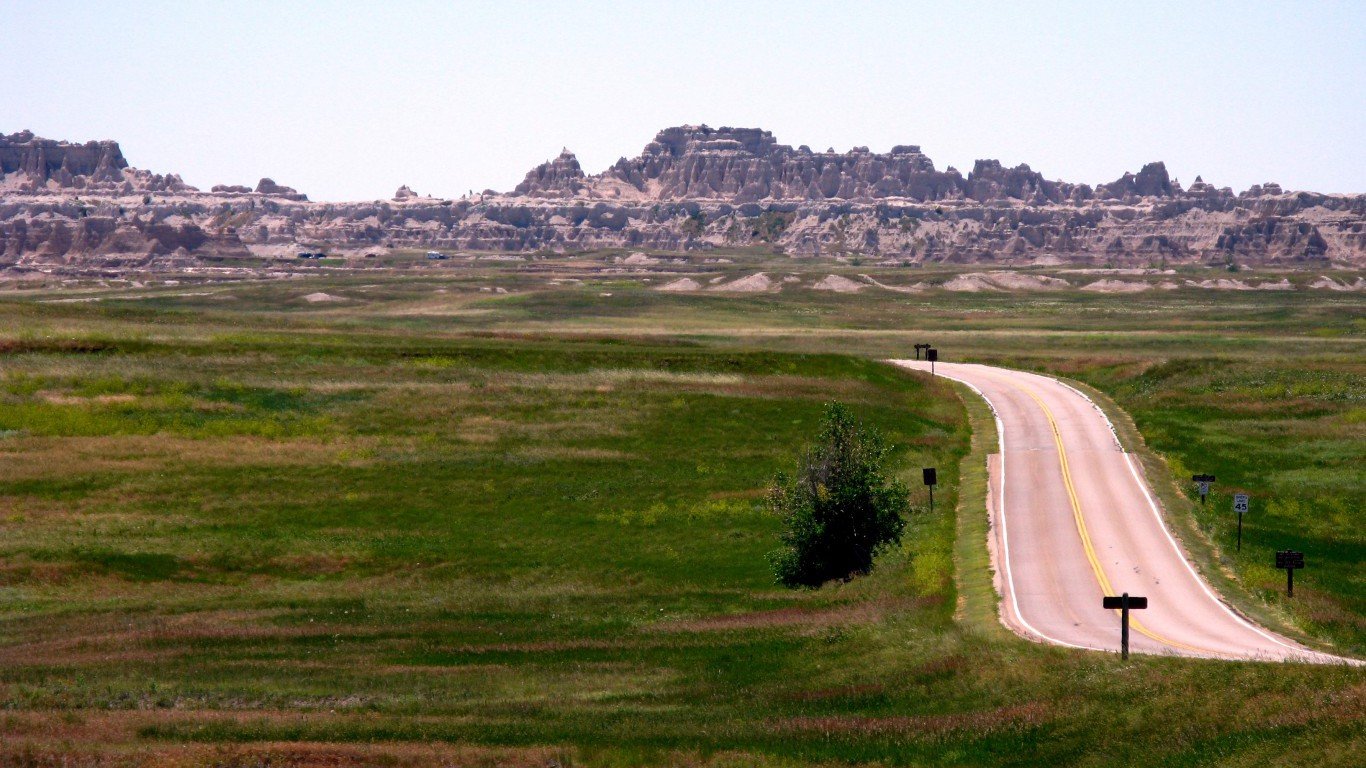
10. South Dakota
> Road deaths per 100,000: 15.5
> 2015 roadway fatalities: 133 (8th lowest)
> Seat belt use: 74% (tied-2nd lowest)
> Drivers killed w/ BAC ≥ 0.08: 47% (2nd highest)
> Fatal crashes on rural roads: 85% (3rd highest)
[in-text-ad]

9. Oklahoma
> Road deaths per 100,000: 16.4
> 2015 roadway fatalities: 643 (21st highest)
> Seat belt use: 85% (tied-16th lowest)
> Drivers killed w/ BAC ≥ 0.08: 25% (tied-6th lowest)
> Fatal crashes on rural roads: 61% (22nd highest)
8. Kentucky
> Road deaths per 100,000: 17.2
> 2015 roadway fatalities: 761 (17th highest)
> Seat belt use: 87% (tied-24th highest)
> Drivers killed w/ BAC ≥ 0.08: 25% (tied-6th lowest)
> Fatal crashes on rural roads: 78% (tied-8th highest)
7. North Dakota
> Road deaths per 100,000: 17.3
> 2015 roadway fatalities: 131 (7th lowest)
> Seat belt use: 80% (tied-6th lowest)
> Drivers killed w/ BAC ≥ 0.08: 42% (tied-4th highest)
> Fatal crashes on rural roads: 93% (the highest)
[in-text-ad-2]

6. Alabama
> Road deaths per 100,000: 17.5
> 2015 roadway fatalities: 849 (15th highest)
> Seat belt use: 93% (tied-7th highest)
> Drivers killed w/ BAC ≥ 0.08: N/A
> Fatal crashes on rural roads: 57% (tied-24th lowest)
5. Arkansas
> Road deaths per 100,000: 17.8
> 2015 roadway fatalities: 531 (25th lowest)
> Seat belt use: 78% (5th lowest)
> Drivers killed w/ BAC ≥ 0.08: 29% (tied-24th highest)
> Fatal crashes on rural roads: 71% (tied-13th highest)
[in-text-ad]
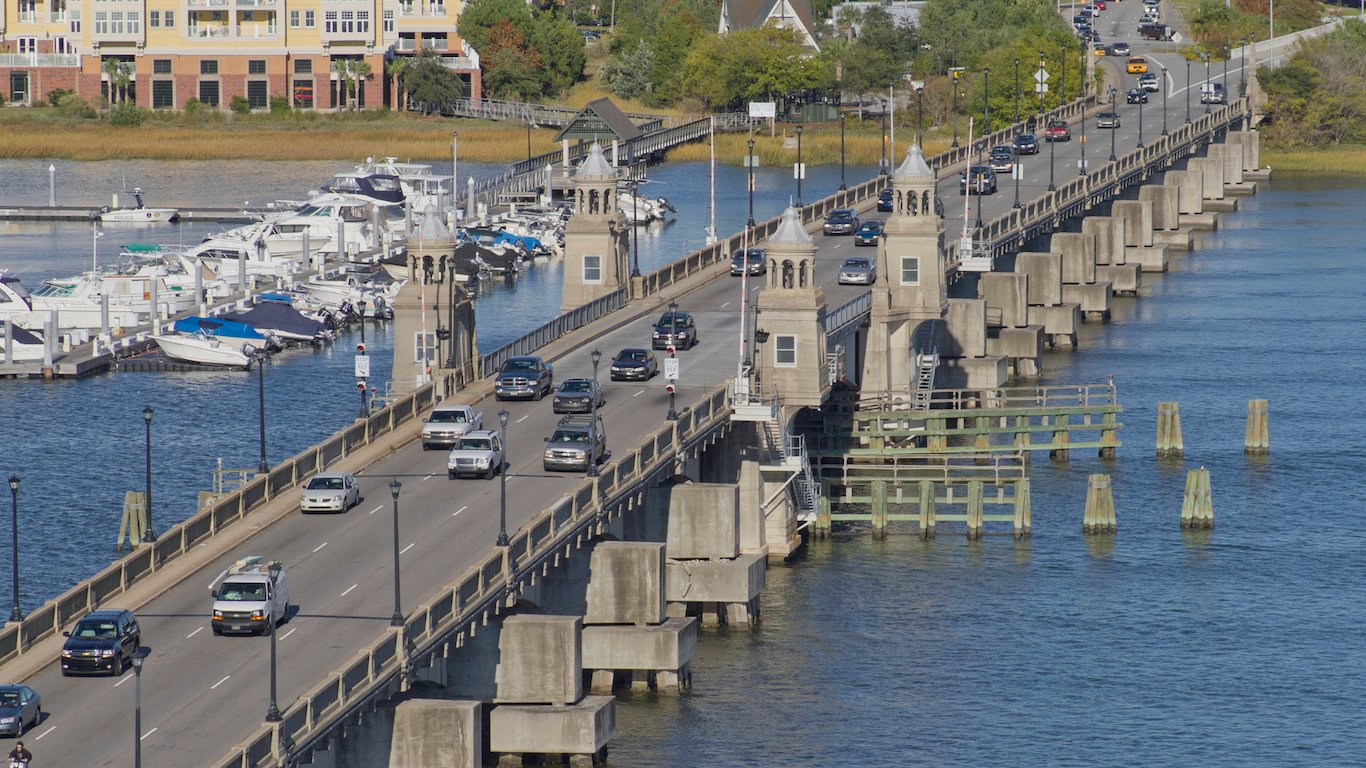
4. South Carolina
> Road deaths per 100,000: 20.0
> 2015 roadway fatalities: 977 (10th highest)
> Seat belt use: 92% (tied-13th highest)
> Drivers killed w/ BAC ≥ 0.08: 32% (tied-15th highest)
> Fatal crashes on rural roads: 72% (tied-11th highest)

3. Montana
> Road deaths per 100,000: 21.7
> 2015 roadway fatalities: 224 (12th lowest)
> Seat belt use: 77% (4th lowest)
> Drivers killed w/ BAC ≥ 0.08: 37% (9th highest)
> Fatal crashes on rural roads: 89% (2nd highest)
2. Mississippi
> Road deaths per 100,000: 22.6
> 2015 roadway fatalities: 677 (20th highest)
> Seat belt use: 80% (tied-6th lowest)
> Drivers killed w/ BAC ≥ 0.08: N/A
> Fatal crashes on rural roads: 83% (tied-5th highest)
[in-text-ad-2]
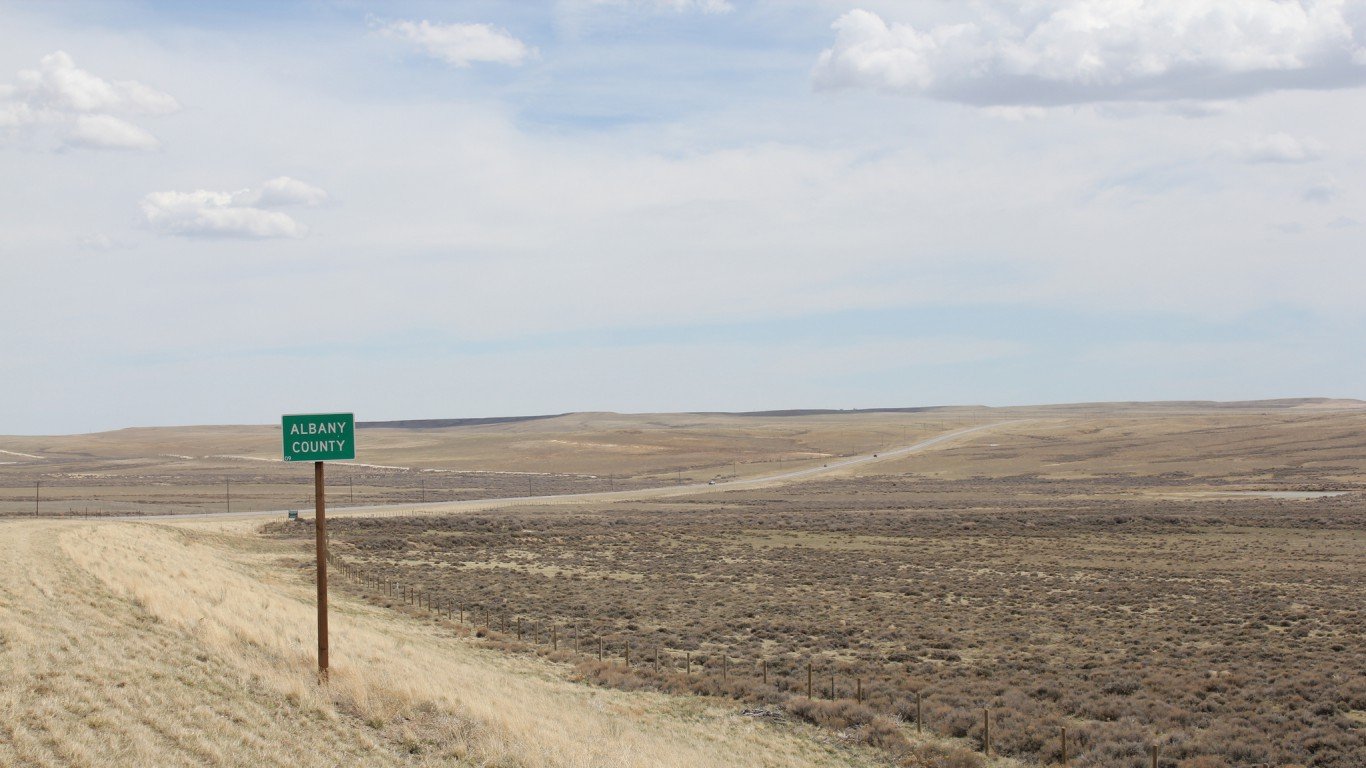
1. Wyoming
> Road deaths per 100,000: 24.7
> 2015 roadway fatalities: 145 (9th lowest)
> Seat belt use: 80% (tied-6th lowest)
> Drivers killed w/ BAC ≥ 0.08: N/A
> Fatal crashes on rural roads: 82% (7th highest)
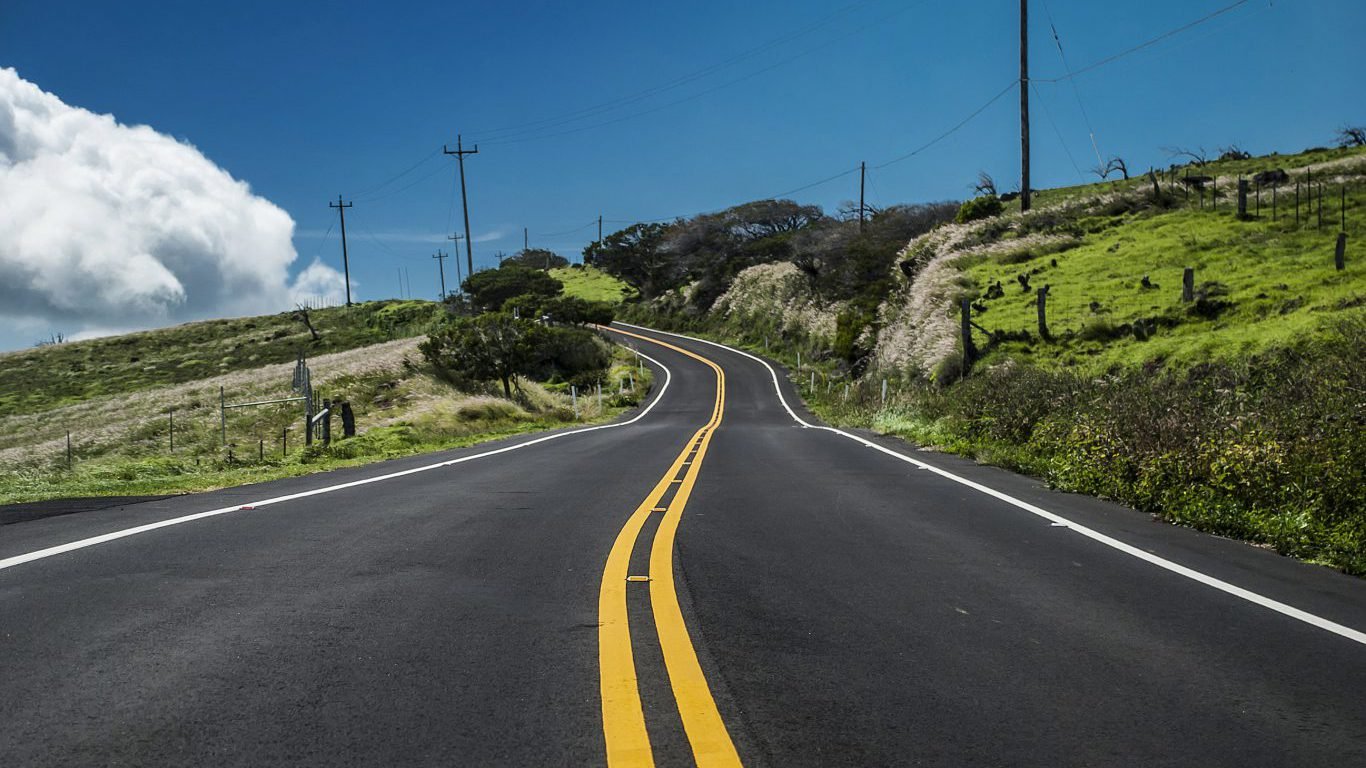
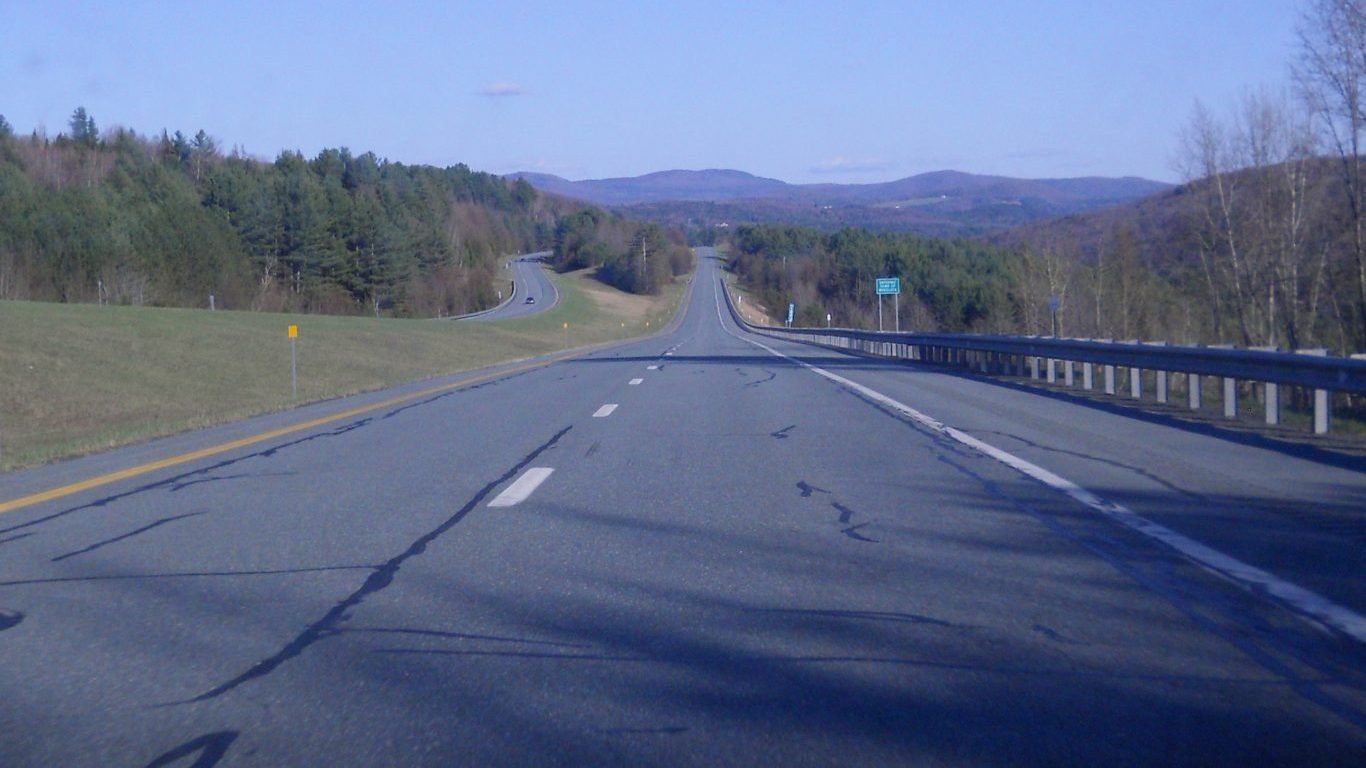
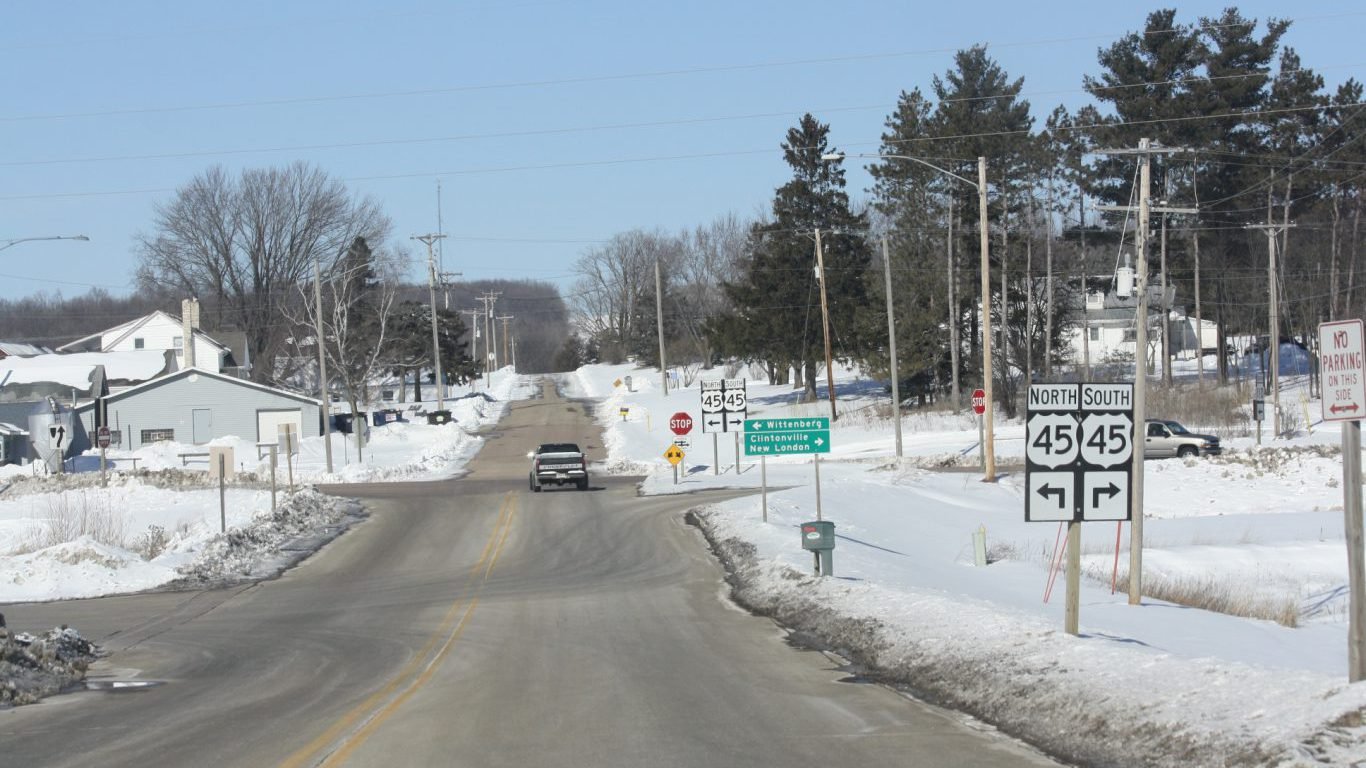
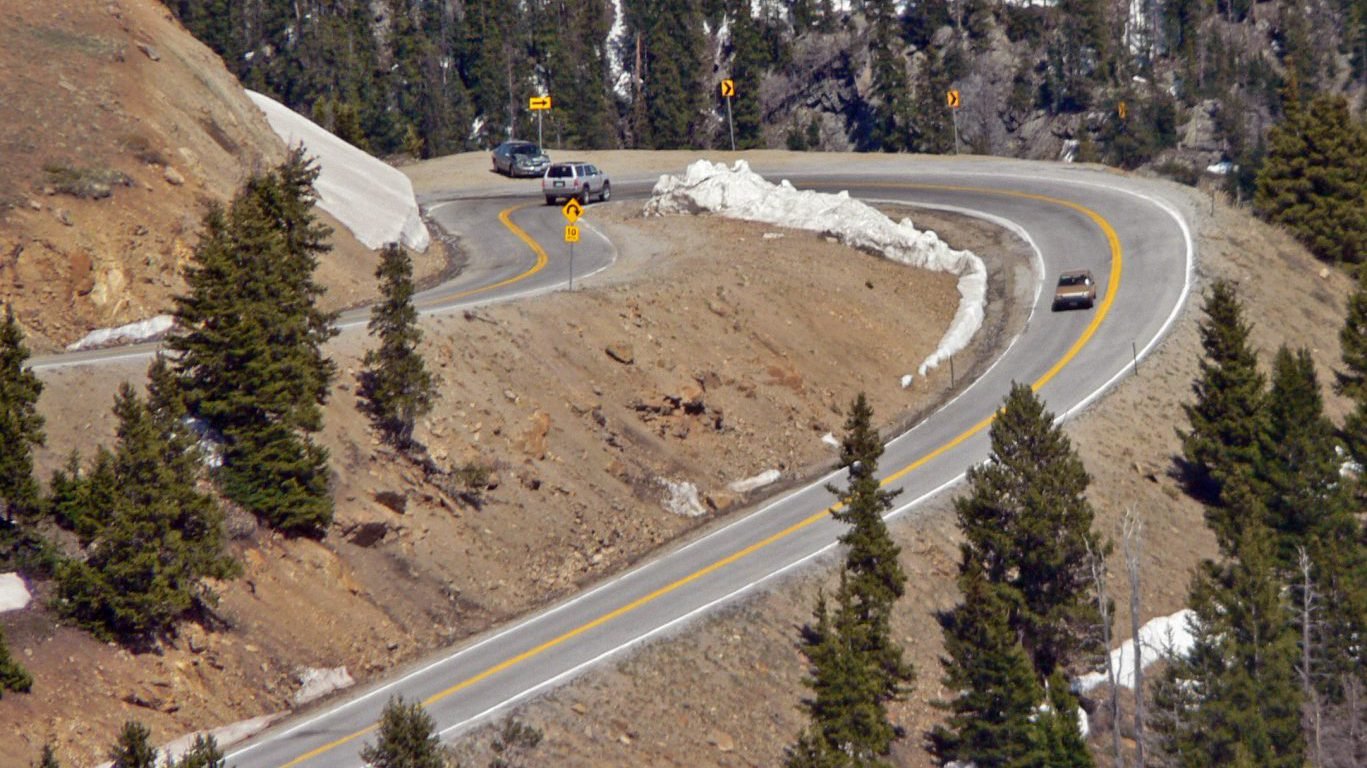
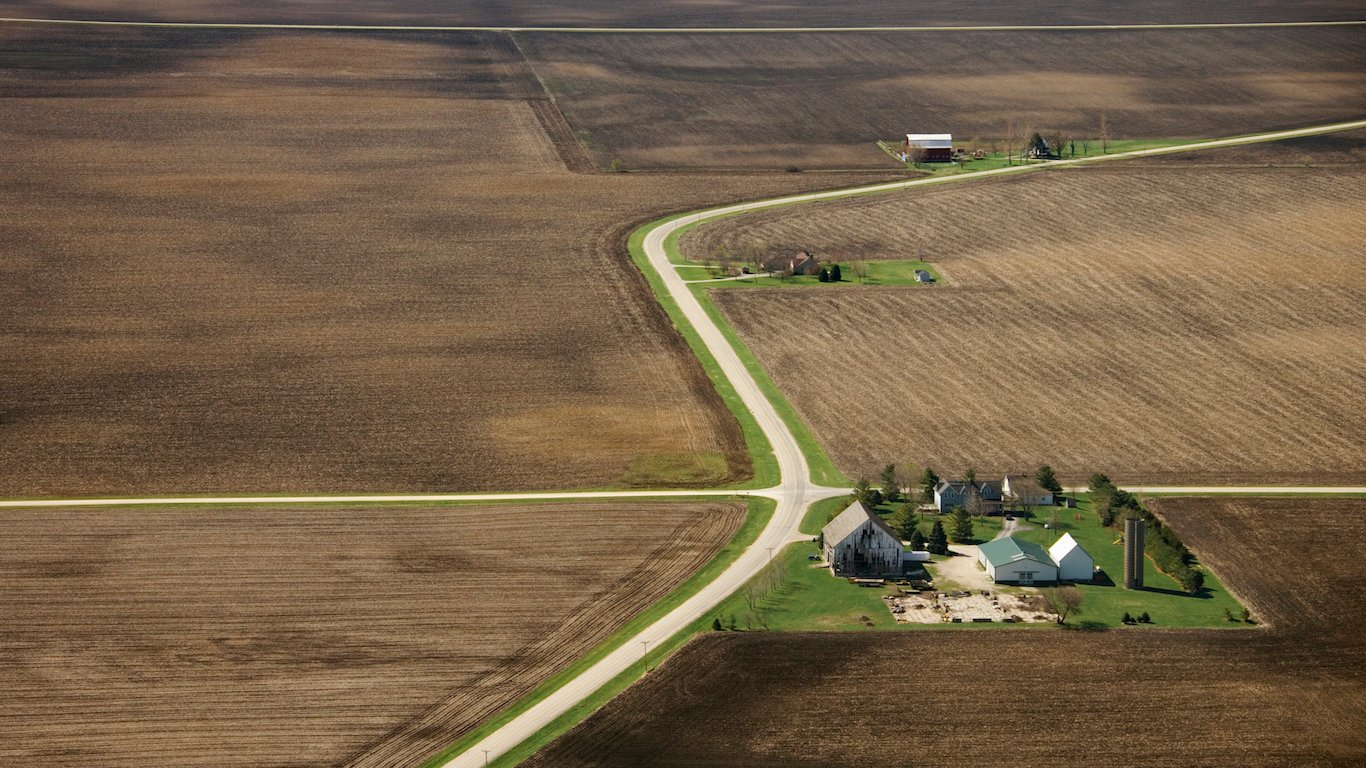
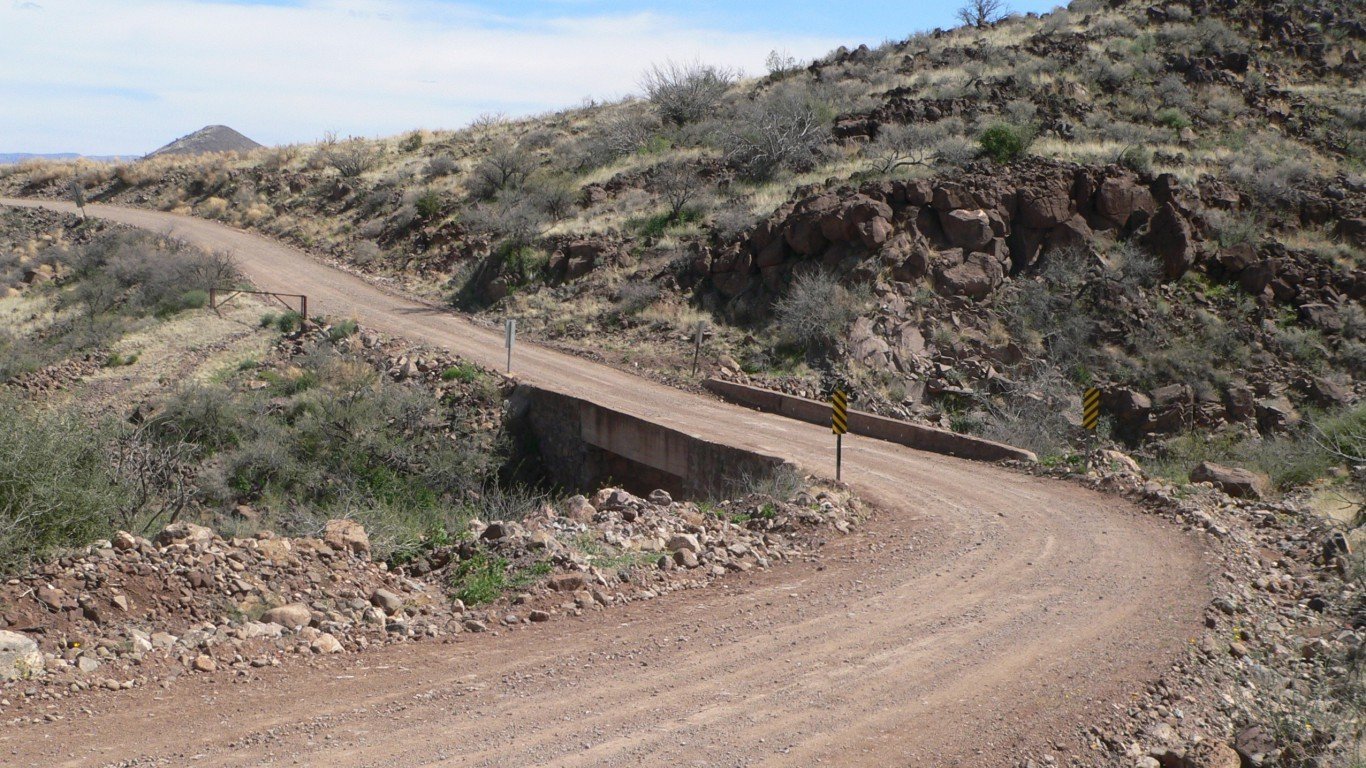
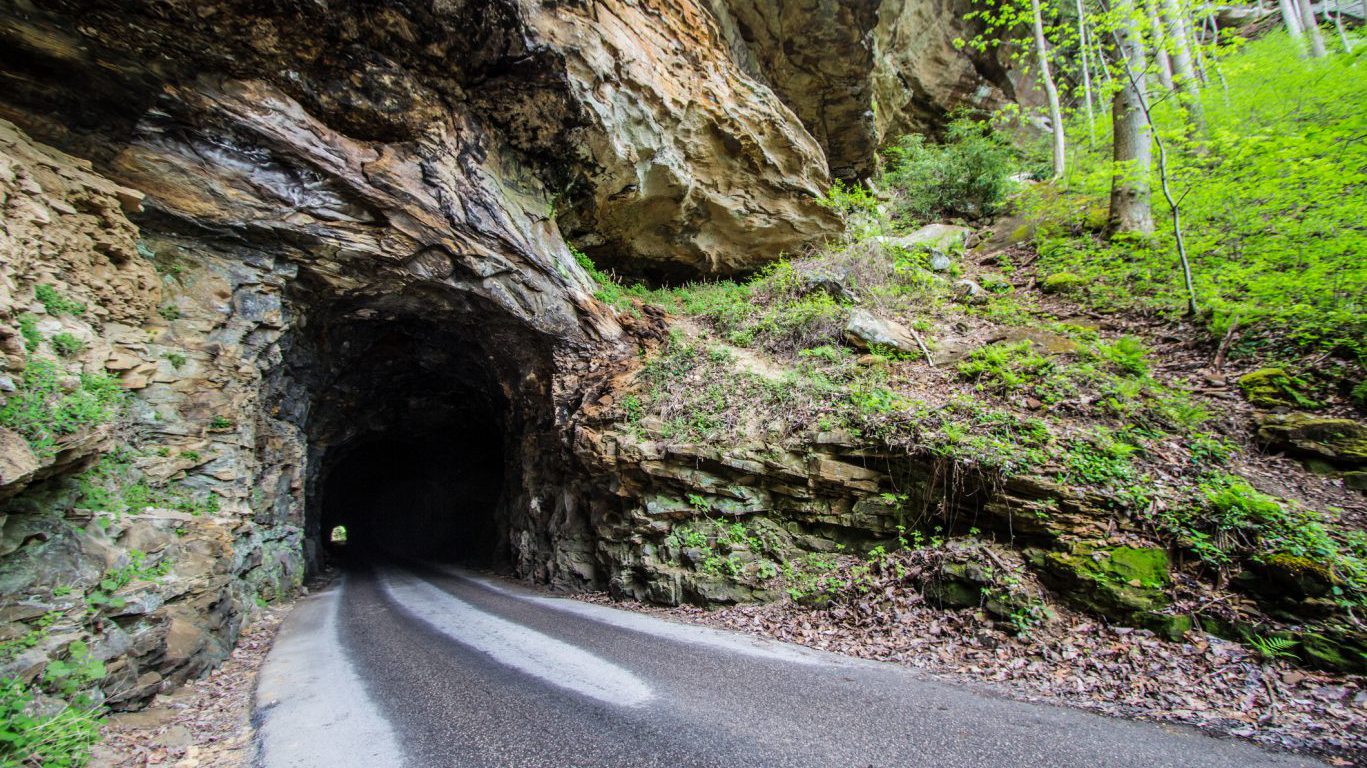
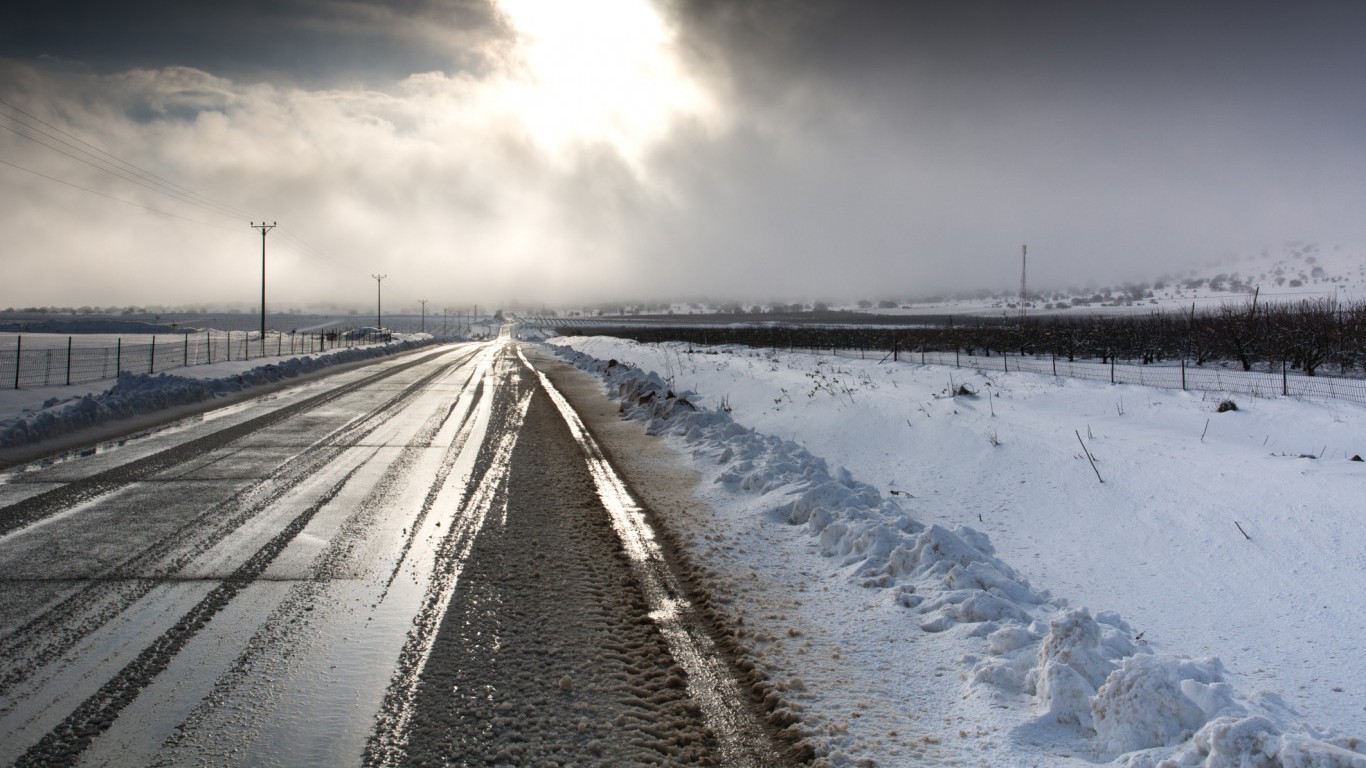
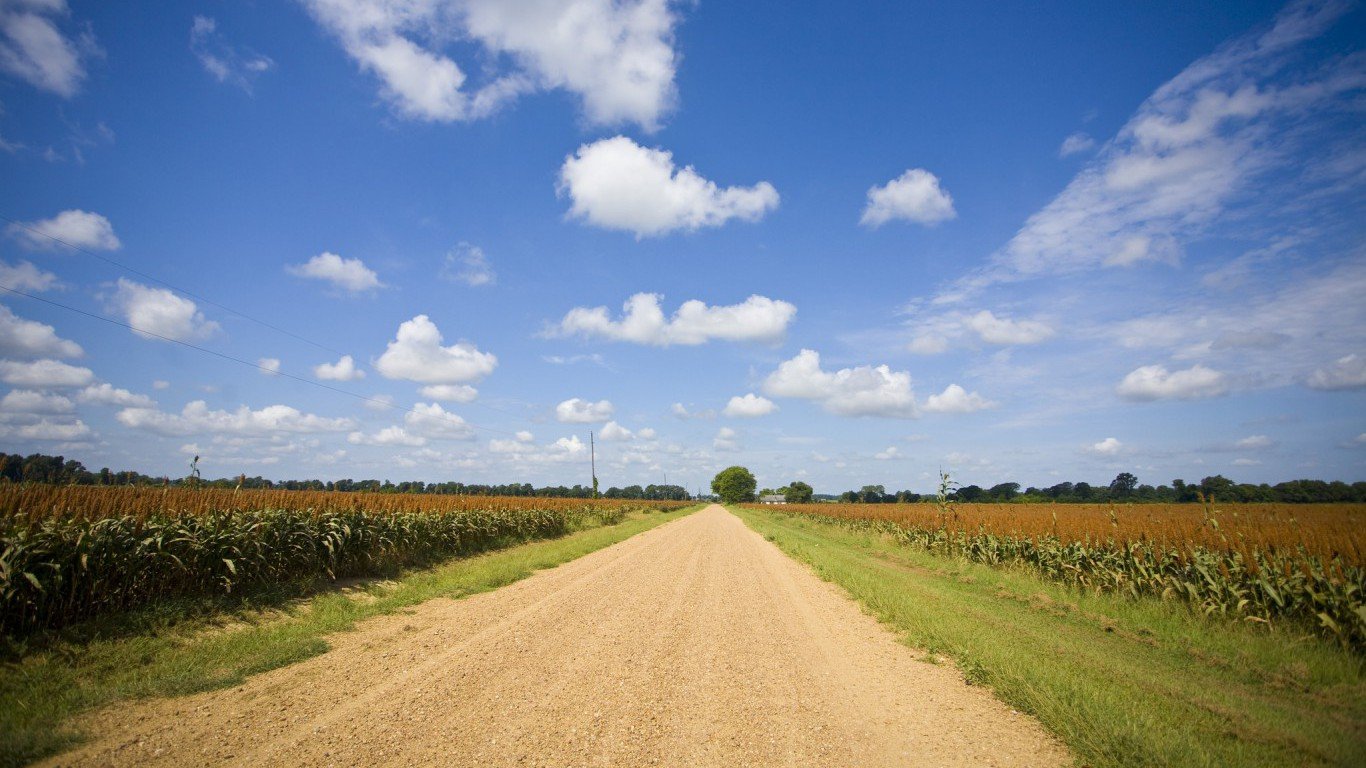
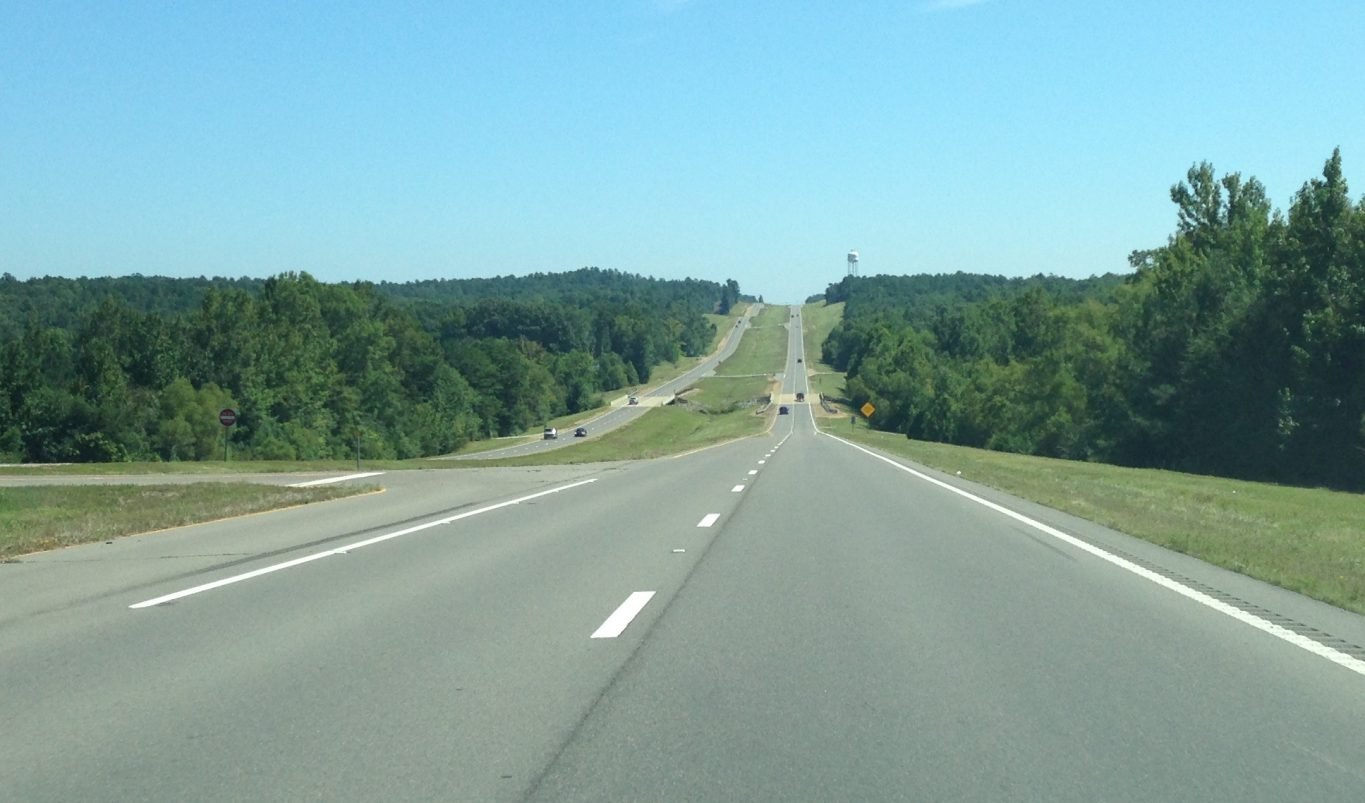
Among the most striking findings is the high correlation between a state’s motor vehicle death rate and the amount of rural land within the state. More than half of car deaths nationwide occur in rural areas, despite only 19% of Americans living in such areas. On rural roads, people tend to drive faster, are less likely to wear a seatbelt, and are more likely to encounter wild animals. In more rural states, drivers are more frequently exposed to these and other risks.
In Wyoming – the state with the highest motor vehicle death rate – 82% of all deaths take place on rural roads. In nearby North Dakota, the rate is even higher at 93%. In the comparatively safer Massachusetts, only 6% of motor vehicle deaths occur on rural roads.
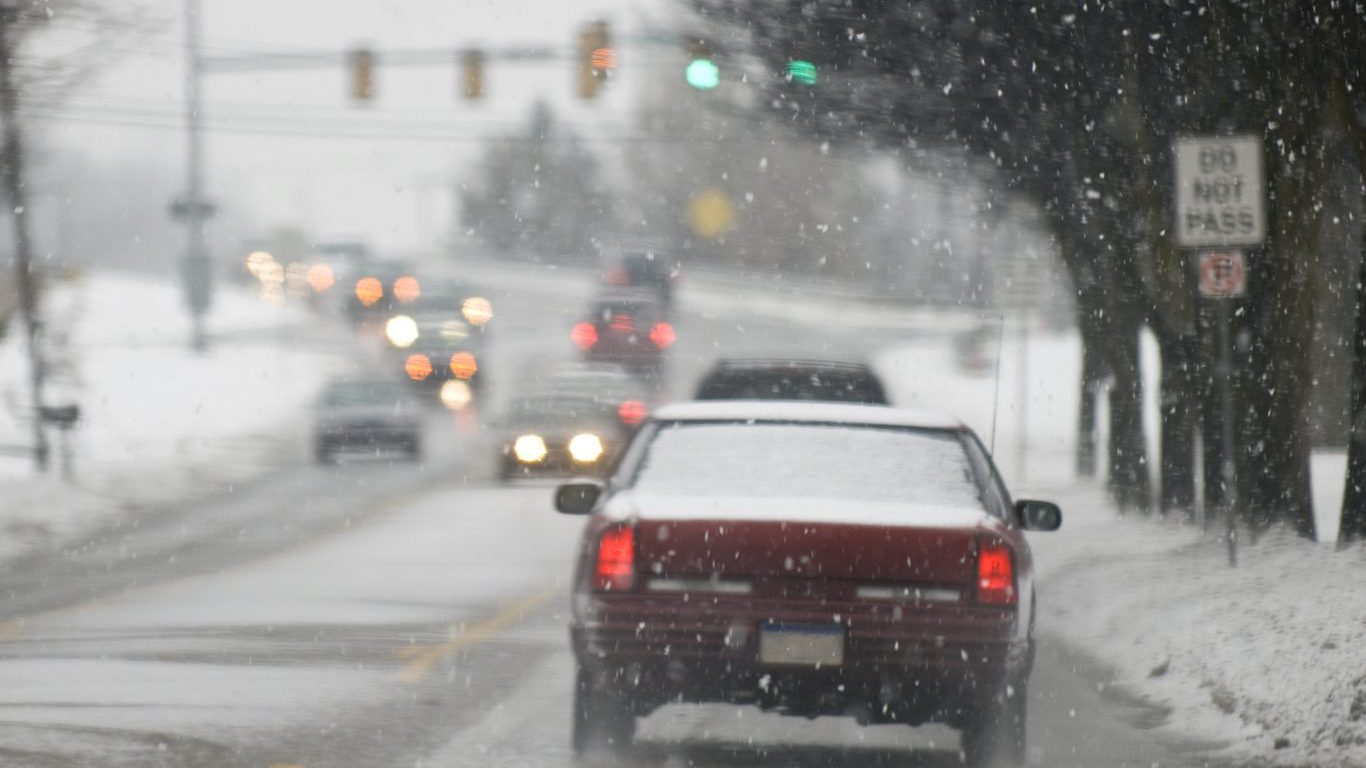
Drivers’ basic safety decisions behind the wheel can also have a big impact on the rate of fatal accidents. For example, unrestrained occupants in a vehicle – those who are not wearing a seat belt – are more likely to be killed in a crash than those who wear a seatbelt. Despite this fact, many states have a less than flawless rate of observed seat belt use, such as Massachusetts, where over one in four residents report failing to use a seat belt.
Alcohol consumption also plays a role in the rate of people killed in motor vehicle crashes. Not every state is equally diligent in reporting blood alcohol concentration (BAC) to make a precise comparison between all the states. However, judging from the data collected by states that provide a significant amount, alcohol clearly makes a difference in safety outcomes. In Alaska, 48% of fatally injured drivers tested had a BAC that was greater than or equal to 0.08%. In the significantly safer New Jersey, only 21% of tested drivers killed had comparable BACs.
Methodology:
To rank the safest and most dangerous states to drive in the United States, 24/7 Wall St. reviewed state by state fatality data from the Insurance Institute for Highway Safety (IIHS) along with urban and rural travel data from the Federal Highway Administration (FHA), each for 2015. The number of fatal roadway deaths was then adjusted for population, noted as fatalities per 100,000 residents. Blood alcohol content levels among driver fatalities, seat belt use rates, and the share of fatal accidents on urban roads are also from IIHS and are all for 2015. Fatal injuries due to vehicle accidents include pedestrian and cyclist fatalities. States reporting driver BAC levels during fatal accidents tested victims at varying rates.
Are you ready for retirement? Planning for retirement can be overwhelming, that’s why it could be a good idea to speak to a fiduciary financial advisor about your goals today.
Start by taking this retirement quiz right here from SmartAsset that will match you with up to 3 financial advisors that serve your area and beyond in 5 minutes. Smart Asset is now matching over 50,000 people a month.
Click here now to get started.
Thank you for reading! Have some feedback for us?
Contact the 24/7 Wall St. editorial team.


 24/7 Wall St.
 24/7 Wall St.
 24/7 Wall St.
 24/7 Wall St.