States With the Most Dangerous Weather
August 1, 2017 by Thomas FrohlichTropical Storm Emily slammed the coast of Florida in late July. It’s storm season, and while ocean storms like Emily are difficult to anticipate and may certainly wreak havoc, for Florida and other coastal states such weather events are normal for the season.
Still, the elements take many forms, and even states that routinely experience extreme weather can be caught off guard. Be it roof-wrenching winds, scorching heat, torrential rainfalls, life-ending lightning strikes, or freezing cold, every state gets a taste of nature’s raw power.
Most agree that weather is dangerous. Just over 11,000 deaths and nearly 70,000 weather-related injuries were reported across the country between 2012 and 2016. The danger of extreme weather seems to know no boundary. Each year, victims may have been at home, outside, camping, golfing, playing sports, boating, swimming, or talking on the phone. Weather-related fatality-rates also vary considerably between states.
24/7 Wall St. aggregated injury and fatality data over a five-year period in every state using data compiled by the National Weather Service.
Click here to see the states with the most dangerous weather.
Click here to see our detailed findings and methodology.
50. Massachusetts
> Fatalities per 1M people: 1.0
> Total fatalities 2012-2016: 7 (9th lowest)
> Injuries per 1M people: 3.7 (the lowest)
> Top cause of weather death in 2016: Wind-related (2 deaths)
> Total damage 2012-2016: $93.1 million (12th lowest)
> Median household income: $70,628 (6th highest)
[in-text-ad]

49. Connecticut
> Fatalities per 1M people: 1.4
> Total fatalities 2012-2016: 5 (7th lowest)
> Injuries per 1M people: 6.4 (4th lowest)
> Top cause of weather death in 2016: N/A (0 deaths)
> Total damage 2012-2016: $123.8 million (15th lowest)
> Median household income: $71,346 (5th highest)
 24/7 Wall St.
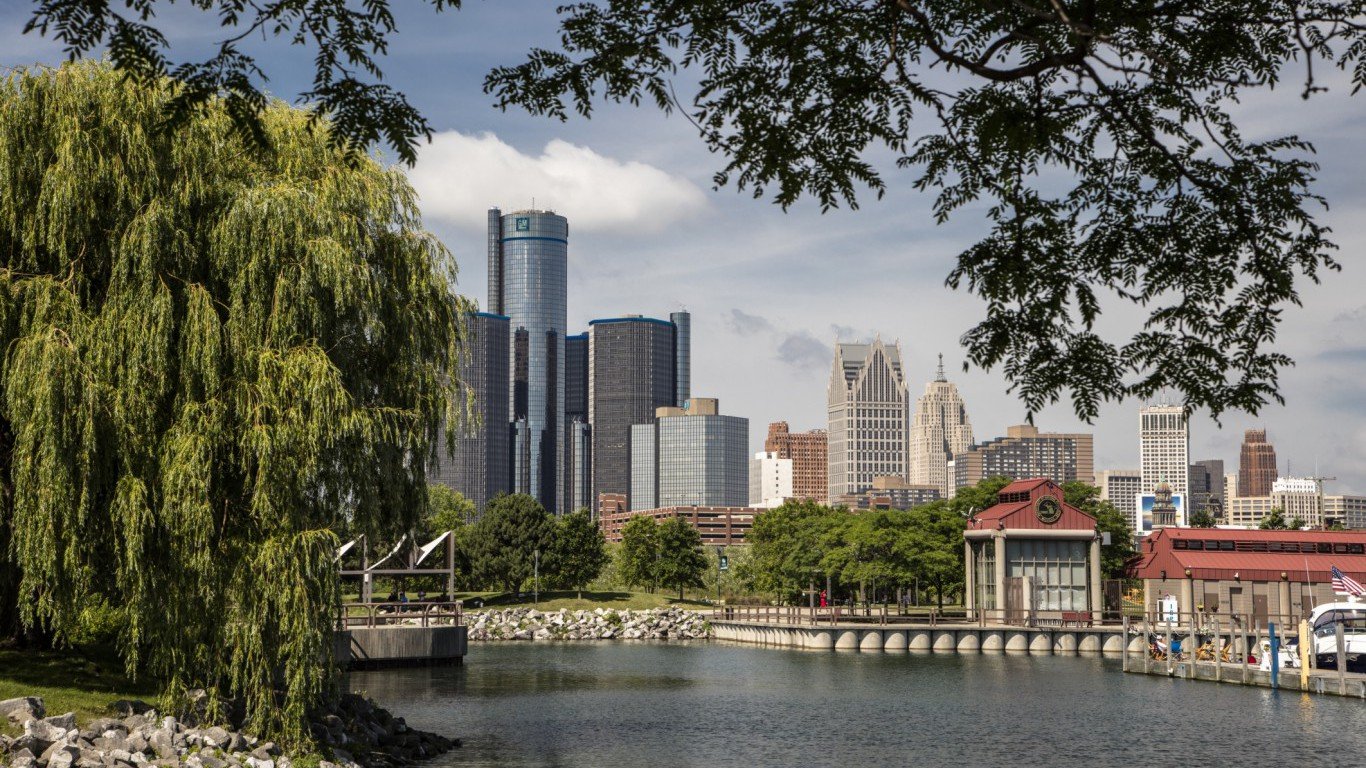
48. Michigan
> Fatalities per 1M people: 1.4
> Total fatalities 2012-2016: 14 (15th lowest)
> Injuries per 1M people: 32.6 (16th highest)
> Top cause of weather death in 2016: Lightning (2 deaths)
> Total damage 2012-2016: $2.33 billion (10th highest)
> Median household income: $51,084 (18th lowest)

47. Maine
> Fatalities per 1M people: 1.5
> Total fatalities 2012-2016: 2 (4th lowest)
> Injuries per 1M people: 6.0 (3rd lowest)
> Top cause of weather death in 2016: N/A (0 deaths)
> Total damage 2012-2016: $15.9 million (4th lowest)
> Median household income: $51,494 (21st lowest)
[in-text-ad-2]

46. Rhode island
> Fatalities per 1M people: 1.9
> Total fatalities 2012-2016: 2 (4th lowest)
> Injuries per 1M people: 4.8 (2nd lowest)
> Top cause of weather death in 2016: N/A (0 deaths)
> Total damage 2012-2016: $14.9 million (3rd lowest)
> Median household income: $58,073 (19th highest)

45. Ohio
> Fatalities per 1M people: 1.9
> Total fatalities 2012-2016: 22 (20th lowest)
> Injuries per 1M people: 12.1 (11th lowest)
> Top cause of weather death in 2016: Lightning (1 death)
> Total damage 2012-2016: $333.9 million (22nd highest)
> Median household income: $51,075 (17th lowest)
[in-text-ad]

44. Delaware
> Fatalities per 1M people: 2.1
> Total fatalities 2012-2016: 2 (4th lowest)
> Injuries per 1M people: 31.16 (19th highest)
> Top cause of weather death in 2016: N/A (0 deaths)
> Total damage 2012-2016: $9.8 million (2nd lowest)
> Median household income: $61,255 (14th highest)
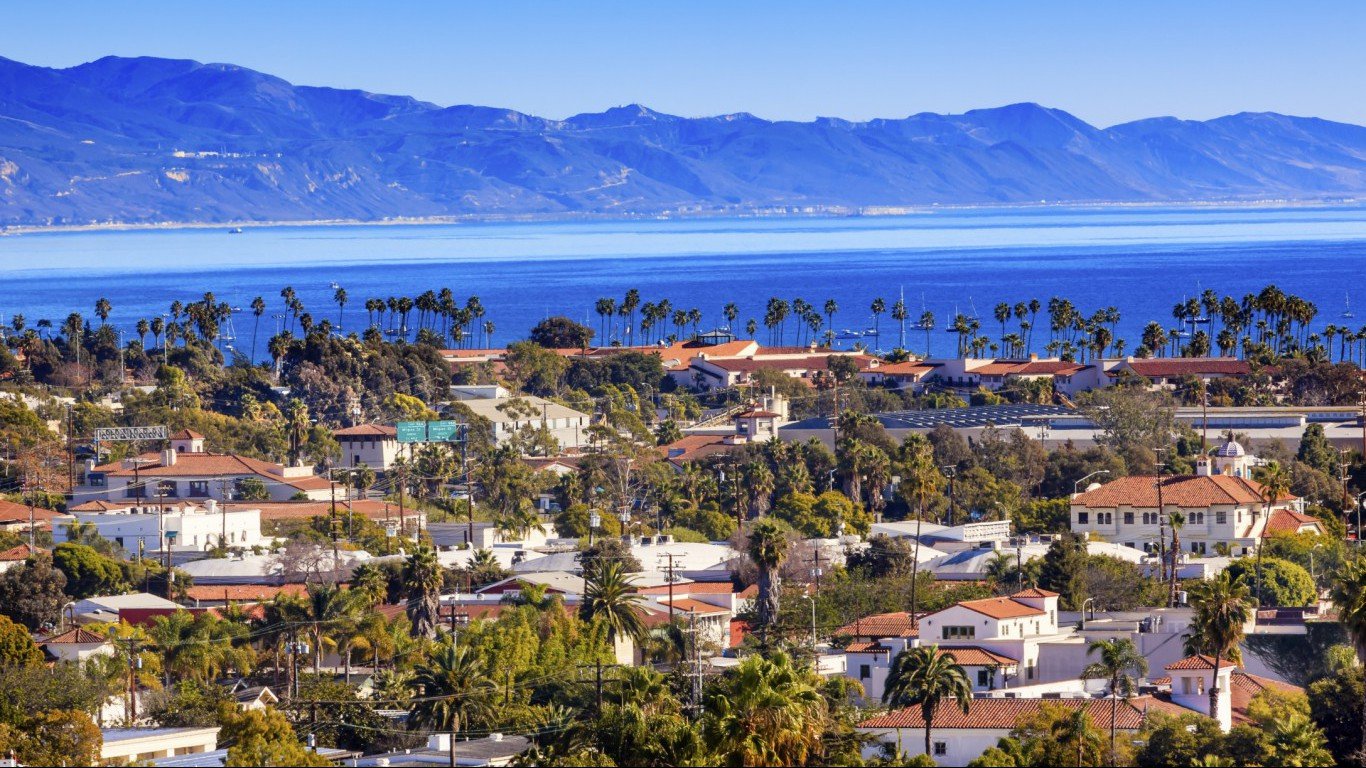
43. California
> Fatalities per 1M people: 2.3
> Total fatalities 2012-2016: 88 (8th highest)
> Injuries per 1M people: 7.5 (5th lowest)
> Top cause of weather death in 2016: Wind-related (7 deaths)
> Total damage 2012-2016: $2.29 billion (11th highest)
> Median household income: $64,500 (9th highest)

42. Georgia
> Fatalities per 1M people: 2.7
> Total fatalities 2012-2016: 27 (24th lowest)
> Injuries per 1M people: 16.3 (16th lowest)
> Top cause of weather death in 2016: Wind-related (4 deaths)
> Total damage 2012-2016: $260.5 million (24th lowest)
> Median household income: $51,244 (19th lowest)
[in-text-ad-2]

41. North dakota
> Fatalities per 1M people: 2.7
> Total fatalities 2012-2016: 2 (4th lowest)
> Injuries per 1M people: 24.8 (25th highest)
> Top cause of weather death in 2016: N/A (0 deaths)
> Total damage 2012-2016: $144.9 million (17th lowest)
> Median household income: $60,557 (16th highest)

40. New hampshire
> Fatalities per 1M people: 3.0
> Total fatalities 2012-2016: 4 (6th lowest)
> Injuries per 1M people: 53.6 (10th highest)
> Top cause of weather death in 2016: Cold-related (1 death)
> Total damage 2012-2016: $30.9 million (5th lowest)
> Median household income: $70,303 (7th highest)
[in-text-ad]

39. Virginia
> Fatalities per 1M people: 3.5
> Total fatalities 2012-2016: 29 (25th lowest)
> Injuries per 1M people: 23.6 (25th lowest)
> Top cause of weather death in 2016: Wind-related (4 deaths)
> Total damage 2012-2016: $2.77 billion (8th highest)
> Median household income: $66,262 (8th highest)
 24/7 Wall St.
38. Nebraska
> Fatalities per 1M people: 3.7
> Total fatalities 2012-2016: 7 (9th lowest)
> Injuries per 1M people: 67.7 (7th highest)
> Top cause of weather death in 2016: (0 deaths)
> Total damage 2012-2016: $1.29 billion (12th highest)
> Median household income: $54,996 (24th highest)

37. Pennsylvania
> Fatalities per 1M people: 4.0
> Total fatalities 2012-2016: 51 (16th highest)
> Injuries per 1M people: 7.7 (6th lowest)
> Top cause of weather death in 2016: Wind-related (4 deaths)
> Total damage 2012-2016: $270.7 million (25th lowest)
> Median household income: $55,702 (21st highest)
[in-text-ad-2]

36. Maryland
> Fatalities per 1M people: 4.0
> Total fatalities 2012-2016: 24 (22nd lowest)
> Injuries per 1M people: 8.4 (7th lowest)
> Top cause of weather death in 2016: Flood (2 deaths)
> Total damage 2012-2016: $101.6 million (14th lowest)
> Median household income: $75,847 (the highest)

35. Kansas
> Fatalities per 1M people: 4.1
> Total fatalities 2012-2016: 12 (11th lowest)
> Injuries per 1M people: 41.1 (14th highest)
> Top cause of weather death in 2016: Flood (2 deaths)
> Total damage 2012-2016: $884.0 million (15th highest)
> Median household income: $53,906 (24th lowest)
[in-text-ad]

34. New jersey
> Fatalities per 1M people: 4.4
> Total fatalities 2012-2016: 39 (23rd highest)
> Injuries per 1M people: 64.2 (8th highest)
> Top cause of weather death in 2016: N/A (0 deaths)
> Total damage 2012-2016: $25.33 billion (the highest)
> Median household income: $72,222 (4th highest)
 24/7 Wall St.
33. Minnesota
> Fatalities per 1M people: 4.8
> Total fatalities 2012-2016: 26 (23rd lowest)
> Injuries per 1M people: 51.1 (12th highest)
> Top cause of weather death in 2016: Wind-related (5 deaths)
> Total damage 2012-2016: $243.0 million (22nd lowest)
> Median household income: $63,488 (12th highest)

32. New york
> Fatalities per 1M people: 5.1
> Total fatalities 2012-2016: 100 (5th highest)
> Injuries per 1M people: 22.9 (24th lowest)
> Top cause of weather death in 2016: Lightning (4 deaths)
> Total damage 2012-2016: $627.3 million (16th highest)
> Median household income: $60,850 (15th highest)
[in-text-ad-2]

31. Iowa
> Fatalities per 1M people: 5.5
> Total fatalities 2012-2016: 17 (17th lowest)
> Injuries per 1M people: 29.4 (20th highest)
> Top cause of weather death in 2016: Flood (1 death)
> Total damage 2012-2016: $4.05 billion (4th highest)
> Median household income: $54,736 (25th highest)

30. Oregon
> Fatalities per 1M people: 5.5
> Total fatalities 2012-2016: 22 (20th lowest)
> Injuries per 1M people: 9.1 (8th lowest)
> Top cause of weather death in 2016: Wind-related (1 death)
> Total damage 2012-2016: $88.8 million (11th lowest)
> Median household income: $54,148 (25th lowest)
[in-text-ad]
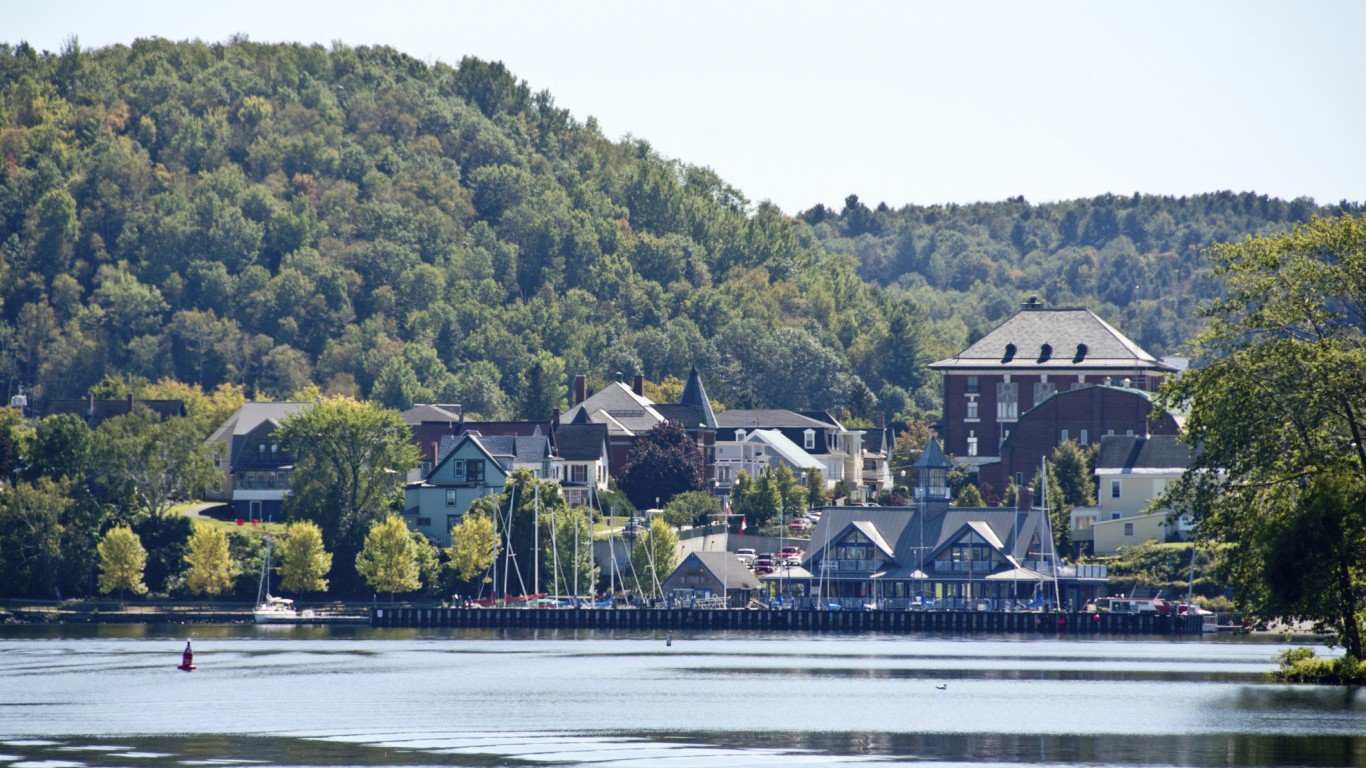
29. Vermont
> Fatalities per 1M people: 6.4
> Total fatalities 2012-2016: 4 (6th lowest)
> Injuries per 1M people: 14.4 (13th lowest)
> Top cause of weather death in 2016: Wind-related (1 death)
> Total damage 2012-2016: $58.9 million (7th lowest)
> Median household income: $56,990 (20th highest)

28. Indiana
> Fatalities per 1M people: 6.7
> Total fatalities 2012-2016: 44 (20th highest)
> Injuries per 1M people: 19.9 (21st lowest)
> Top cause of weather death in 2016: Wind-related (1 death)
> Total damage 2012-2016: $179.2 million (19th lowest)
> Median household income: $50,532 (16th lowest)

27. Florida
> Fatalities per 1M people: 7.0
> Total fatalities 2012-2016: 139 (4th highest)
> Injuries per 1M people: 15.5 (15th lowest)
> Top cause of weather death in 2016: Lightning (9 deaths)
> Total damage 2012-2016: $3.56 billion (5th highest)
> Median household income: $49,426 (13th lowest)
[in-text-ad-2]
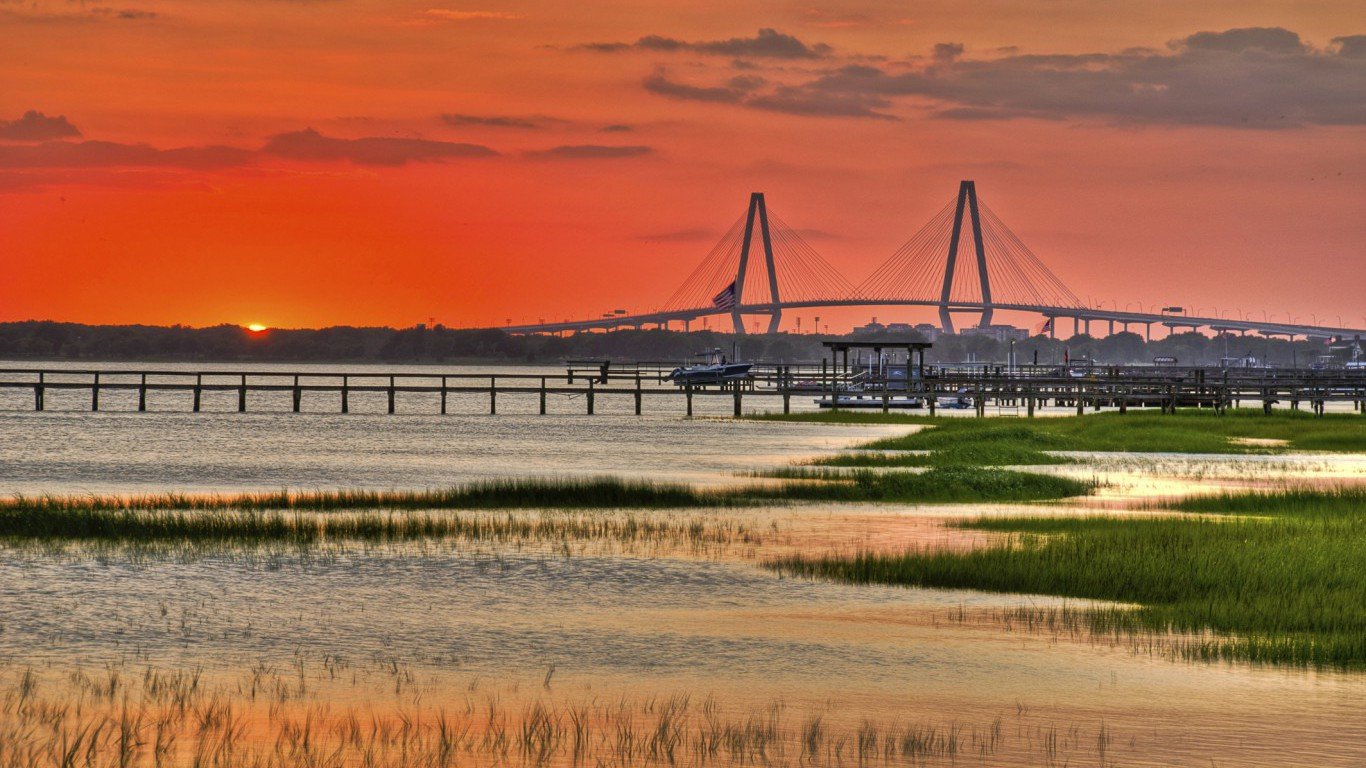
26. South carolina
> Fatalities per 1M people: 7.3
> Total fatalities 2012-2016: 35 (24th highest)
> Injuries per 1M people: 19.3 (19th lowest)
> Top cause of weather death in 2016: Tropical Cyclone (2 deaths)
> Total damage 2012-2016: $294.4 million (24th highest)
> Median household income: $47,238 (8th lowest)
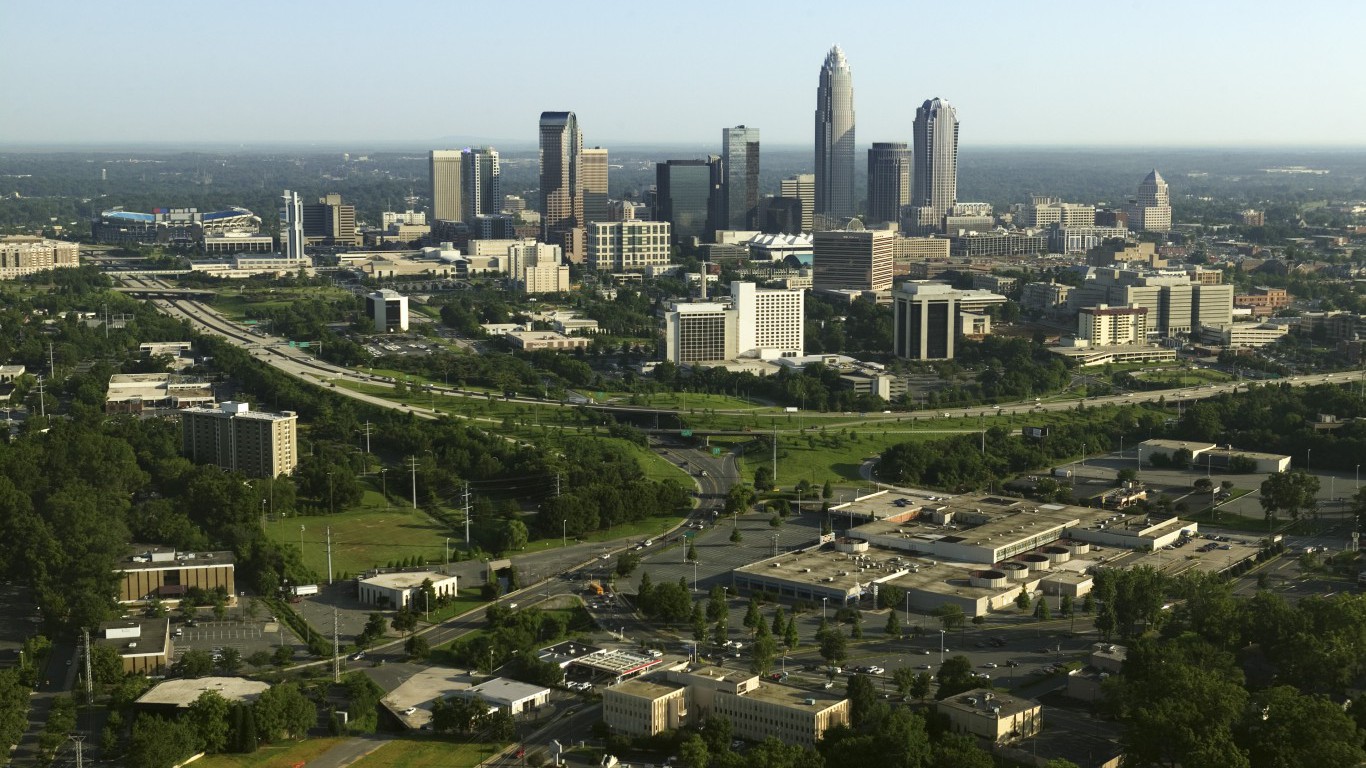
25. North carolina
> Fatalities per 1M people: 7.6
> Total fatalities 2012-2016: 75 (9th highest)
> Injuries per 1M people: 18.6 (18th lowest)
> Top cause of weather death in 2016: Wind-related (20 deaths)
> Total damage 2012-2016: $11.95 billion (13th highest)
> Median household income: $47,830 (10th lowest)
[in-text-ad]

24. Tennessee
> Fatalities per 1M people: 7.7
> Total fatalities 2012-2016: 50 (17th highest)
> Injuries per 1M people: 25.9 (24th highest)
> Top cause of weather death in 2016: Wind-related (4 deaths)
> Total damage 2012-2016: $441.4 million (19th highest)
> Median household income: $47,275 (9th lowest)

23. Texas
> Fatalities per 1M people: 7.7
> Total fatalities 2012-2016: 206 (the highest)
> Injuries per 1M people: 36.36 (15th highest)
> Top cause of weather death in 2016: Tornado (38 deaths)
> Total damage 2012-2016: $11.95 billion (2nd highest)
> Median household income: $55,653 (22nd highest)

22. Hawaii
> Fatalities per 1M people: 9.2
> Total fatalities 2012-2016: 13 (13th lowest)
> Injuries per 1M people: 14.9 (14th lowest)
> Top cause of weather death in 2016: Flood (1 deaths)
> Total damage 2012-2016: $490,000 (the lowest)
> Median household income: $73,486 (2nd highest)
[in-text-ad-2]
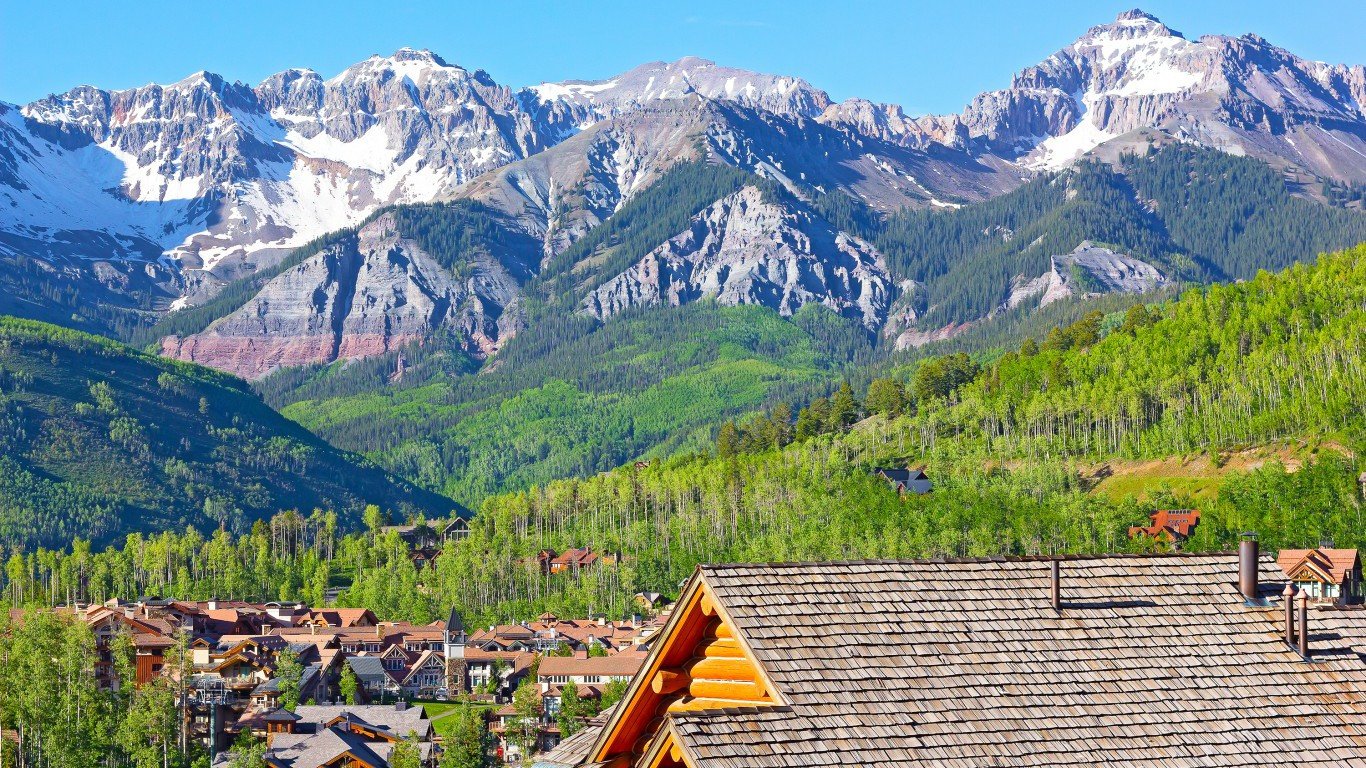
21. Colorado
> Fatalities per 1M people: 9.4
> Total fatalities 2012-2016: 50 (17th highest)
> Injuries per 1M people: 21.0 (22nd lowest)
> Top cause of weather death in 2016: Lightning (2 deaths)
> Total damage 2012-2016: $2.4 billion (9th highest)
> Median household income: $63,909 (11th highest)
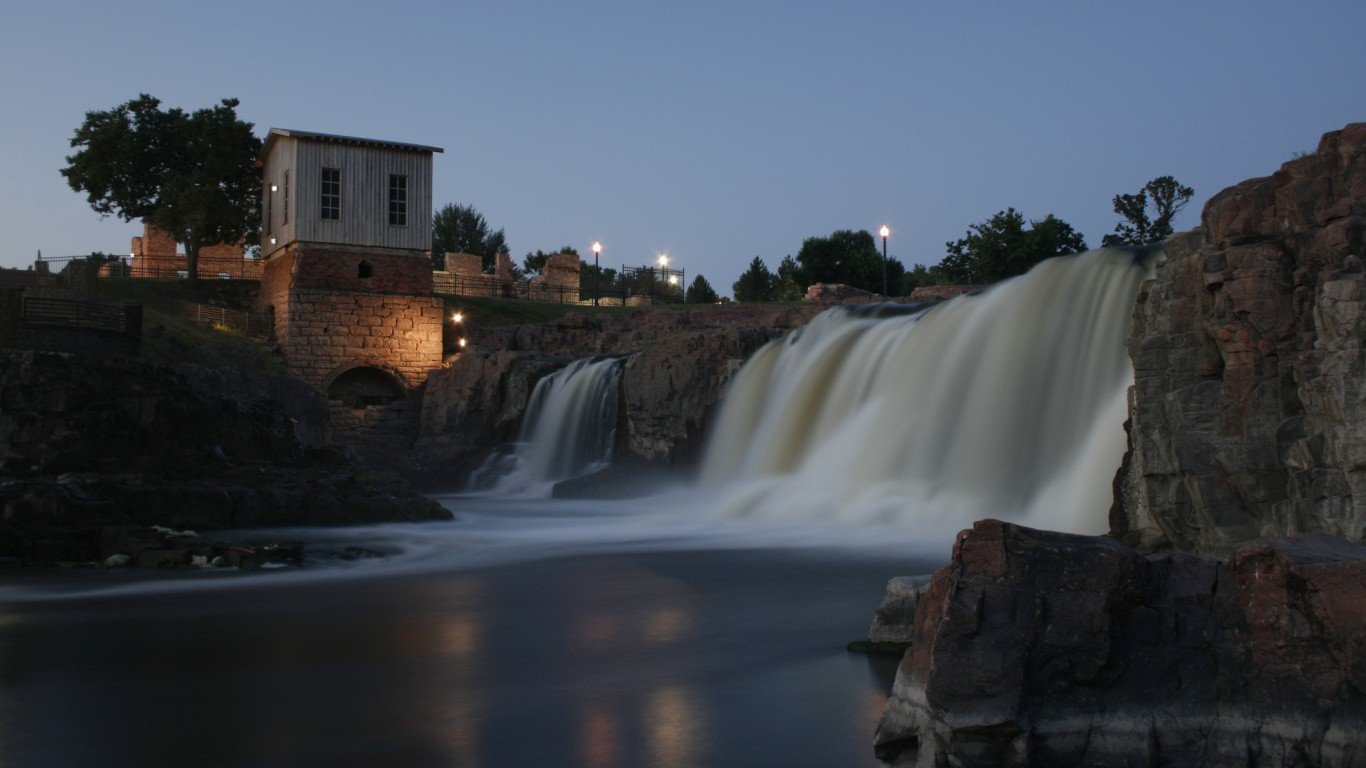
20. South dakota
> Fatalities per 1M people: 9.4
> Total fatalities 2012-2016: 8 (10th lowest)
> Injuries per 1M people: 52.0 (11th highest)
> Top cause of weather death in 2016: N/A (0 deaths)
> Total damage 2012-2016: $191.3 million (20th lowest)
> Median household income: $53,017 (23rd lowest)
[in-text-ad]

19. Louisiana
> Fatalities per 1M people: 9.5
> Total fatalities 2012-2016: 44 (20th highest)
> Injuries per 1M people: 29.34 (21st highest)
> Top cause of weather death in 2016: Tornado (15 deaths)
> Total damage 2012-2016: $10.33 billion (3rd highest)
> Median household income: $45,727 (7th lowest)
 24/7 Wall St.
18. Arizona
> Fatalities per 1M people: 10.0
> Total fatalities 2012-2016: 67 (12th highest)
> Injuries per 1M people: 19.4 (20th lowest)
> Top cause of weather death in 2016: Lightning (9 deaths)
> Total damage 2012-2016: $276.4 million (25th highest)
> Median household income: $51,492 (20th lowest)

17. Washington
> Fatalities per 1M people: 10.4
> Total fatalities 2012-2016: 73 (10th highest)
> Injuries per 1M people: 9.7 (9th lowest)
> Top cause of weather death in 2016: Wind-related (1 death)
> Total damage 2012-2016: $379.5 million (21st highest)
> Median household income: $64,129 (10th highest)
[in-text-ad-2]

16. Wisconsin
> Fatalities per 1M people: 10.4
> Total fatalities 2012-2016: 60 (13th highest)
> Injuries per 1M people: 18.1 (17th lowest)
> Top cause of weather death in 2016: Lightning (12 deaths)
> Total damage 2012-2016: $176.9 million (18th lowest)
> Median household income: $55,638 (23rd highest)

15. Alabama
> Fatalities per 1M people: 10.8
> Total fatalities 2012-2016: 52 (15th highest)
> Injuries per 1M people: 55.9 (9th highest)
> Top cause of weather death in 2016: Tornado (4 deaths)
> Total damage 2012-2016: $73.2 million (8th lowest)
> Median household income: $44,765 (4th lowest)
[in-text-ad]

14. New mexico
> Fatalities per 1M people: 11.0
> Total fatalities 2012-2016: 23 (21st lowest)
> Injuries per 1M people: 26.4 (23rd highest)
> Top cause of weather death in 2016: Flood (3 deaths)
> Total damage 2012-2016: $86.4 million (10th lowest)
> Median household income: $45,382 (6th lowest)

13. Illinois
> Fatalities per 1M people: 11.7
> Total fatalities 2012-2016: 150 (2nd highest)
> Injuries per 1M people: 32.0 (17th highest)
> Top cause of weather death in 2016: Wind-related (6 deaths)
> Total damage 2012-2016: $3.13 billion (7th highest)
> Median household income: $59,588 (18th highest)

12. Idaho
> Fatalities per 1M people: 12.9
> Total fatalities 2012-2016: 21 (18th lowest)
> Injuries per 1M people: 11.1 (10th lowest)
> Top cause of weather death in 2016: N/A (0 deaths)
> Total damage 2012-2016: $571.9 million (17th highest)
> Median household income: $48,275 (11th lowest)
[in-text-ad-2]

11. Montana
> Fatalities per 1M people: 13.7
> Total fatalities 2012-2016: 14 (15th lowest)
> Injuries per 1M people: 31.4 (18th highest)
> Top cause of weather death in 2016: Wind-related (1 death)
> Total damage 2012-2016: $98.8 million (13th lowest)
> Median household income: $49,509 (14th lowest)

10. Mississippi
> Fatalities per 1M people: 14.4
> Total fatalities 2012-2016: 43 (22nd highest)
> Injuries per 1M people: 142.2 (5th highest)
> Top cause of weather death in 2016: Lightning (3 deaths)
> Total damage 2012-2016: $920.1 million (14th highest)
> Median household income: $40,593 (the lowest)
[in-text-ad]

9. Missouri
> Fatalities per 1M people: 14.9
> Total fatalities 2012-2016: 90 (7th highest)
> Injuries per 1M people: 191.1 (4th highest)
> Top cause of weather death in 2016: Lightning (4 deaths)
> Total damage 2012-2016: $405.4 million (20th highest)
> Median household income: $50,238 (15th lowest)

8. Kentucky
> Fatalities per 1M people: 15.7
> Total fatalities 2012-2016: 69 (11th highest)
> Injuries per 1M people: 77.7 (6th highest)
> Top cause of weather death in 2016: Wind-related (1 death)
> Total damage 2012-2016: $218.7 million (21st lowest)
> Median household income: $45,215 (5th lowest)

7. Utah
> Fatalities per 1M people: 16.7
> Total fatalities 2012-2016: 49 (19th highest)
> Injuries per 1M people: 26.7 (22nd highest)
> Top cause of weather death in 2016: Lightning (1 death)
> Total damage 2012-2016: $134.3 million (16th lowest)
> Median household income: $62,912 (13th highest)
[in-text-ad-2]
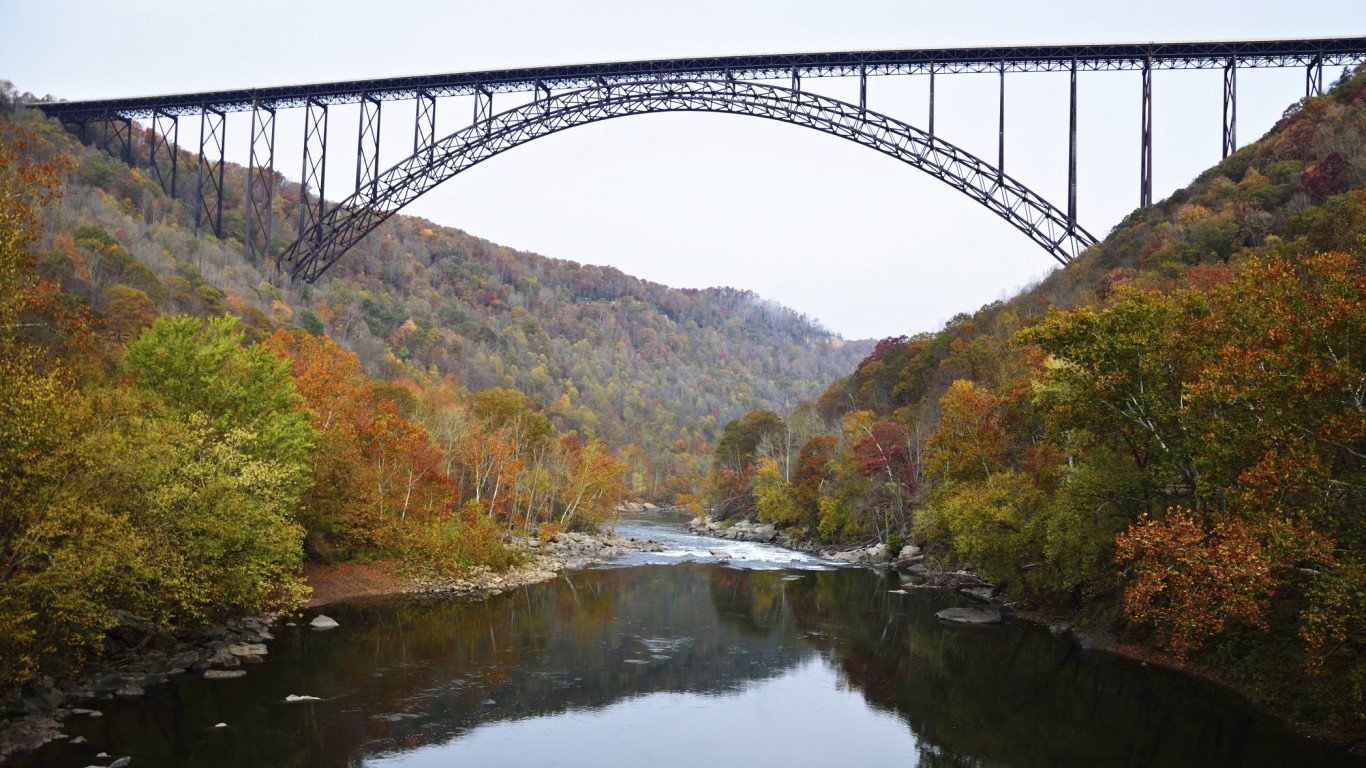
6. West virginia
> Fatalities per 1M people: 17.3
> Total fatalities 2012-2016: 32 (25th highest)
> Injuries per 1M people: 21.7 (23rd lowest)
> Top cause of weather death in 2016: Flood (24 deaths)
> Total damage 2012-2016: $324.0 million (23rd highest)
> Median household income: $42,019 (3rd lowest)
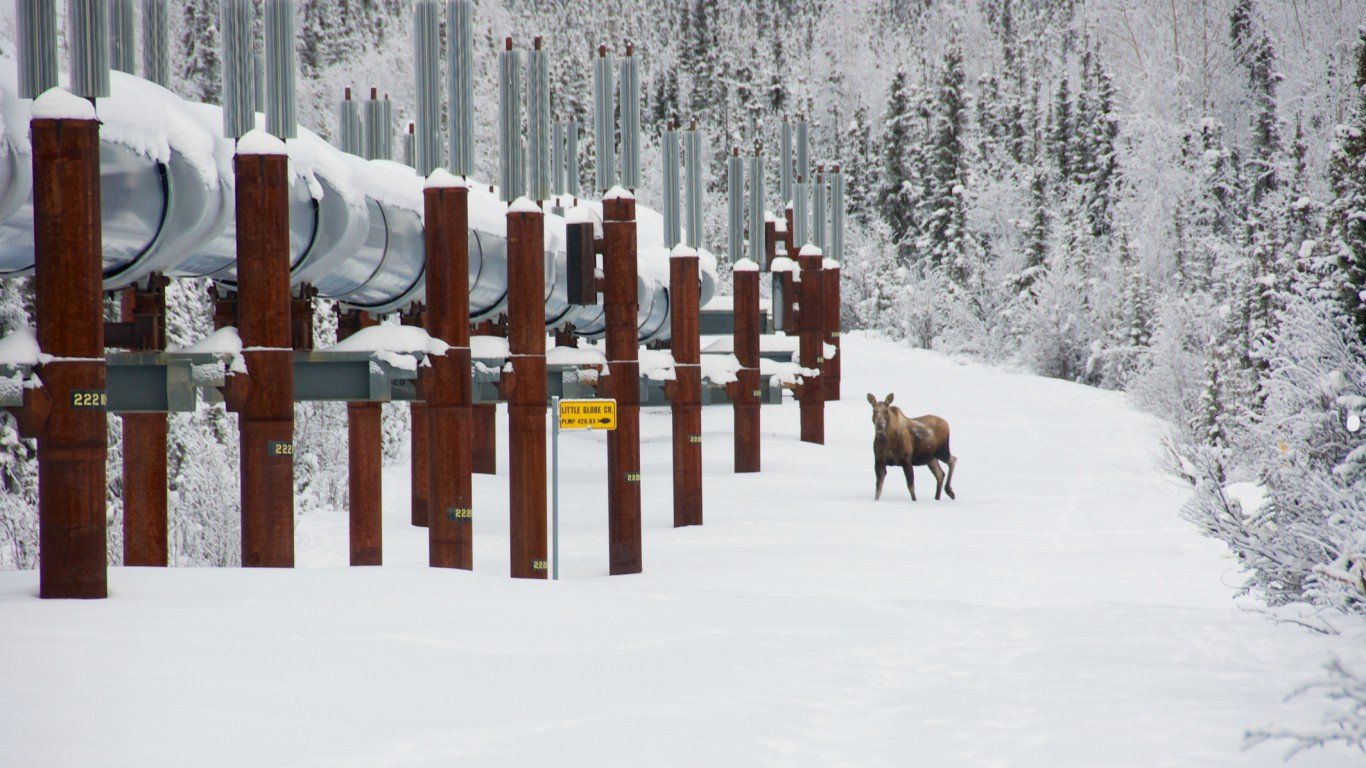
5. Alaska
> Fatalities per 1M people: 17.7
> Total fatalities 2012-2016: 13 (13th lowest)
> Injuries per 1M people: 13.6 (12th lowest)
> Top cause of weather death in 2016: N/A (0 deaths)
> Total damage 2012-2016: $81.3 million (9th lowest)
> Median household income: $73,355 (3rd highest)
[in-text-ad]

4. Arkansas
> Fatalities per 1M people: 17.9
> Total fatalities 2012-2016: 53 (14th highest)
> Injuries per 1M people: 363.5 (the highest)
> Top cause of weather death in 2016: Heat (1 death)
> Total damage 2012-2016: $547.3 million (18th highest)
> Median household income: $41,995 (2nd lowest)

3. Oklahoma
> Fatalities per 1M people: 24.9
> Total fatalities 2012-2016: 96 (6th highest)
> Injuries per 1M people: 207.7 (3rd highest)
> Top cause of weather death in 2016: Tornado (6 deaths)
> Total damage 2012-2016: $3.21 billion (6th highest)
> Median household income: $48,568 (12th lowest)

2. Wyoming
> Fatalities per 1M people: 29.3
> Total fatalities 2012-2016: 17 (17th lowest)
> Injuries per 1M people: 46.5 (13th highest)
> Top cause of weather death in 2016: Cold-related (1 death)
> Total damage 2012-2016: $39.8 million (6th lowest)
> Median household income: $60,214 (17th highest)
[in-text-ad-2]

1. Nevada
> Fatalities per 1M people: 51.7
> Total fatalities 2012-2016: 146 (3rd highest)
> Injuries per 1M people: 218.6 (2nd highest)
> Top cause of weather death in 2016: Heat (50 deaths)
> Total damage 2012-2016: $259.9 million (23rd lowest)
> Median household income: $52,431 (22nd lowest)
Detailed Findings and Methodology:
The most deaths in a single state from any one weather event last year occurred in Nevada, where 50 people died from heat in 2016 alone. Across all states, floods were the leading cause of weather-related deaths, documented as the cause in 126 cases over the course of 2016.
Weather fatality trends are erratic and tend to cluster in certain places across the country. So relatively few states actually report fatality rates that exceed the five-year average of 34.8 deaths per 1 million people nationwide.
While geography and climate are the leading causes of dangerous weather events, poverty amplifies their negative effects. According to a 2014 report from the Centers for Disease Control and Prevention, which focused on heat and cold-related fatalities, weather-related death rates are “2 to 7 times as high in low-income counties as in high-income counties” This is likely because those living below the poverty line do not have the means to prepare for or adapt to extreme weather events and conditions, according to the CDC.
The median household income is above the national rate in 13 of the 25 states with the lower weather-related fatality rates. Of the remaining 25 states with higher weather-related death rates, seven have median household incomes that exceed the national average.
To determine the states with the most dangerous weather, 24/7 Wall St. compiled state by state fatality rates attributable to weather from the National Weather Service, a program of the National Oceanic and Atmospheric Administration (NOAA). We totalled all weather-related deaths from 2012 through 2016 and adjusted for every 1 million state residents. The total value of damage caused by weather events also came from the NWS. Population and poverty figures came from the U.S. Census Bureau’s 2015 American Community Survey.
Sponsored: Find a Qualified Financial Advisor
Finding a qualified financial advisor doesn’t have to be hard. SmartAsset’s free tool matches you with up to 3 fiduciary financial advisors in your area in 5 minutes. Each advisor has been vetted by SmartAsset and is held to a fiduciary standard to act in your best interests. If you’re ready to be matched with local advisors that can help you achieve your financial goals, get started now.