Cities With the Highest Poverty Rates
September 28, 2017 by Sam StebbinsOver half a century has passed since President Lyndon Johnson declared war on poverty — with the stated goal of eradicating and preventing serious financial hardship in the United States. Though Johnson’s vision was never realized, the U.S. poverty rate fell from 22.2% in 1960 to 12.1% in 1969. Americans have not benefitted from such a dramatic improvement since.
Today, the Department of Health and Human Services sets the poverty line at an annual income of $24,600 for a family of four living in the continental U.S. Though improvements are not as meaningful as they were in the 1960s, the U.S. poverty rate has fallen in recent years — from 15.9% in 2012 to 14.7% in 2015, to 14.0% in 2016.
Serious financial hardship remains very common in certain parts of the country. More than 1 in every 5 Americans live below the poverty line in 39 U.S. metro areas. 24/7 Wall St. reviewed metro area level poverty data from the U.S. Census Bureau to identify the cities with the highest poverty rates.
Click here to see the cities with the highest poverty rates.
Click here to see our detailed findings and methodology.
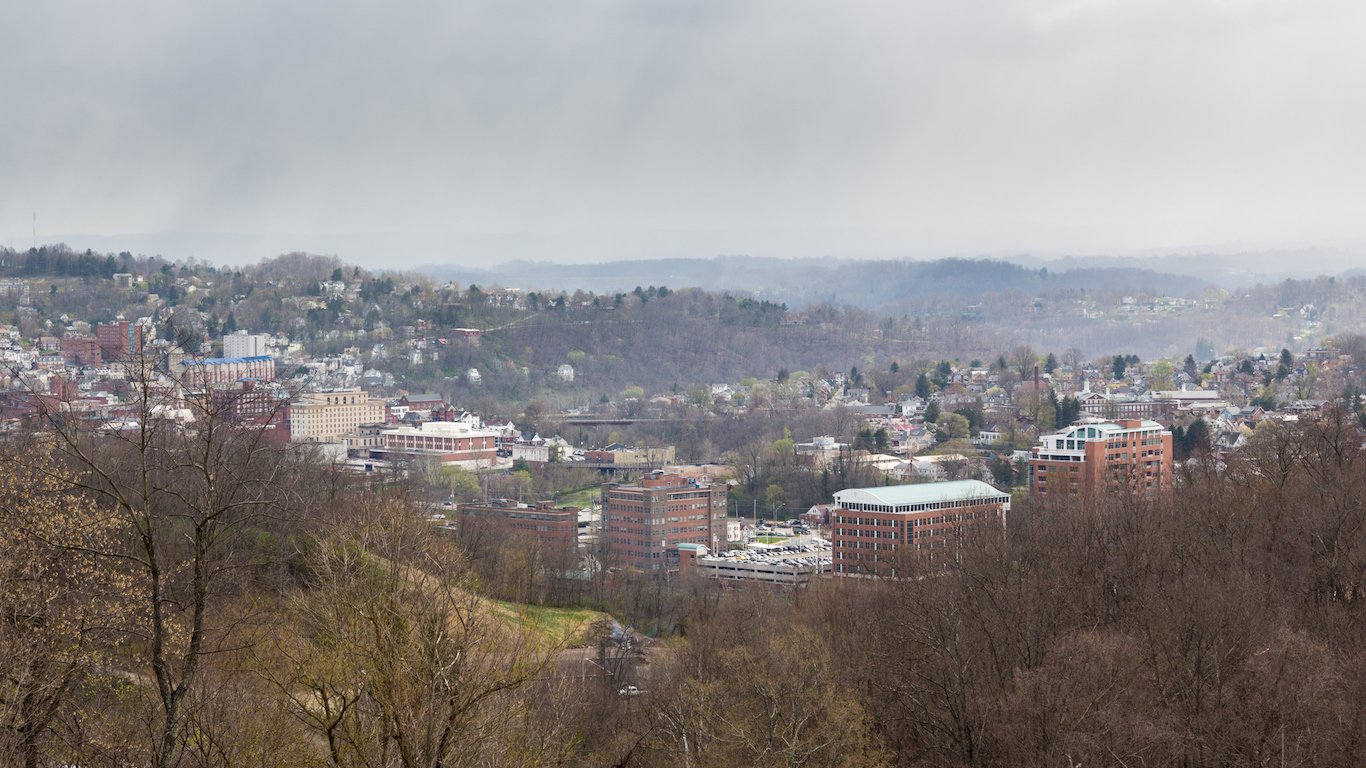
39. Morgantown, WV
> Poverty rate: 20.1%
> 2016 unemployment rate: 4.6%
> Households receiving SNAP benefits: 10.7%
> Households with income under $10,000: 11.8%
> Median household income: $50,120
[in-text-ad]

38. Flint, MI
> Poverty rate: 20.2% (tied)
> 2016 unemployment rate: 5.4%
> Households receiving SNAP benefits: 21.2%
> Households with income under $10,000: 10.2%
> Median household income: $43,955

37. Ithaca, NY
> Poverty rate: 20.2% (tied)
> 2016 unemployment rate: 4.1%
> Households receiving SNAP benefits: 10.7%
> Households with income under $10,000: 11.8%
> Median household income: $56,349

36. Lafayette, LA
> Poverty rate: 20.3% (tied)
> 2016 unemployment rate: 7.1%
> Households receiving SNAP benefits: 16.6%
> Households with income under $10,000: 10.4%
> Median household income: $45,409
[in-text-ad-2]

35. Madera, CA
> Poverty rate: 20.3% (tied)
> 2016 unemployment rate: 9.2%
> Households receiving SNAP benefits: 17%
> Households with income under $10,000: 7.3%
> Median household income: $51,657

34. Merced, CA
> Poverty rate: 20.3% (tied)
> 2016 unemployment rate: 10.5%
> Households receiving SNAP benefits: 22.6%
> Households with income under $10,000: 7.1%
> Median household income: $47,739
[in-text-ad]

33. Pueblo, CO
> Poverty rate: 20.3% (tied)
> 2016 unemployment rate: 4.9%
> Households receiving SNAP benefits: 15.9%
> Households with income under $10,000: 8.6%
> Median household income: $44,677
 24/7 Wall St.
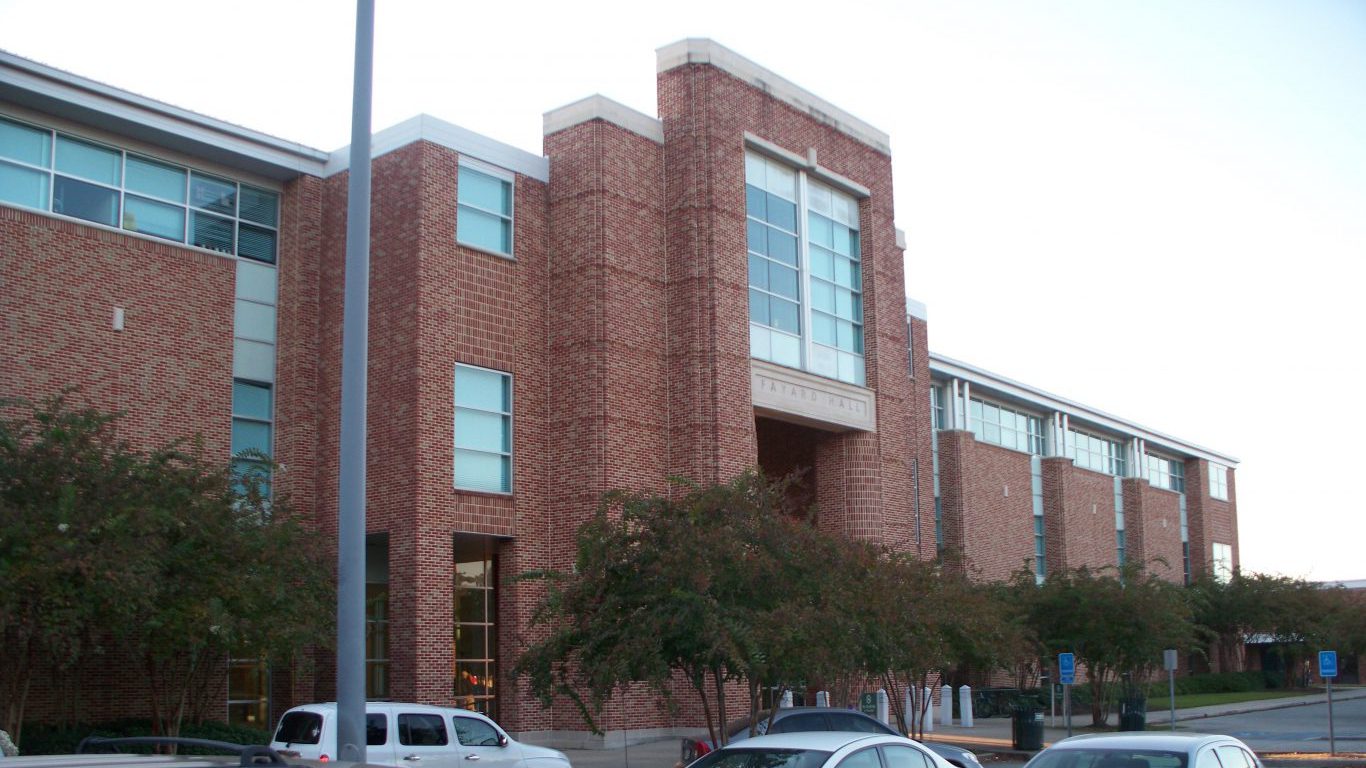
32. Hammond, LA
> Poverty rate: 20.4%
> 2016 unemployment rate: 6.7%
> Households receiving SNAP benefits: 24.4%
> Households with income under $10,000: 8.1%
> Median household income: $48,162

31. Corvallis, OR
> Poverty rate: 20.5%
> 2016 unemployment rate: 3.9%
> Households receiving SNAP benefits: 11.8%
> Households with income under $10,000: 10.9%
> Median household income: $55,459
[in-text-ad-2]
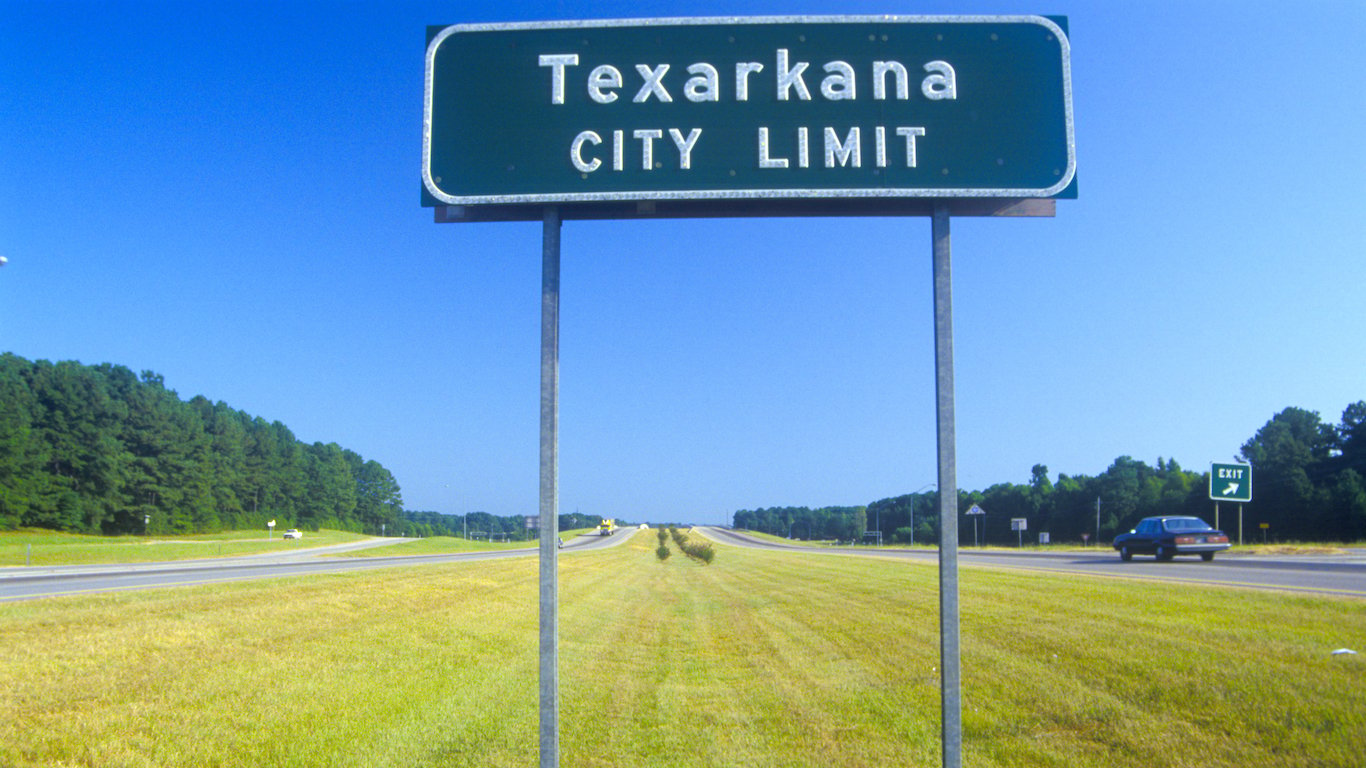
30. Texarkana, TX-AR
> Poverty rate: 20.6%
> 2016 unemployment rate: 4.6%
> Households receiving SNAP benefits: 13.5%
> Households with income under $10,000: 10.7%
> Median household income: $42,513

29. Athens-Clarke County, GA
> Poverty rate: 20.7%
> 2016 unemployment rate: 5.2%
> Households receiving SNAP benefits: 13.7%
> Households with income under $10,000: 9.1%
> Median household income: $43,165
[in-text-ad]

28. Lake Charles, LA
> Poverty rate: 20.8%
> 2016 unemployment rate: 4.8%
> Households receiving SNAP benefits: 13.5%
> Households with income under $10,000: 10.5%
> Median household income: $46,005
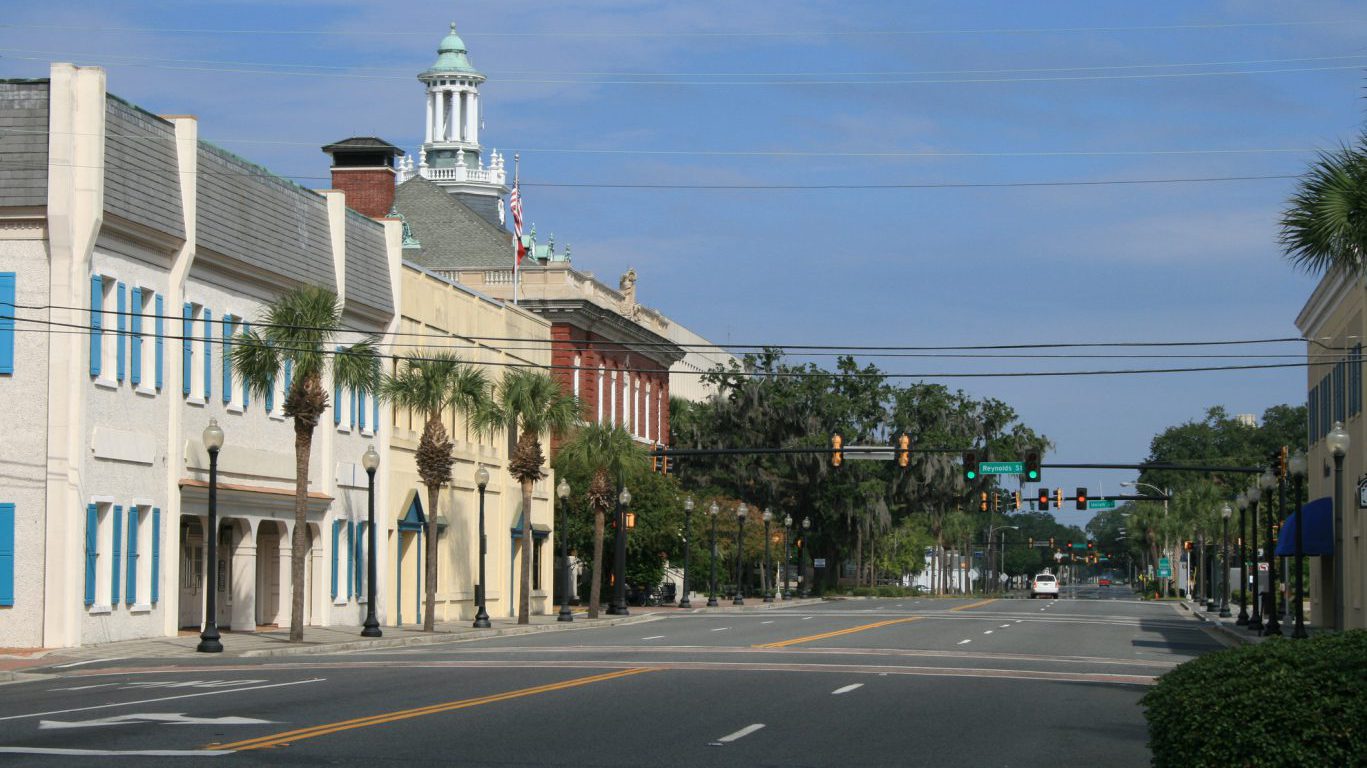
27. Brunswick, GA
> Poverty rate: 20.9%
> 2016 unemployment rate: 5.5%
> Households receiving SNAP benefits: 16.9%
> Households with income under $10,000: 7.9%
> Median household income: $46,014

26. Danville, IL
> Poverty rate: 20.9% (tied)
> 2016 unemployment rate: 7.2%
> Households receiving SNAP benefits: 16.6%
> Households with income under $10,000: 9.9%
> Median household income: $45,481
[in-text-ad-2]

25. Houma-Thibodaux, LA
> Poverty rate: 20.9% (tied)
> 2016 unemployment rate: 6.7%
> Households receiving SNAP benefits: 13.1%
> Households with income under $10,000: 7.8%
> Median household income: $49,929

24. Sumter, SC
> Poverty rate: 21.2%
> 2016 unemployment rate: 5.7%
> Households receiving SNAP benefits: 22.3%
> Households with income under $10,000: 10.6%
> Median household income: $40,614
[in-text-ad]

23. Ames, IA
> Poverty rate: 21.5%
> 2016 unemployment rate: 2.4%
> Households receiving SNAP benefits: 7.2%
> Households with income under $10,000: 10.6%
> Median household income: $53,371
 24/7 Wall St.
22. Muncie, IN
> Poverty rate: 21.6%
> 2016 unemployment rate: 5.2%
> Households receiving SNAP benefits: 14.9%
> Households with income under $10,000: 11.3%
> Median household income: $41,041
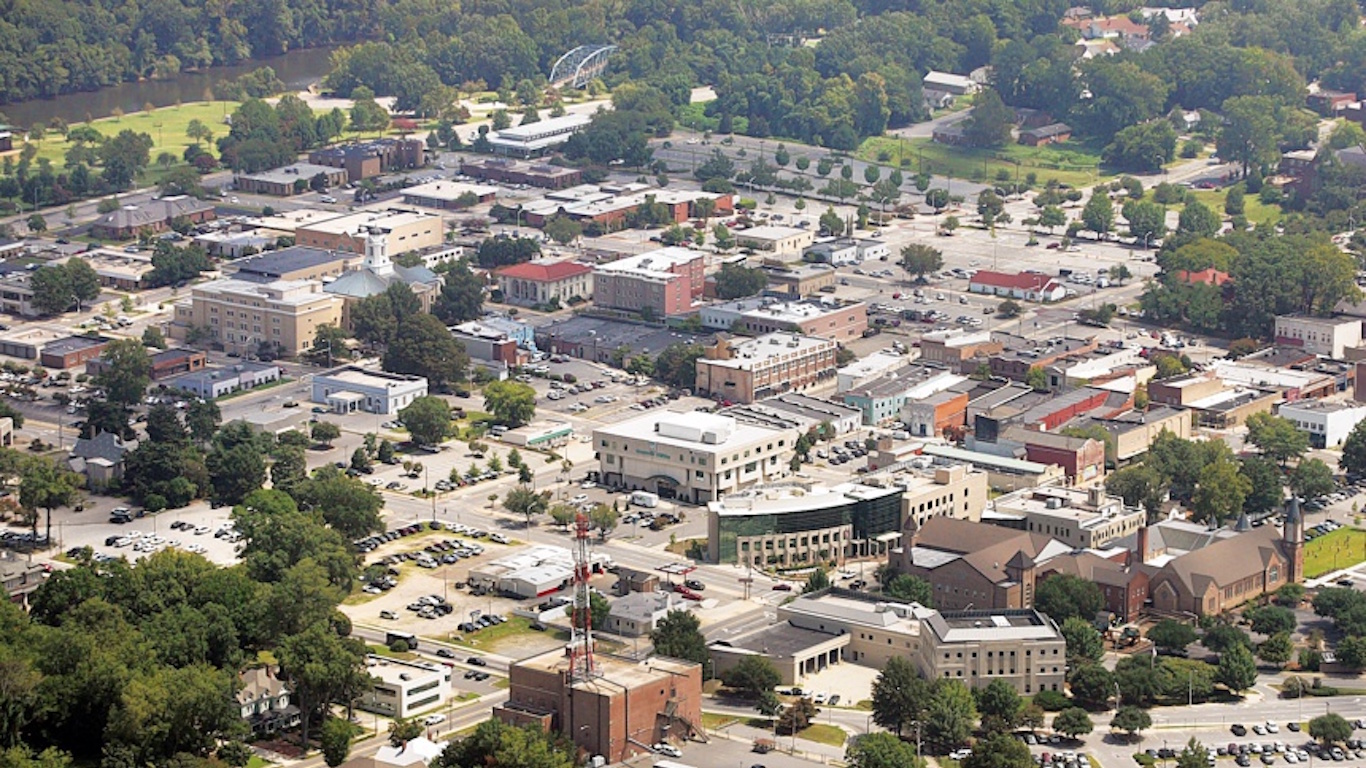
21. Greenville, NC
> Poverty rate: 21.7% (tied)
> 2016 unemployment rate: 5.5%
> Households receiving SNAP benefits: 15.4%
> Households with income under $10,000: 12.2%
> Median household income: $46,573
[in-text-ad-2]

20. Macon-Bibb County, GA
> Poverty rate: 21.7% (tied)
> 2016 unemployment rate: 5.8%
> Households receiving SNAP benefits: 17.3%
> Households with income under $10,000: 13.3%
> Median household income: $39,973

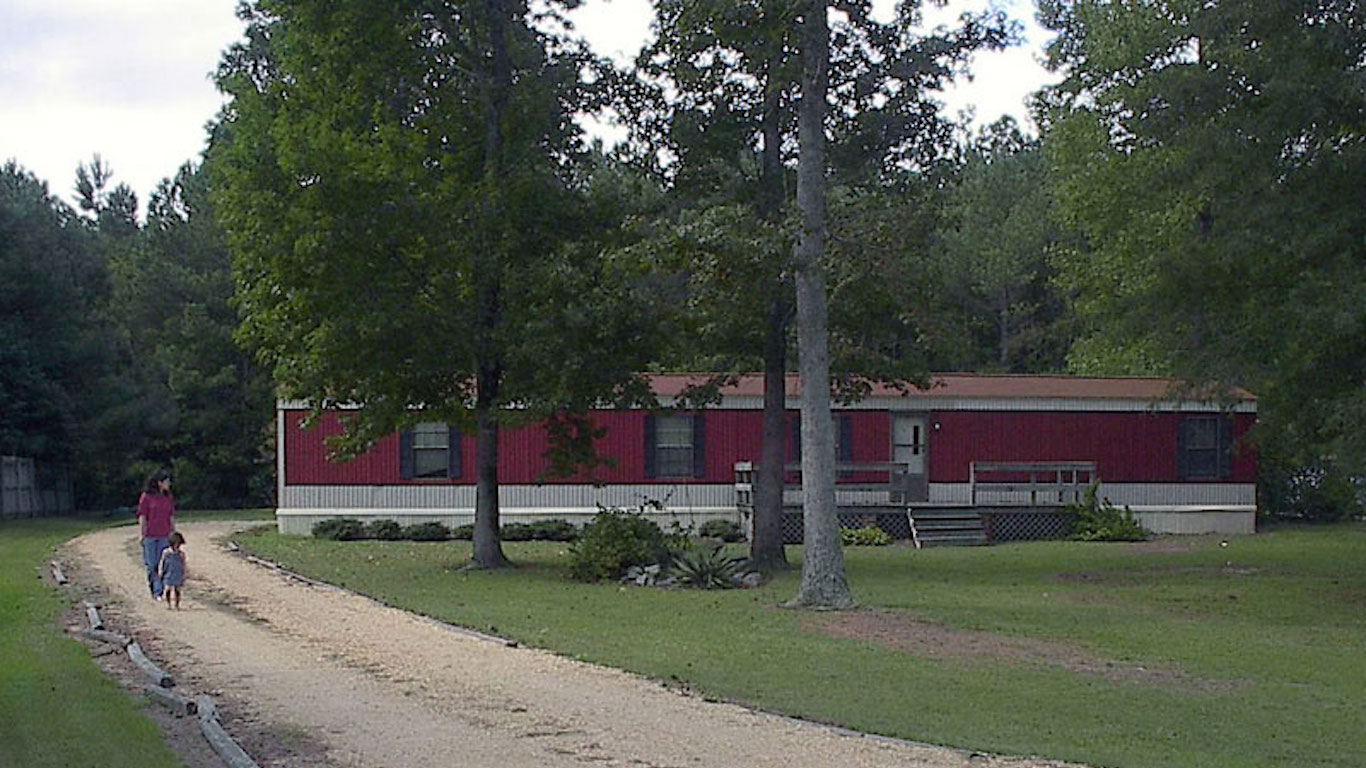
19. Pine Bluff, AR
> Poverty rate: 21.8%
> 2016 unemployment rate: 5.4%
> Households receiving SNAP benefits: 18.9%
> Households with income under $10,000: 10.7%
> Median household income: $37,076
[in-text-ad]
18. Goldsboro, NC
> Poverty rate: 22.0%
> 2016 unemployment rate: 5.8%
> Households receiving SNAP benefits: 20%
> Households with income under $10,000: 8.7%
> Median household income: $41,711

17. Sierra Vista-Douglas, AZ
> Poverty rate: 22.6% (tied)
> 2016 unemployment rate: 6.1%
> Households receiving SNAP benefits: 18.2%
> Households with income under $10,000: 8.2%
> Median household income: $45,508

16. Valdosta, GA
> Poverty rate: 22.6% (tied)
> 2016 unemployment rate: 5.2%
> Households receiving SNAP benefits: 18.7%
> Households with income under $10,000: 14.7%
> Median household income: $39,734
[in-text-ad-2]

15. Bakersfield, CA
> Poverty rate: 22.7%
> 2016 unemployment rate: 10.3%
> Households receiving SNAP benefits: 18.6%
> Households with income under $10,000: 7.2%
> Median household income: $49,903
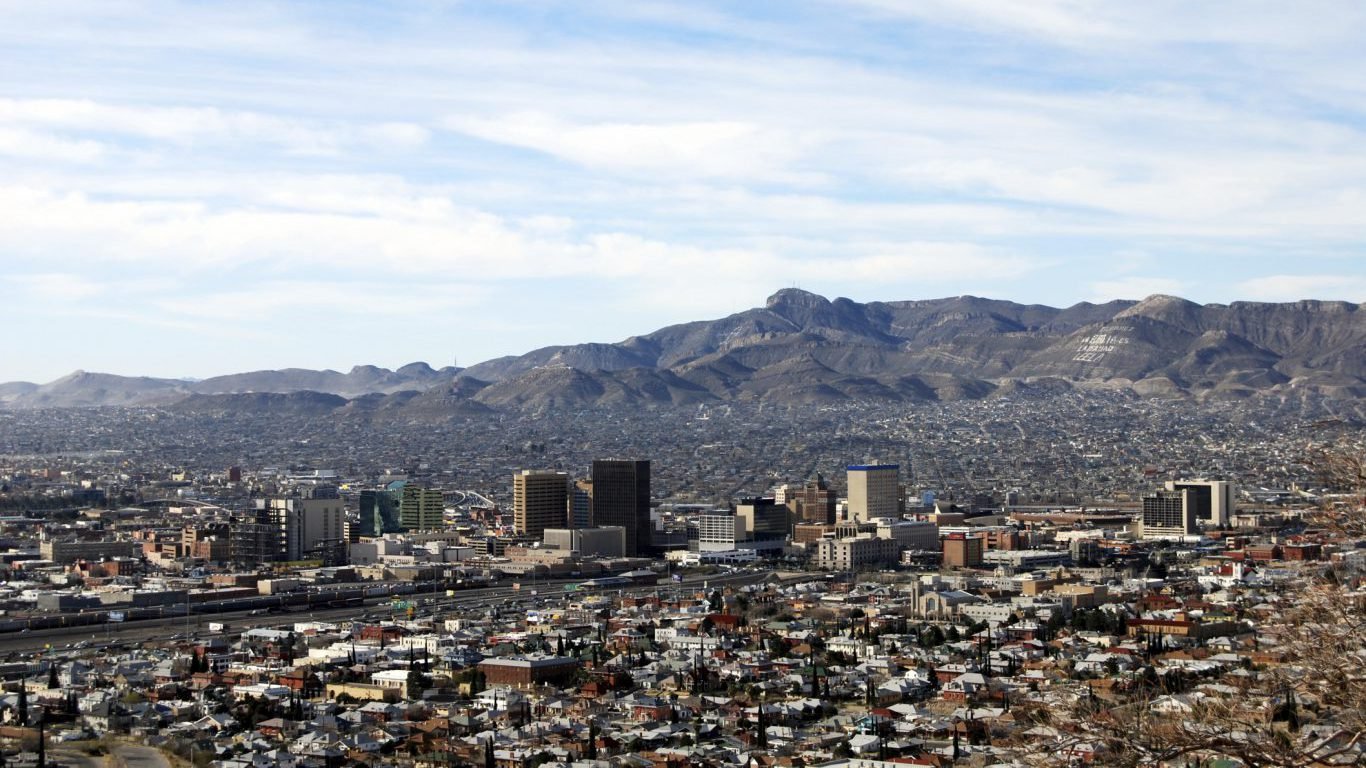
14. El Paso, TX
> Poverty rate: 22.8%
> 2016 unemployment rate: 4.9%
> Households receiving SNAP benefits: 21.6%
> Households with income under $10,000: 9.2%
> Median household income: $42,116
[in-text-ad]

13. Gainesville, FL
> Poverty rate: 23.0%
> 2016 unemployment rate: 4.3%
> Households receiving SNAP benefits: 11.8%
> Households with income under $10,000: 12.5%
> Median household income: $45,279
 24/7 Wall St.
12. Bloomington, IN
> Poverty rate: 23.7%
> 2016 unemployment rate: 4.7%
> Households receiving SNAP benefits: 9.7%
> Households with income under $10,000: 10.3%
> Median household income: $43,693

11. Monroe, LA
> Poverty rate: 24.0%
> 2016 unemployment rate: 6.1%
> Households receiving SNAP benefits: 18.4%
> Households with income under $10,000: 12.3%
> Median household income: $38,004
[in-text-ad-2]

10. College Station-Bryan, TX
> Poverty rate: 24.2% (tied)
> 2016 unemployment rate: 3.6%
> Households receiving SNAP benefits: 8.1%
> Households with income under $10,000: 10.6%
> Median household income: $42,233

9. Shreveport-Bossier City, LA
> Poverty rate: 24.2% (tied)
> 2016 unemployment rate: 6.4%
> Households receiving SNAP benefits: 18%
> Households with income under $10,000: 12.1%
> Median household income: $40,445
[in-text-ad]
8. El Centro, CA
> Poverty rate: 24.6%
> 2016 unemployment rate: 23.5%
> Households receiving SNAP benefits: 20.9%
> Households with income under $10,000: 8.3%
> Median household income: $49,095
 24/7 Wall St.
7. Albany, GA
> Poverty rate: 25.0%
> 2016 unemployment rate: 6.3%
> Households receiving SNAP benefits: 23.9%
> Households with income under $10,000: 9.8%
> Median household income: $40,667
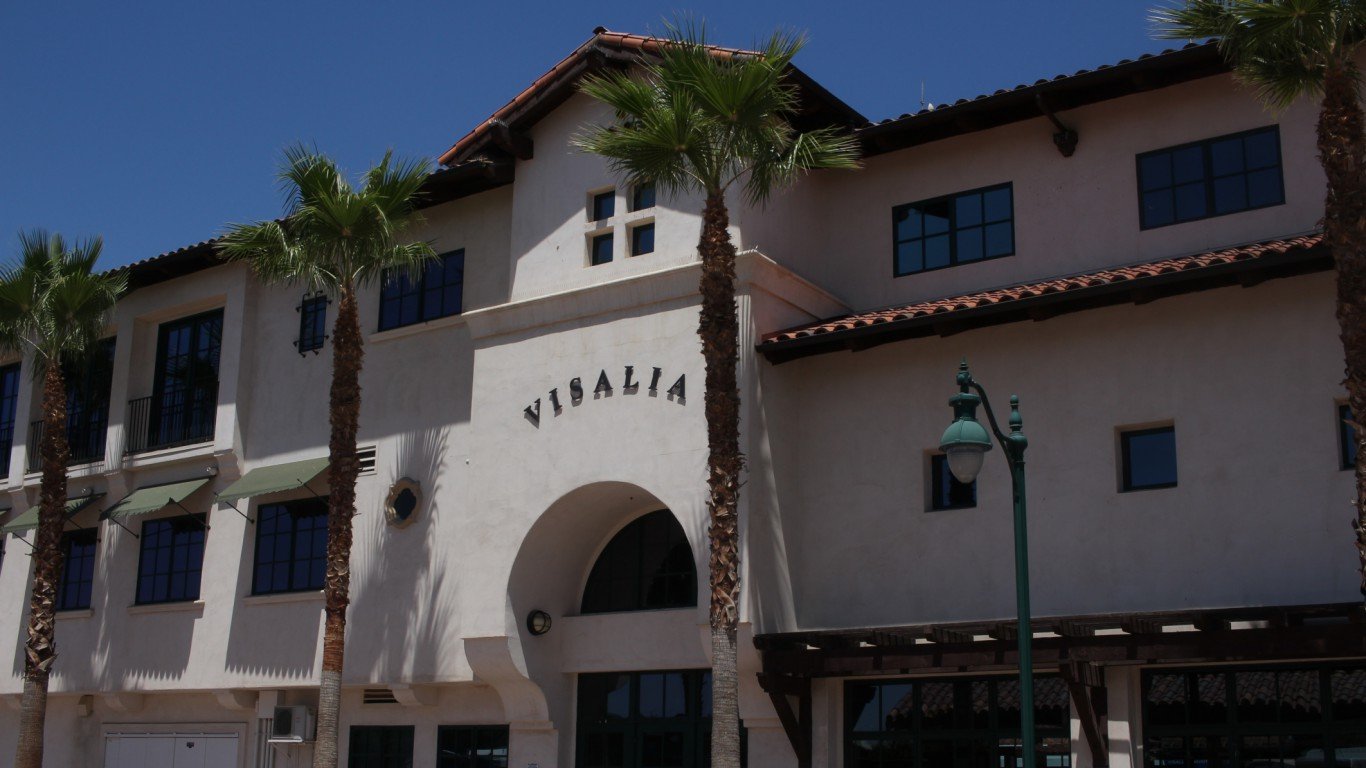
6. Visalia-Porterville, CA
> Poverty rate: 25.2%
> 2016 unemployment rate: 11%
> Households receiving SNAP benefits: 23%
> Households with income under $10,000: 6.9%
> Median household income: $45,881
[in-text-ad-2]

5. Fresno, CA
> Poverty rate: 25.6%
> 2016 unemployment rate: 9.4%
> Households receiving SNAP benefits: 21.5%
> Households with income under $10,000: 8.4%
> Median household income: $48,715
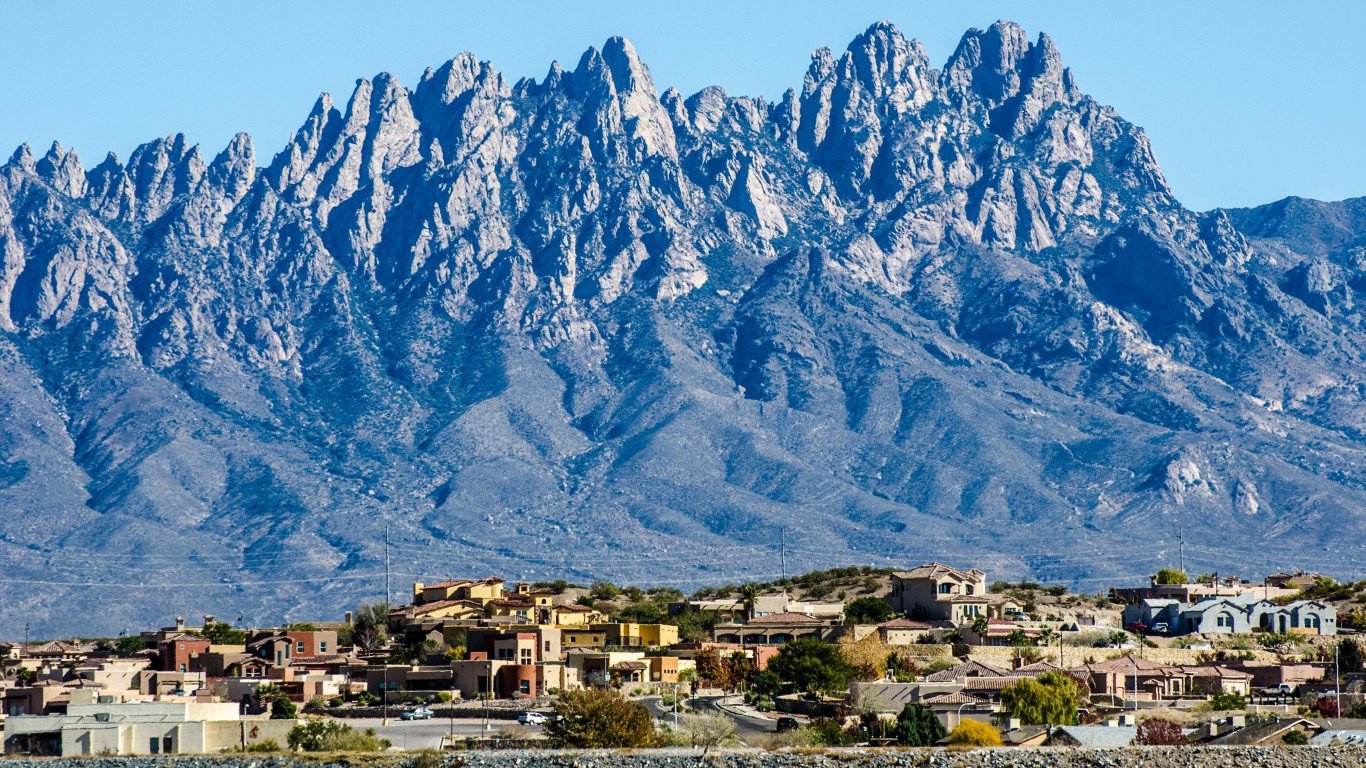
4. Las Cruces, NM
> Poverty rate: 27.1%
> 2016 unemployment rate: 7.2%
> Households receiving SNAP benefits: 22.5%
> Households with income under $10,000: 10.1%
> Median household income: $37,496
[in-text-ad]
3. Brownsville-Harlingen, TX
> Poverty rate: 29.3%
> 2016 unemployment rate: 7.2%
> Households receiving SNAP benefits: 23.1%
> Households with income under $10,000: 13.6%
> Median household income: $37,061
 24/7 Wall St.
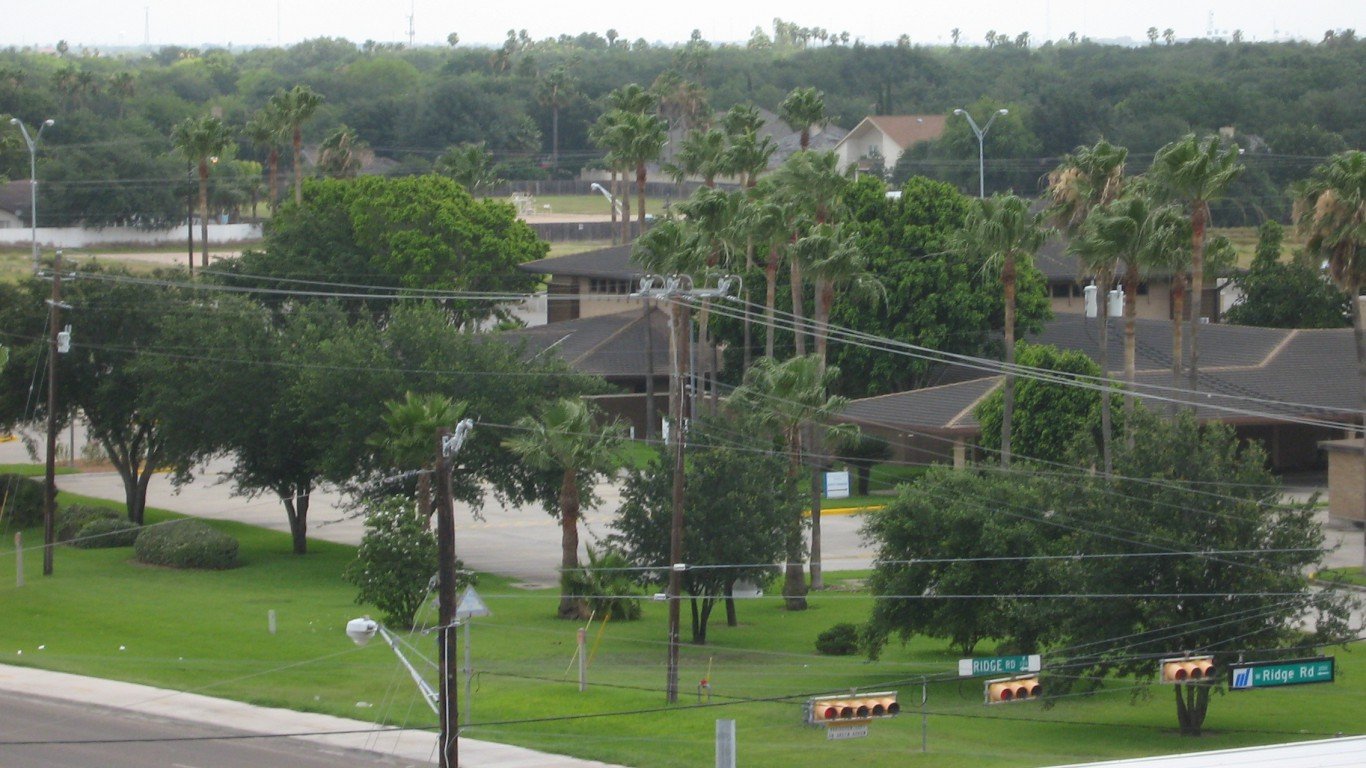
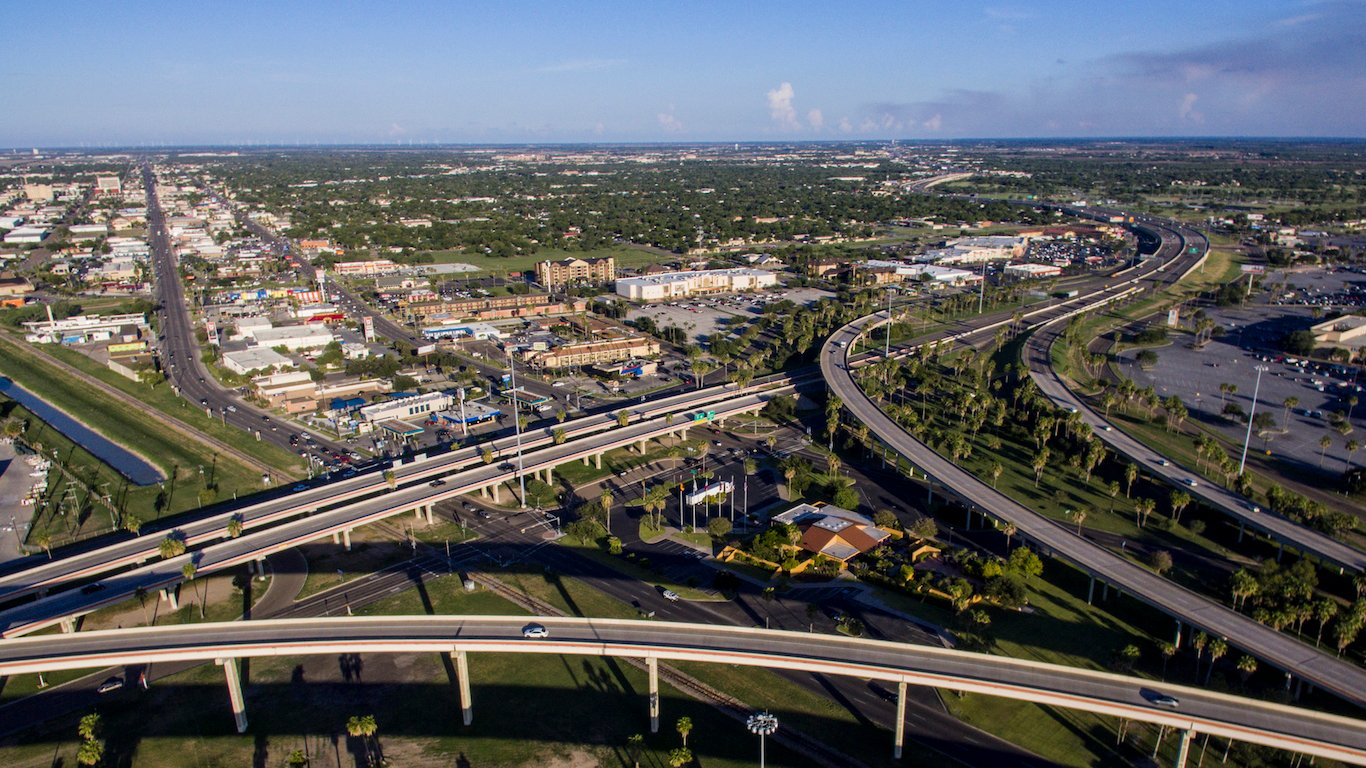
2. McAllen-Edinburg-Mission, TX
> Poverty rate: 31.4%
> 2016 unemployment rate: 7.8%
> Households receiving SNAP benefits: 29.8%
> Households with income under $10,000: 12%
> Median household income: $36,176
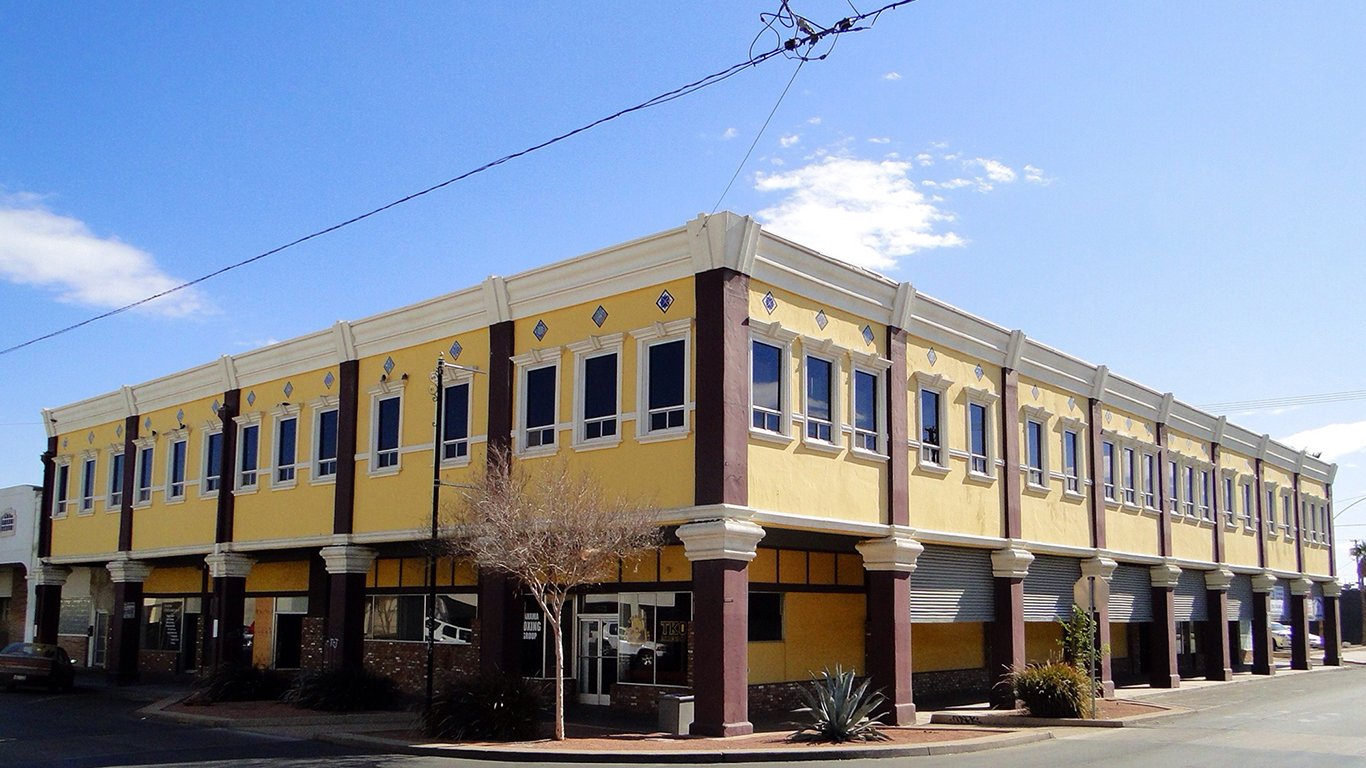
1. Laredo, TX
> Poverty rate: 33.0%
> 2016 unemployment rate: 4.9%
> Households receiving SNAP benefits: 27%
> Households with income under $10,000: 14.3%
> Median household income: $35,659
Detailed Findings and Methodology
Food stamps, or SNAP benefits, established as permanent law by the Johnson administration, are intended to help the poorest of Americans afford groceries. Not surprisingly, the U.S. cities with the highest poverty rates also tend to be home to a higher than typical share of residents who depend on SNAP. Of the 39 metro areas on this list, 33 have a higher SNAP recipiency rate than the comparable 12.4% national share. Indeed, the two metro areas with the highest poverty rates — Laredo, Texas, and McAllen, Texas — also have the highest SNAP recipiency rates, at 27% and 29.8%, respectively.
The U.S. cities with the highest poverty rates are also home to larger than typical shares of households facing extreme poverty. In most of the country, an individual earning $12,060 or less a year is living on poverty level income. Nationwide, some 6.7% of households earn $10,000 or less a year — well below the poverty line for an individual. Each city on this list is home to a larger share of households earning $10,000 or less than is typical nationwide. In three metro areas on this list — Valdosta, Georgia, Laredo, Texas, and Brownsville, Texas — the share of households earning $10,000 or less a year is more than double the comparable national share.
In many cities on this list, a stalled economy and lack of job opportunities likely contribute to widespread poverty. Thirty of the 39 metro areas with the highest poverty rates have annual unemployment rates greater than or equal to the 2016 U.S. jobless rate of 4.9%. For example, in El Centro, California, a metro area with a nation leading 23.5% unemployment rate, 24.6% of the population lives below the poverty line, a higher share than in all but handful of U.S. cities.
To identify the cities with the highest poverty rates, 24/7 Wall St. reviewed the share of all residents living on poverty level income in 382 U.S. metro areas. Only those areas with poverty rates greater than 20% were included on this list. Poverty rates, as well as median household income, SNAP recipiency, and the share of households with annual incomes below $10,000 and the share of households earning $200,000 or more all came from from the U.S. Census Bureau’s 2016 American Community Survey. Annual unemployment figures are for 2016 and came from the Bureau of Labor Statistics.
Sponsored: Want to Retire Early? Here’s a Great First Step
Want retirement to come a few years earlier than you’d planned? Or are you ready to retire now, but want an extra set of eyes on your finances?
Now you can speak with up to 3 financial experts in your area for FREE. By simply clicking here you can begin to match with financial professionals who can help you build your plan to retire early. And the best part? The first conversation with them is free.
Click here to match with up to 3 financial pros who would be excited to help you make financial decisions.