
Having a car inspires feelings of freedom and conjures images of the open road. But the reality of being an auto owner can be an entirely different experience. High gas prices, long commutes, and sometimes deadly accidents are daily concerns for drivers.
The drawbacks to car ownership and driving are far more pronounced in some parts of the country than in others. Just as gas prices vary by region, so does the likelihood of congestion, stolen vehicles, and accidents.
24/7 Wall St. created an index from half a dozen driving-related measures to identify the worst cities to drive in. The index components were selected to capture an area’s safety, convenience, and cost of driving. While the metro areas on this list span the United States, a disproportionate share of the worst cities for drivers are in western states — California in particular.
Click here to see the worst cities to drive in.
Click here to see our detailed findings and methodology.
Source: Tobias Kleinlercher / Wikimedia Commons
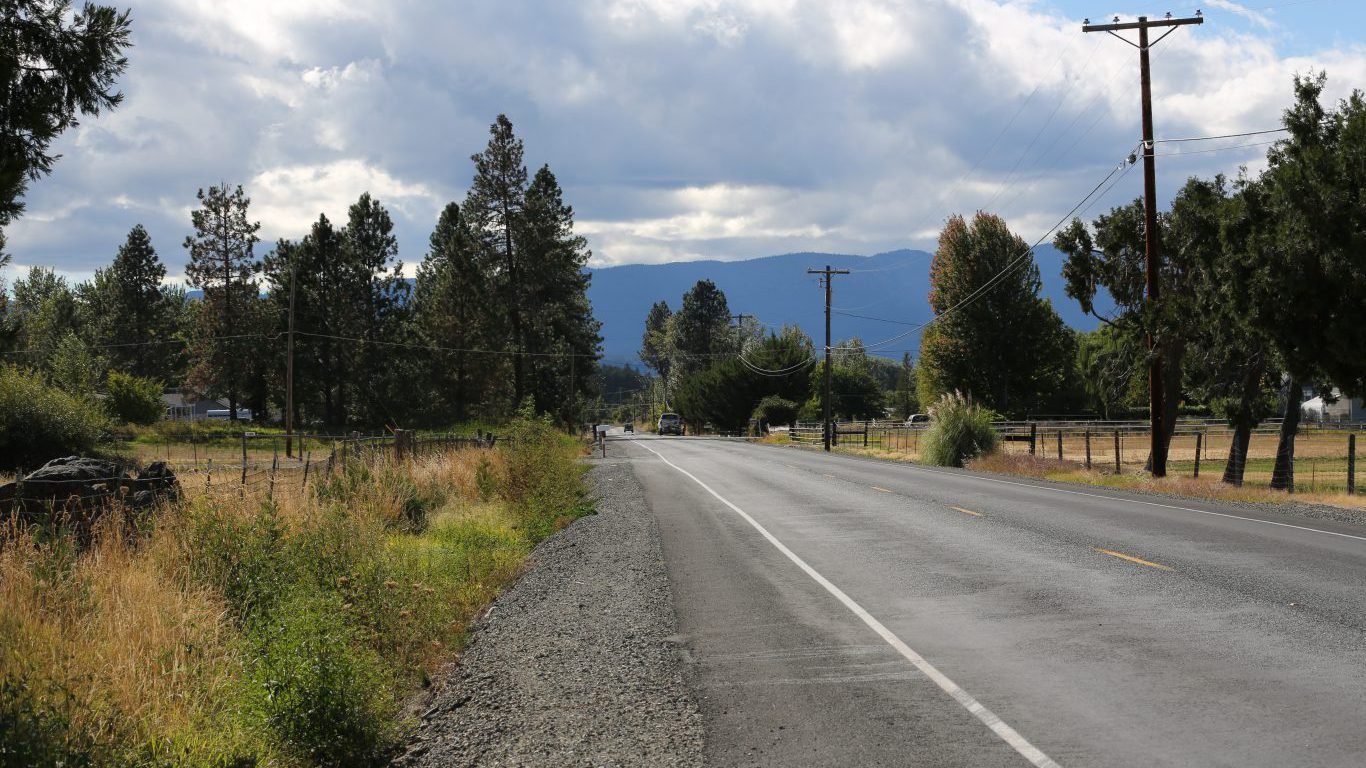
25. Grants Pass, OR
> Traffic fatalities: 29.1 deaths per 100,000 residents
> Avg. commute: 18.3 minutes
> Avg. vehicles per household: 0.7
> Avg. gas price: N/A
Compared to other cities on this list, there aren’t very many commuters in Grants Pass, Oregon. There are fewer than 25,000 total vehicles that commute in the area, but it still one of the worst place to drive.
One of the major issues metro area drivers face is the rate of traffic fatality rate. There were 29.1 traffic fatalities for every 100,000 residents of Grants Pass in 2016. That rate is higher than all but a handful of other U.S. metro areas.
[in-text-ad]

Source: Thinkstock
24. Urban Honolulu, HI
> Traffic fatalities: 5.9 deaths per 100,000 residents
> Avg. commute: 29.0 minutes
> Avg. vehicles per household: 1.1
> Avg. gas price: $2.79 per gallon
Located in the middle of the Pacific Ocean, gas prices in Hawaii tend to be among the highest in the United States. Indeed, a gallon of gas in Urban Honolulu costs an average of $2.79 — more than in all but seven other metro areas nationwide.
Urban Honolulu metro area residents also spend more time driving to work than is typical in much of the country. The average commute time in the metro area is 29 minutes, longer than in the majority of U.S. metro areas and slightly longer than the 26.6 minute commute time nationwide.
 24/7 Wall St.
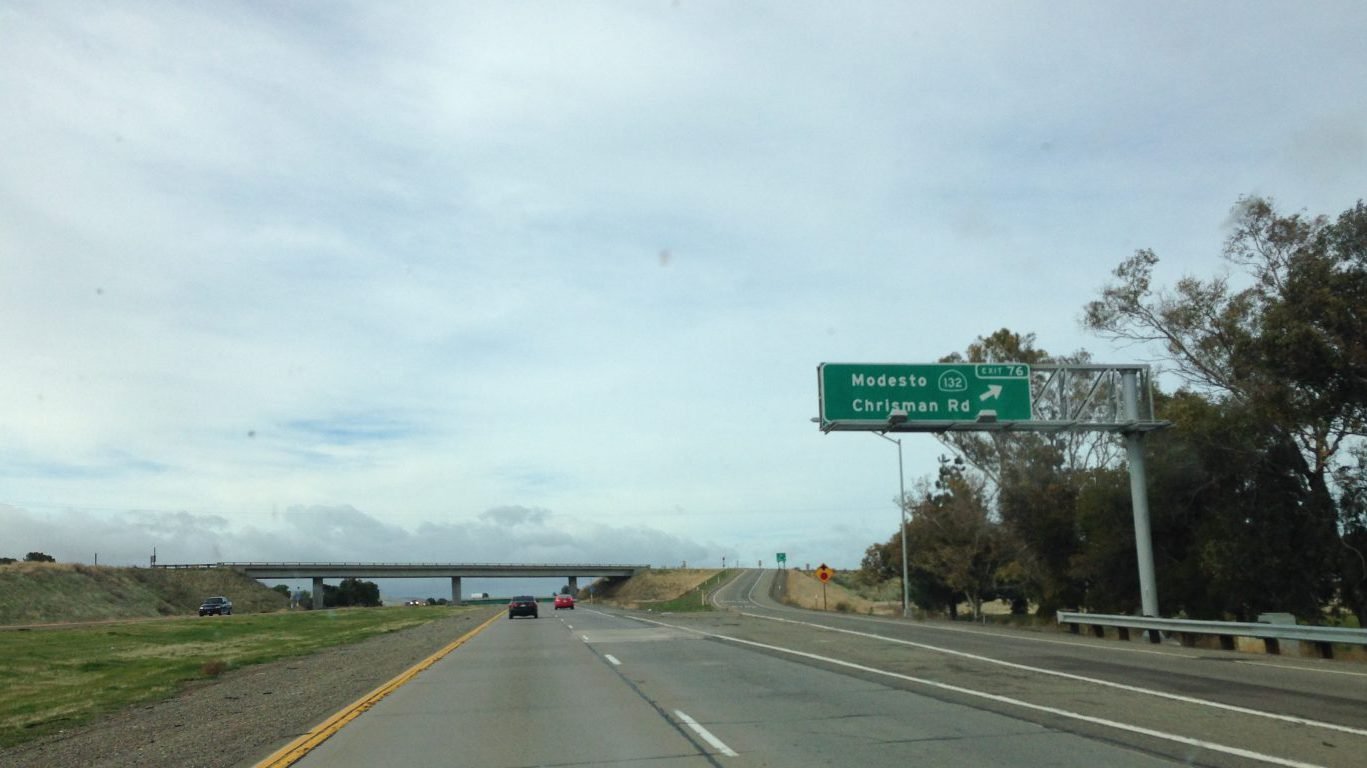
Source: Wikimedia Commons
23. Stockton-Lodi, CA
> Traffic fatalities: 16.1 deaths per 100,000 residents
> Avg. commute: 33.3 minutes
> Avg. vehicles per household: 1.1
> Avg. gas price: $2.68 per gallon
Stockton-Lodi, California drivers have some of the longest commutes in the country. More than 20% of commuters in the area take an hour or more to get to work and the average drive to work takes 33.3 minutes. Both of those figures are in the ten highest nationally.
Those drives are not cheap, either. In 2016, the average gallon of gas in Stockton-Lodi costs $2.68, one of the highest average gas prices in the U.S.
Source: Thinkstock
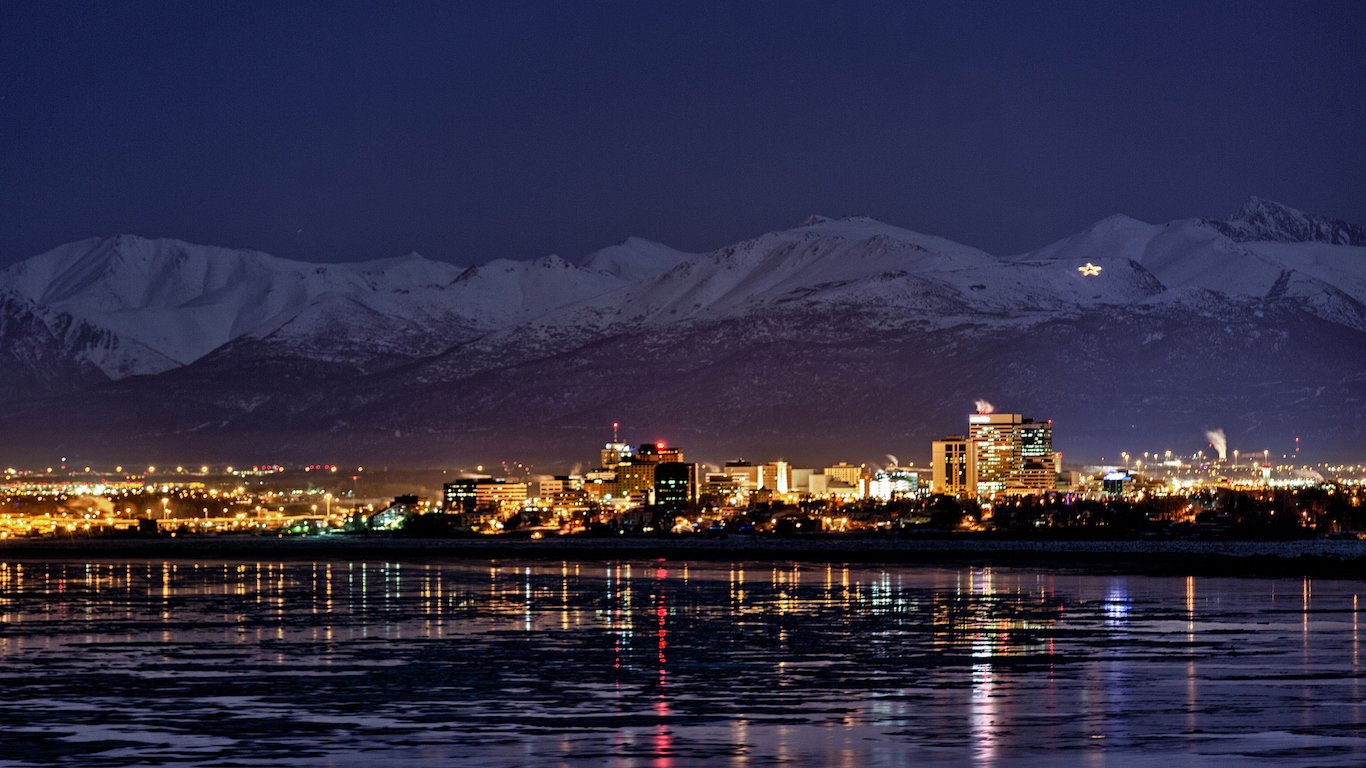
22. Anchorage, AK
> Traffic fatalities: 10.2 deaths per 100,000 residents
> Avg. commute: 20.8 minutes
> Avg. vehicles per household: 1.2
> Avg. gas price: $2.50 per gallon
One of the worst aspects of driving in Anchorage is paying for gas. Gas costs an average of $2.50 per gallon, one of the higher gas prices in the country. High operating costs and few competitors in Alaska lead to higher gas prices in the state.
Anchorage residents are also more likely to have their car stolen than Americans in nearly every other metro area. With 669 cars stolen per every 100,000 residents, Anchorage has the sixth highest car theft rate among hundreds of U.S. metro areas.
[in-text-ad-2]
Source: Thinkstock
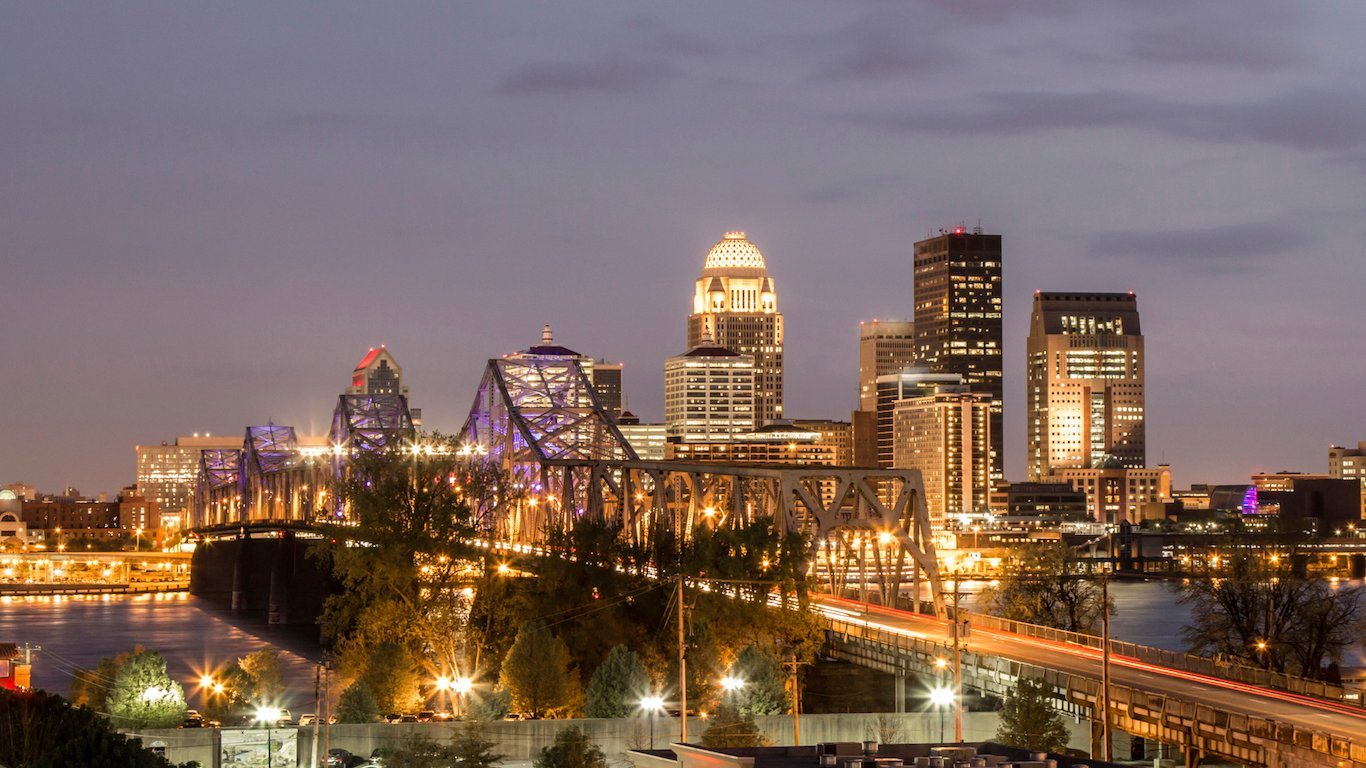
21. Louisville/Jefferson County, KY-IN
> Traffic fatalities: 14.3 deaths per 100,000 residents
> Avg. commute: 23.9 minutes
> Avg. vehicles per household: 1.1
> Avg. gas price: $2.29 per gallon
There were over 5,000 motor vehicle thefts in the Louisville metro area in 2016, or about 411 for every 100,000 area residents. Nationwide, there were only 103 car thefts per 100,000 people. In addition to car theft, deadly accidents are more common in Louisville/Jefferson County than nationwide. There were 14.3 roadway fatalities per 100,000 residents in the metro area, more than in the majority of U.S. metro areas.
Source: Thinkstock
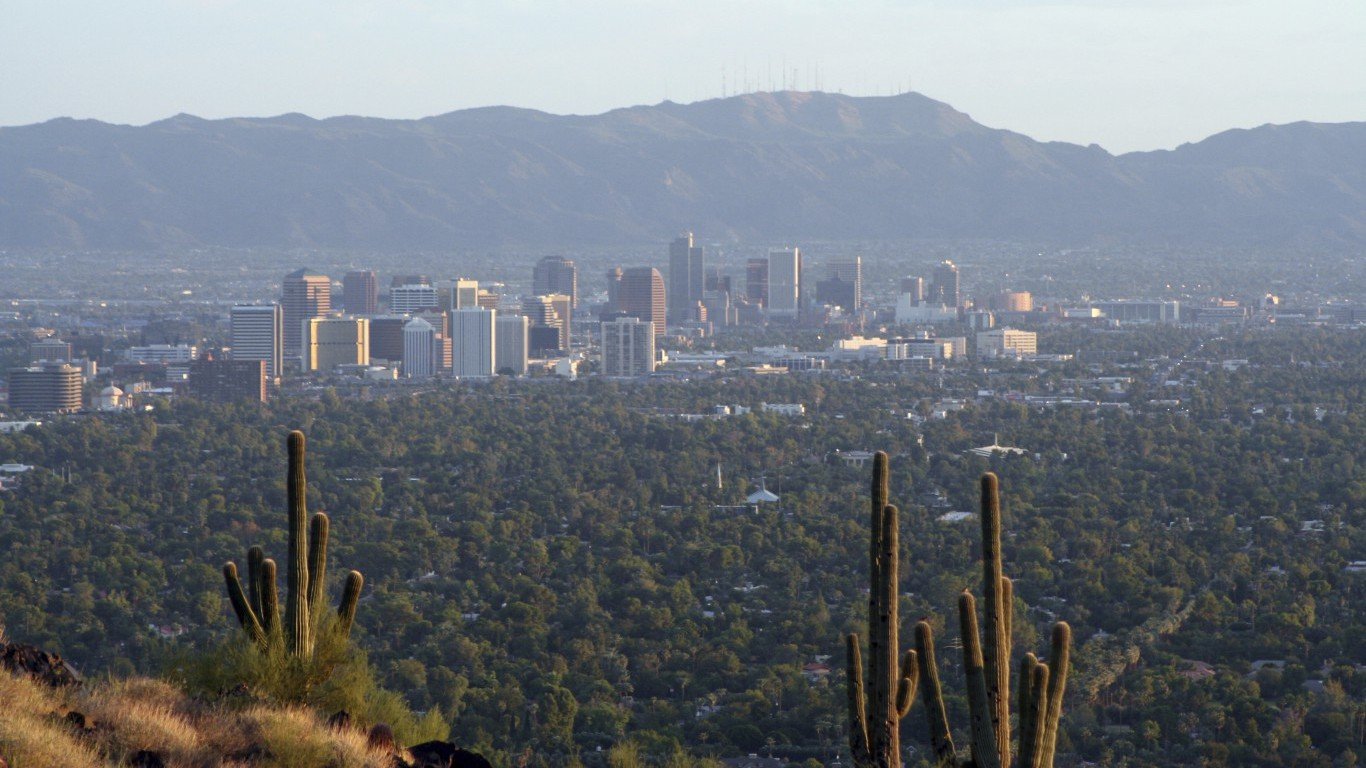
20. Phoenix-Mesa-Scottsdale, AZ
> Traffic fatalities: 11.7 deaths per 100,000 residents
> Avg. commute: 26.4 minutes
> Avg. vehicles per household: 1.0
> Avg. gas price: $2.17 per gallon
Car owners in the Phoenix-Mesa-Scottsdale metro area are at a higher than typical risk of having their vehicle stolen. There are about 397 car thefts for every 100,000 residents annually, more than in the majority of U.S. metro areas and more than three times the motor vehicle theft rate nationwide.
[in-text-ad]
Source: Lucky-photographer / Shutterstock.com
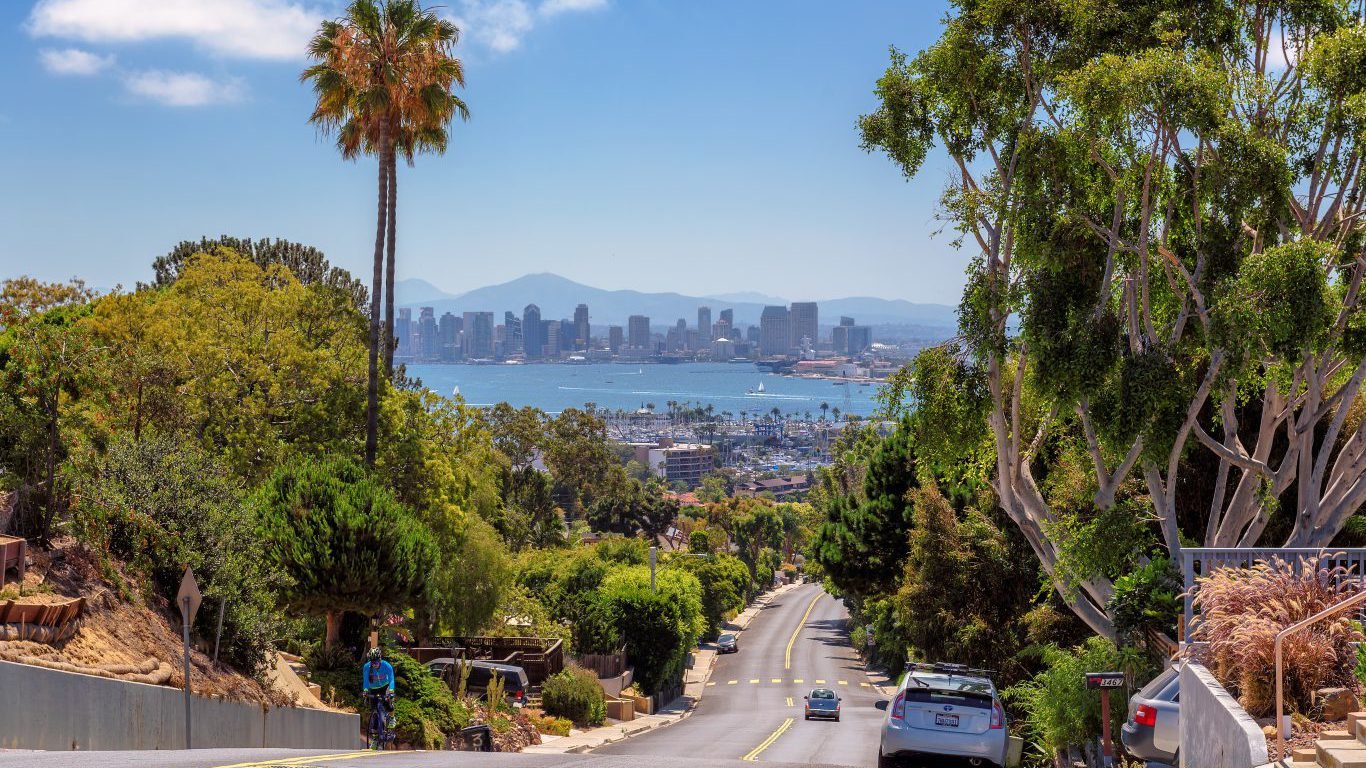
19. San Diego-Carlsbad, CA
> Traffic fatalities: 7.2 deaths per 100,000 residents
> Avg. commute: 26.0 minutes
> Avg. vehicles per household: 1.2
> Avg. gas price: $2.87 per gallon
San Diego-Carlsbad may be sunny and warm, but it is also pricey. At $2.87 per gallon, it has the fourth highest average gas price in the country, just a few cents behind the most expensive gas of $3.00 in San Jose-Sunnyvale-Santa Clara, California. That can be especially bad for San Diego-Carlsbad motorists because, on average, they lose 42 hours per year to traffic congestion, which is in the top 10% among all metro areas.

Source: Aparna / Wikimedia Commons
18. Gadsden, AL
> Traffic fatalities: 28.3 deaths per 100,000 residents
> Avg. commute: 26.2 minutes
> Avg. vehicles per household: 0.9
> Avg. gas price: N/A
Gadsden, Alabama has fewer cars on the road than almost any other metro area in the country, but it is still one of the most dangerous for motorists. The metro area had more than 28 road traffic fatalities per 100,000 residents in 2016, the fifth highest rate in the country.
It also takes 11.4% of Gadsden commuters over an hour to get to their destination, one of the highest shares of commuters who drive so long among all metro areas.

Source: Thinkstock
17. Bakersfield, CA
> Traffic fatalities: 16.2 deaths per 100,000 residents
> Avg. commute: 22.6 minutes
> Avg. vehicles per household: 1.1
> Avg. gas price: $2.84 per gallon
Gas prices in Bakersfield are nearly the highest in the nation. Over the last year, a gallon of gas cost an average of $2.84, more than in all but a handful of other metro areas. Area car owners are also at especially high risk of having their car stolen. There are 855 motor vehicle thefts for every 100,000 Bakersfield residents per year, the third highest car theft rate among metro areas and more than eight times the comparable U.S. rate.
[in-text-ad-2]
Source: Thinkstock
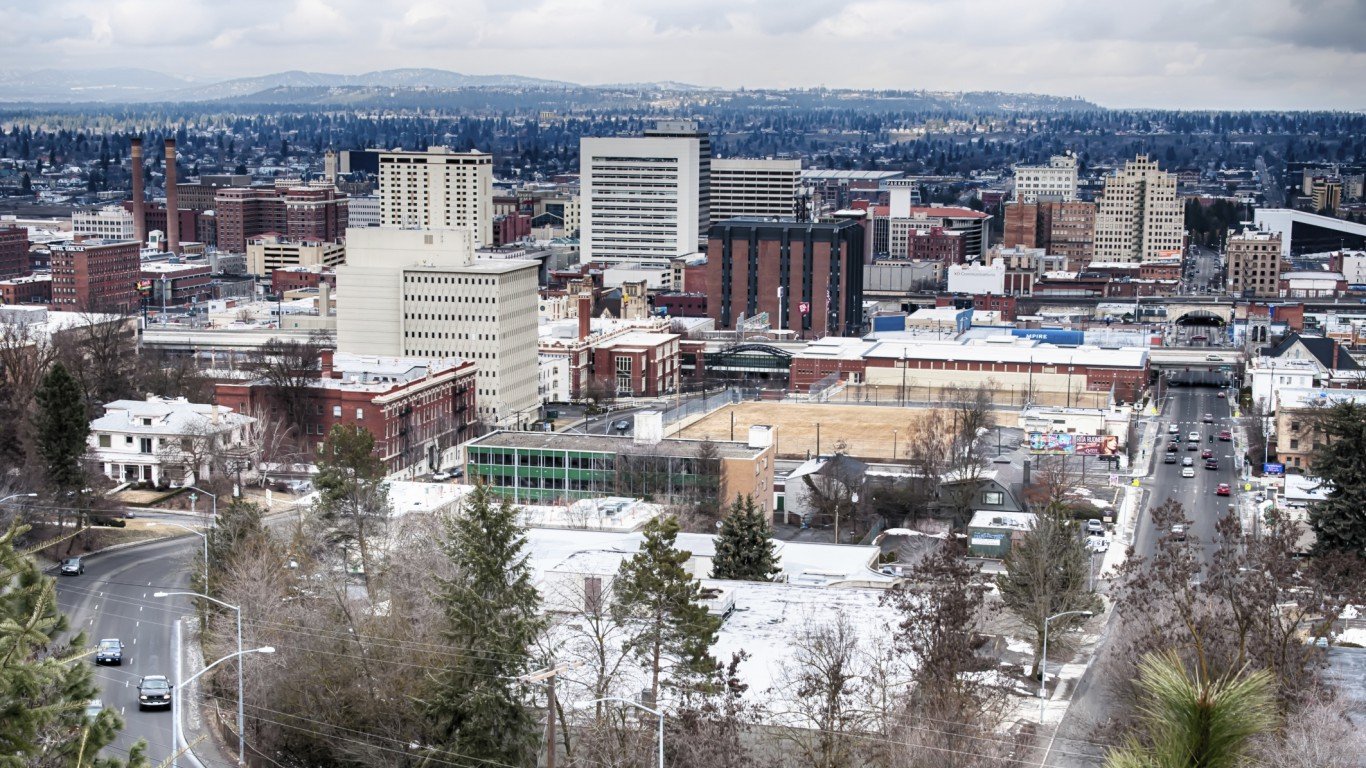
16. Spokane-Spokane Valley, WA
> Traffic fatalities: 6.7 deaths per 100,000 residents
> Avg. commute: 22.6 minutes
> Avg. vehicles per household: 0.9
> Avg. gas price: $2.58 per gallon
The Spokane-Spokane Valley, Washington metro area has a high incidence of car theft. Some 625 cars are stolen per every 100,000 residents every year, far outpacing the 103 per 100,000 national rate.
Heavy traffic costs the average Spokane-Spokane Valley commuter 23 gallons of gas per year, one of the higher gas wastes due to congestion in the country. That cost really starts to add up when you consider the metro area’s average gas price of $2.58 per gallon is on the high side too.
Source: Fietsbel / Wikimedia Commons
15. Modesto, CA
> Traffic fatalities: 14.6 deaths per 100,000 residents
> Avg. commute: 28.8 minutes
> Avg. vehicles per household: 1.1
> Avg. gas price: $2.73 per gallon
Modesto, California residents are more likely than residents in many other places to have some of the longest and earliest commutes in the country. Some 11.4% of workers in the metro area leave for work before 5 a.m., one of the highest shares of workers leaving this early in the country. Additionally, some 11.7% of Modesto workers commute for over an hour, compared to 9.1% of commuters nationwide.
[in-text-ad]
Source: Wikimedia Commons
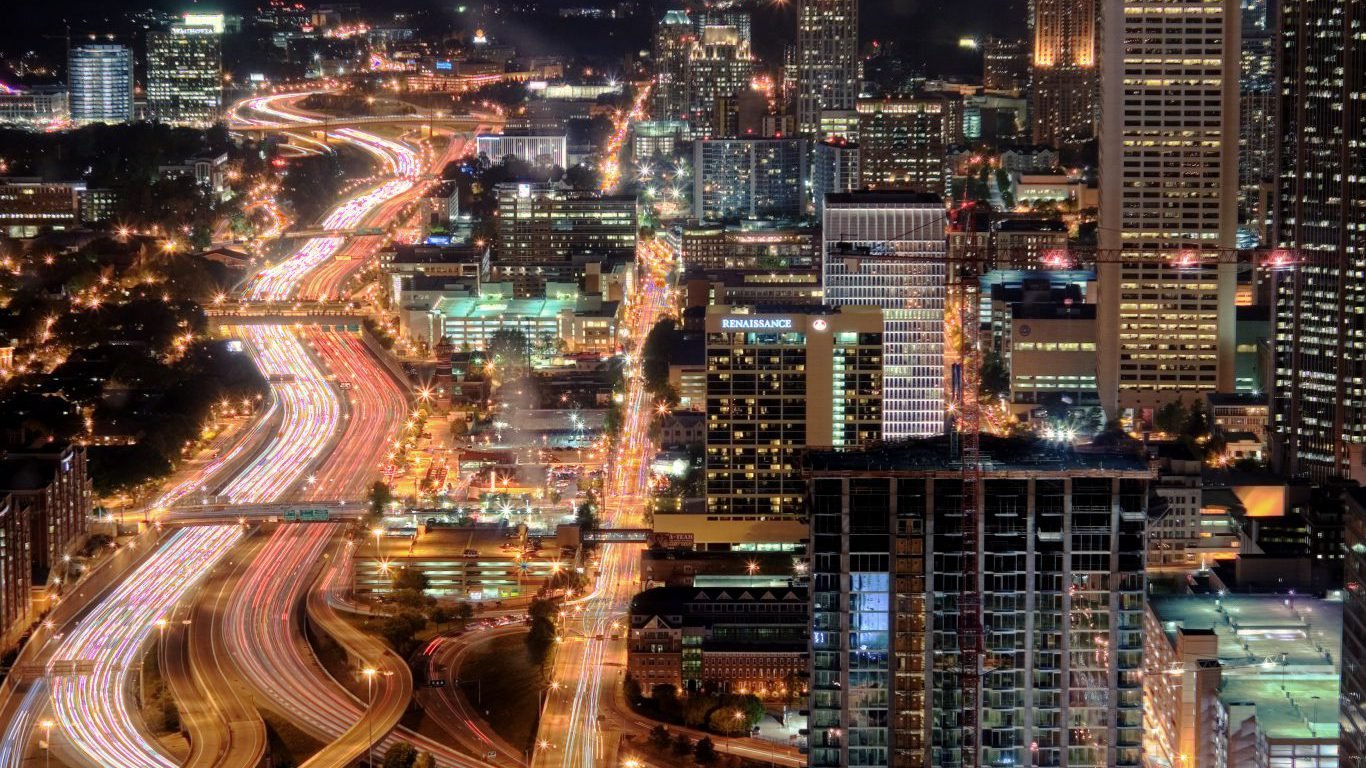
14. Atlanta-Sandy Springs-Roswell, GA
> Traffic fatalities: 11.4 deaths per 100,000 residents
> Avg. commute: 32.1 minutes
> Avg. vehicles per household: 1.1
> Avg. gas price: $2.24 per gallon
Commuters in the Atlanta metro area lose about 50 hours per year to traffic, making Atlanta one of only 14 metro areas nationwide where traffic delays add up to more than two days per driver annually.
The traffic delays likely contribute to the long the long commute times in the Atlanta metro area. Nearly 15% of commuters in Atlanta spend at least an hour traveling to work, more than in all but 11 other U.S. metro areas. Indeed, the average commuter in Atlanta spends about 32 minutes getting to work, the ninth highest average commute time among U.S. metro areas.

Source: Thinkstock
13. Las Vegas-Henderson-Paradise, NV
> Traffic fatalities: 10.1 deaths per 100,000 residents
> Avg. commute: 24.7 minutes
> Avg. vehicles per household: 1.1
> Avg. gas price: $2.41 per gallon
The typical commuter in the Las Vegas metro area loses about 46 hours and 21 gallons of gas per year idling in traffic — more than in most other U.S. metro areas. Relatively high gas prices in the area make congestion and traffic delays especially costly. In the last year, the average cost of a gallon of gas in Las Vegas-Henderson-Paradise was $2.41, more than in the majority of metro areas.

Source: Thinkstock
12. Houston-The Woodlands-Sugar Land, TX
> Traffic fatalities: 10.4 deaths per 100,000 residents
> Avg. commute: 30.0 minutes
> Avg. vehicles per household: 1.2
> Avg. gas price: $2.02 per gallon
The Houston metro area is one of the most populous in the country, which means there are more cars on the road as well. Houston has the fifth most cars used to get to work of any metro area in the country, and that can lead to traffic congestion. The average area commuter loses 26.2 gallons of gas per year and 55.4 hours per year due to slow-moving traffic. Both of those figures are in the top 10 in the country.
Fortunately for drivers, commuting does not cost them too much. Houston’s gas prices are on the cheaper side, averaging just $2.02 per gallon.
[in-text-ad-2]
Source: Thinkstock
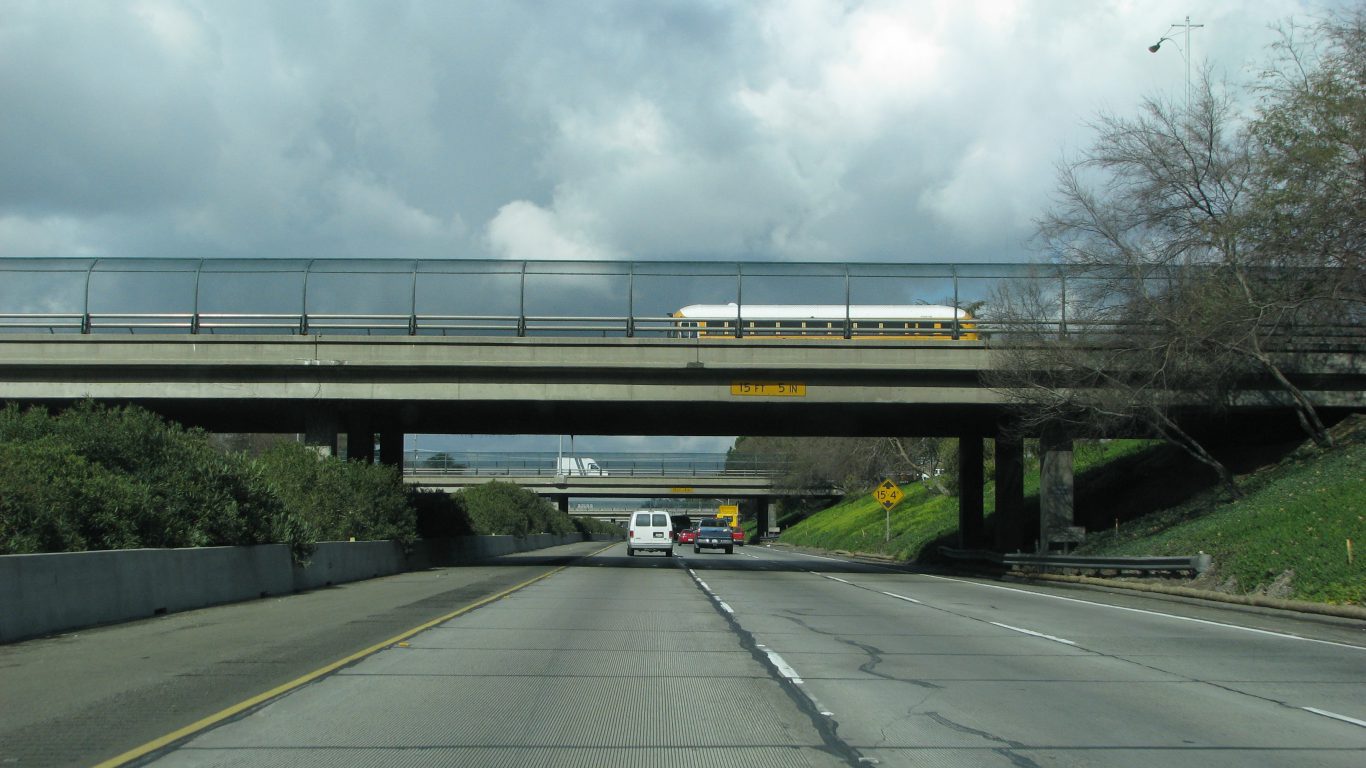
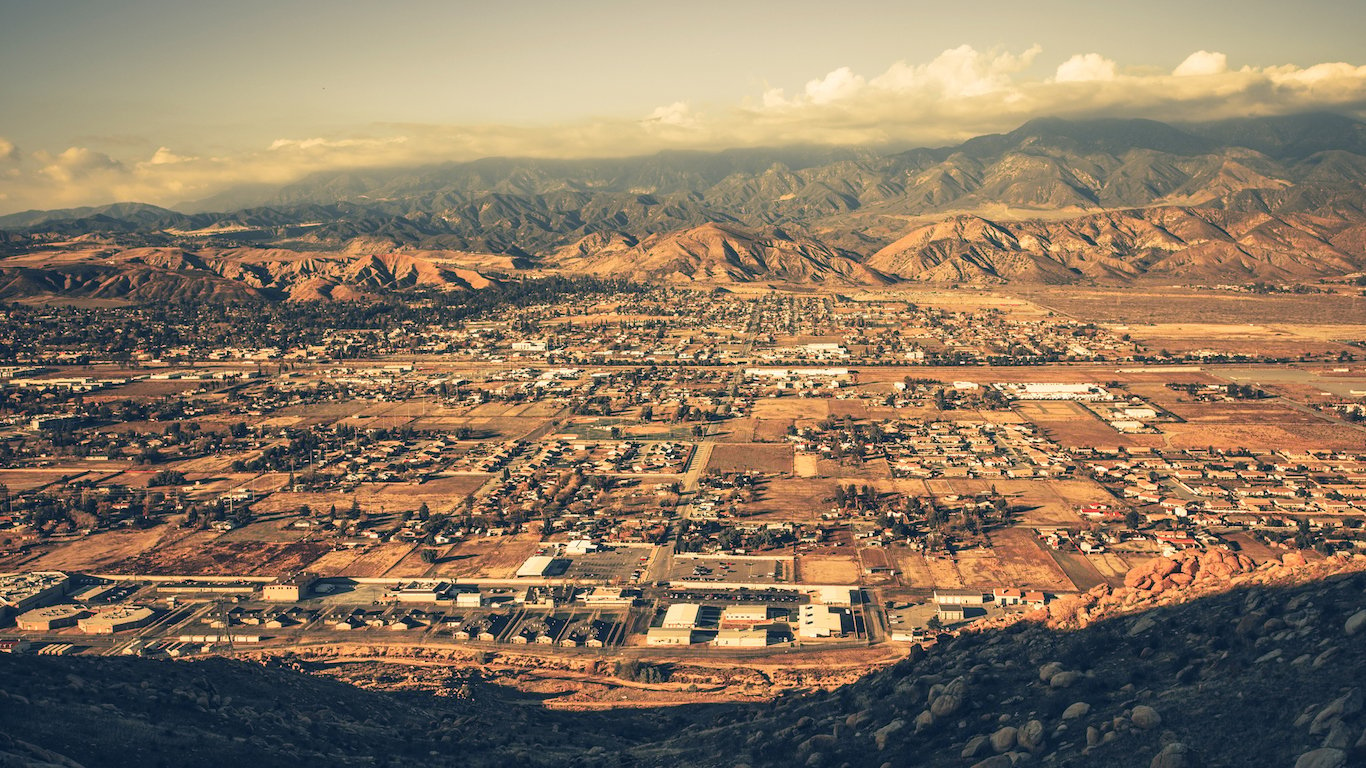
11. Riverside-San Bernardino-Ontario, CA
> Traffic fatalities: 11.4 deaths per 100,000 residents
> Avg. commute: 32.9 minutes
> Avg. vehicles per household: 1.2
> Avg. gas price: N/A
The Riverside-San Bernardino-Ontario, California area has some of the lengthiest commutes in the country. The average driver in the area takes nearly 33 minutes to get to work, and 17.7% of drivers take more than an hour — both the seventh highest figures in the country.
The area also had a car theft rate well above the national rate in 2016. Some 679 cars per 100,000 residents were stolen that year, more than six times the national car theft rate.
Source: Thinkstock
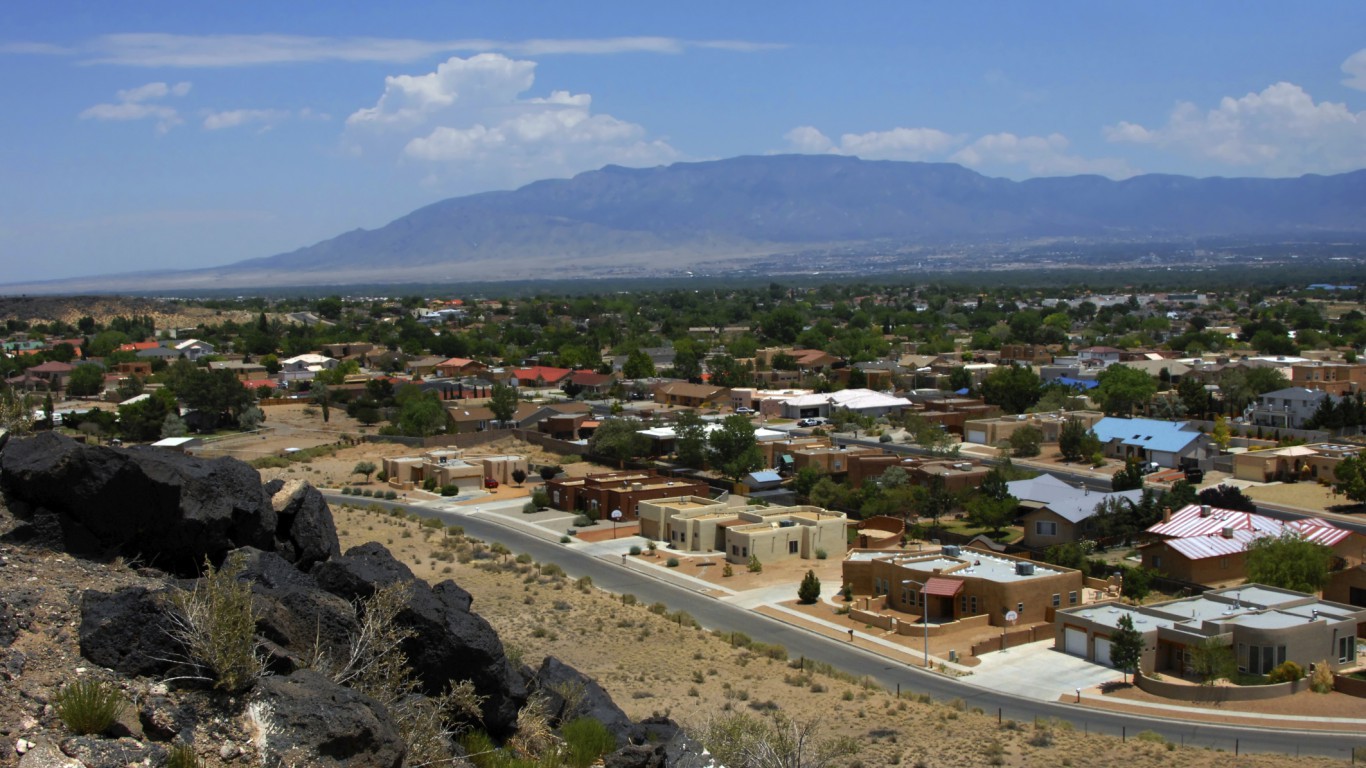
10. Albuquerque, NM
> Traffic fatalities: 14.8 deaths per 100,000 residents
> Avg. commute: 23.7 minutes
> Avg. vehicles per household: 1.0
> Avg. gas price: $2.07 per gallon
Albuquerque is one of the worst places to own a car in large part because there is a good chance it might get stolen. There were 1,114 car thefts for every 100,000 Albuquerque residents in 2016, by far the highest car theft rate in the nation. The next highest city on this list has under 900 cars stolen per 100,000 people.
Fortunately for Albuquerque motorists, gas prices are relatively low, at just $2.07 per gallon on average.
[in-text-ad]
Source: Thinkstock
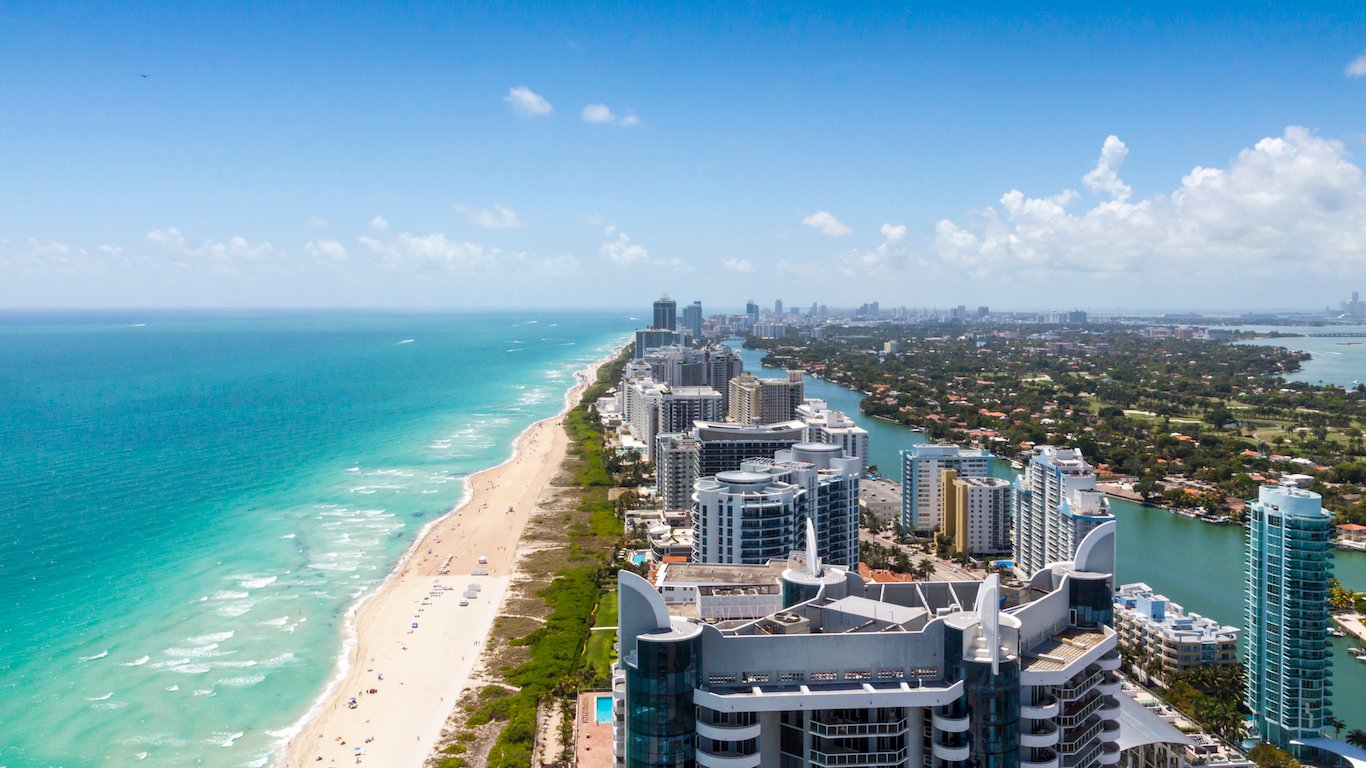
9. Miami-Fort Lauderdale-West Palm Beach, FL
> Traffic fatalities: 11.9 deaths per 100,000 residents
> Avg. commute: 29.6 minutes
> Avg. vehicles per household: 1.1
> Avg. gas price: $2.33 per gallon
Miami has some of the worst traffic in the country. Area commuters lose an average of about 52 hours per year to traffic delays, more time than in all but half a dozen other U.S. metro areas. Likely due in no small part to congestion and delays, commute times for many in the area are long. Only about 6.3% of workers spend less than 10 minutes getting to work — about half corresponding share of workers nationwide. Similarly, 10.7% of workers in the Miami metro area spend more than an hour commuting to work each day compared to only 9.1% of workers nationwide.
 24/7 Wall St.
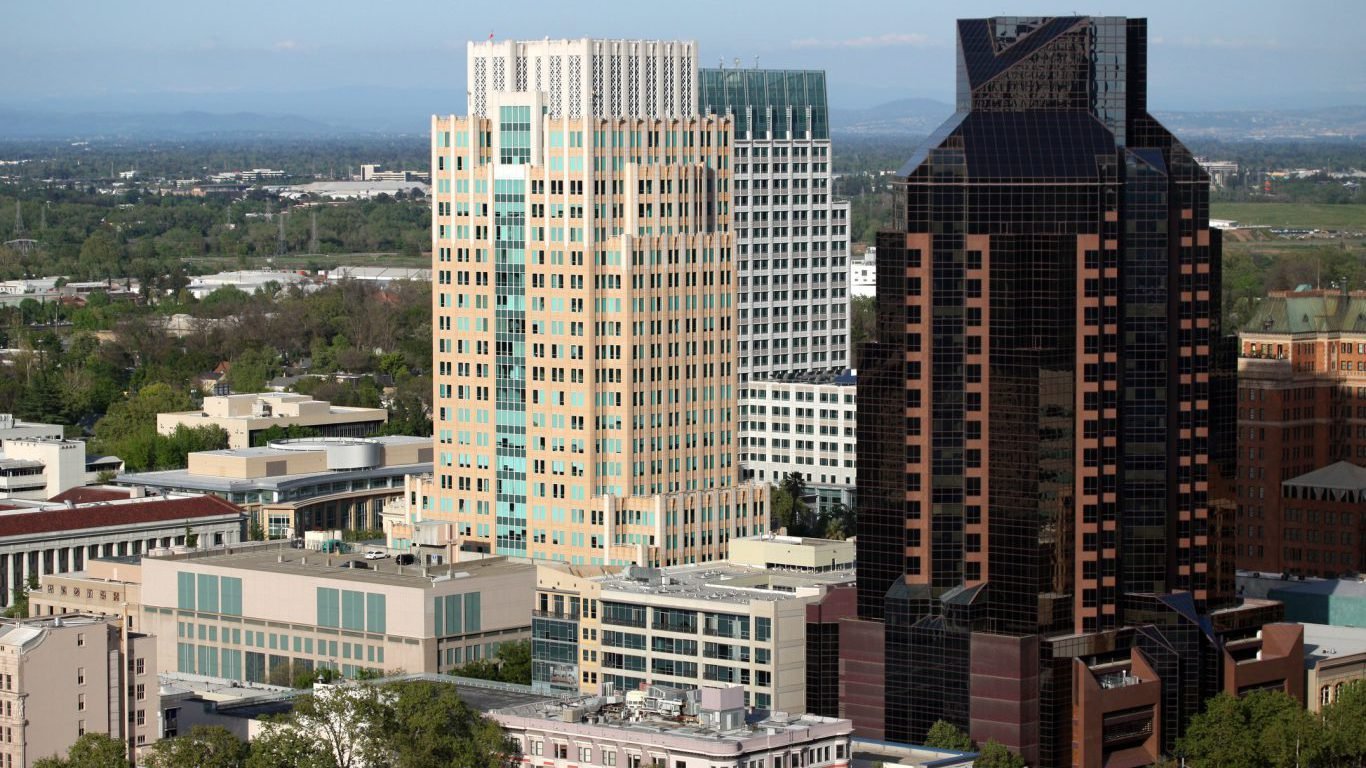
Source: Thinkstock
8. Sacramento–Roseville–Arden-Arcade, CA
> Traffic fatalities: 11.3 deaths per 100,000 residents
> Avg. commute: 27.1 minutes
> Avg. vehicles per household: 1.0
> Avg. gas price: $2.76 per gallon
As is the case in much of California, gas is not cheap in the Sacramento metro area. A gallon of gas cost an average of $2.76 cents in the last year, the ninth highest average cost of any U.S. metro area.
Many motorists in the metro area are also relatively vulnerable to car theft. There are 492 stolen automobiles for every 100,000 Sacramento residents per year, nearly five times the U.S. car theft rate.

Source: Thinkstock
7. Baltimore-Columbia-Towson, MD
> Traffic fatalities: 7.7 deaths per 100,000 residents
> Avg. commute: 31.0 minutes
> Avg. vehicles per household: 1.1
> Avg. gas price: $2.16 per gallon
The typical commuter in the Baltimore area spends 31 minutes getting to work, a longer time than in all but a dozen U.S. metro areas. Long commutes are partially due to traffic delays and congestion. The average commuter in Baltimore-Columbia-Towson spends more than 65 hours in traffic per year, more time than in nearly every other metro area.
[in-text-ad-2]
Source: Doug Kerr / Wikimedia Commons
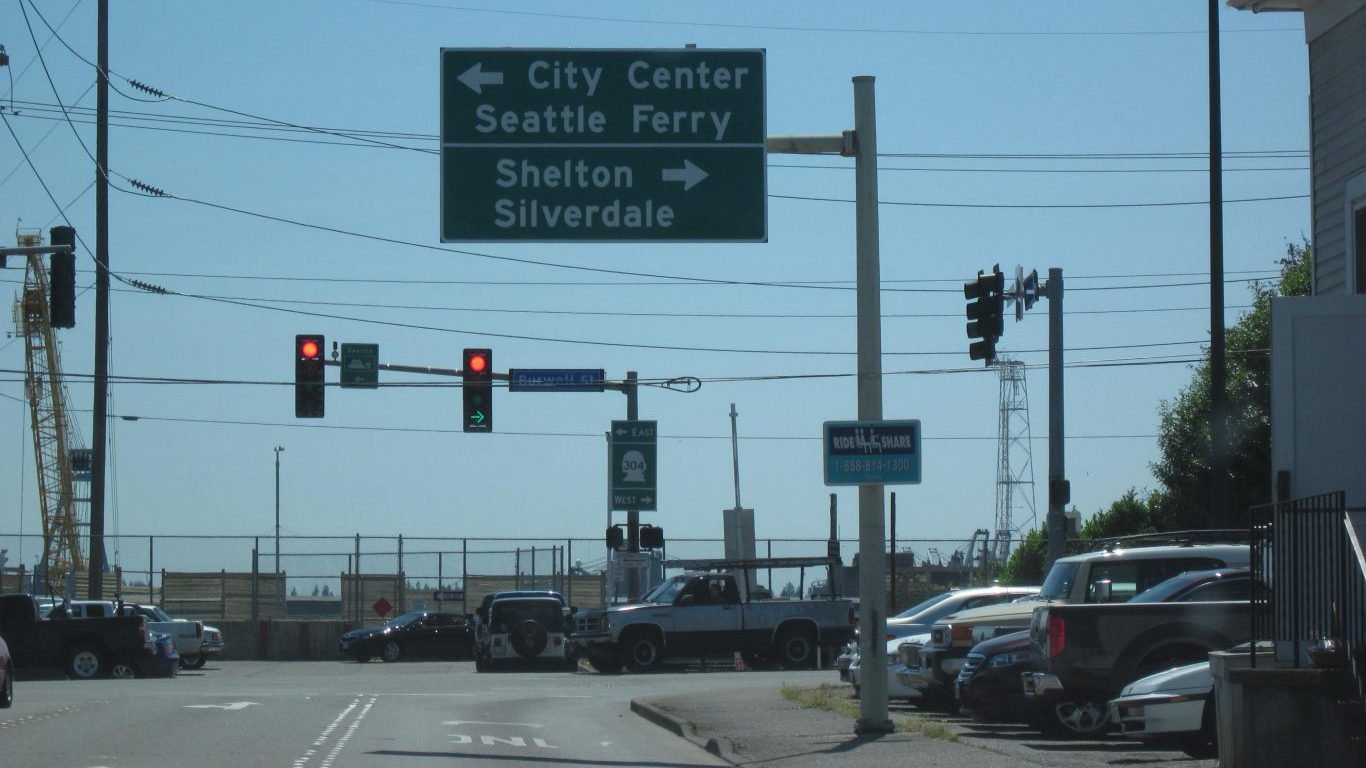
6. Bremerton-Silverdale, WA
> Traffic fatalities: 7.9 deaths per 100,000 residents
> Avg. commute: 30.8 minutes
> Avg. vehicles per household: 0.9
> Avg. gas price: N/A
Just 30.4% of Bremerton-Silverdale, Washington’s workers leave for work between 7:00 and 9:00 a.m, compared to 43.3% of workers nationally. That is likely because 47.3% of its commuters leave for work before 7:00 a.m. compared to 32.3% of people nationwide. Despite the unusual commute times, the metro area ranks in the top five in terms of gas and time lost to traffic delays per commuter. Traffic delays cost area drivers an average of 26.6 gallons of wasted fuel annually.
Source: blvdone / Shutterstock.com
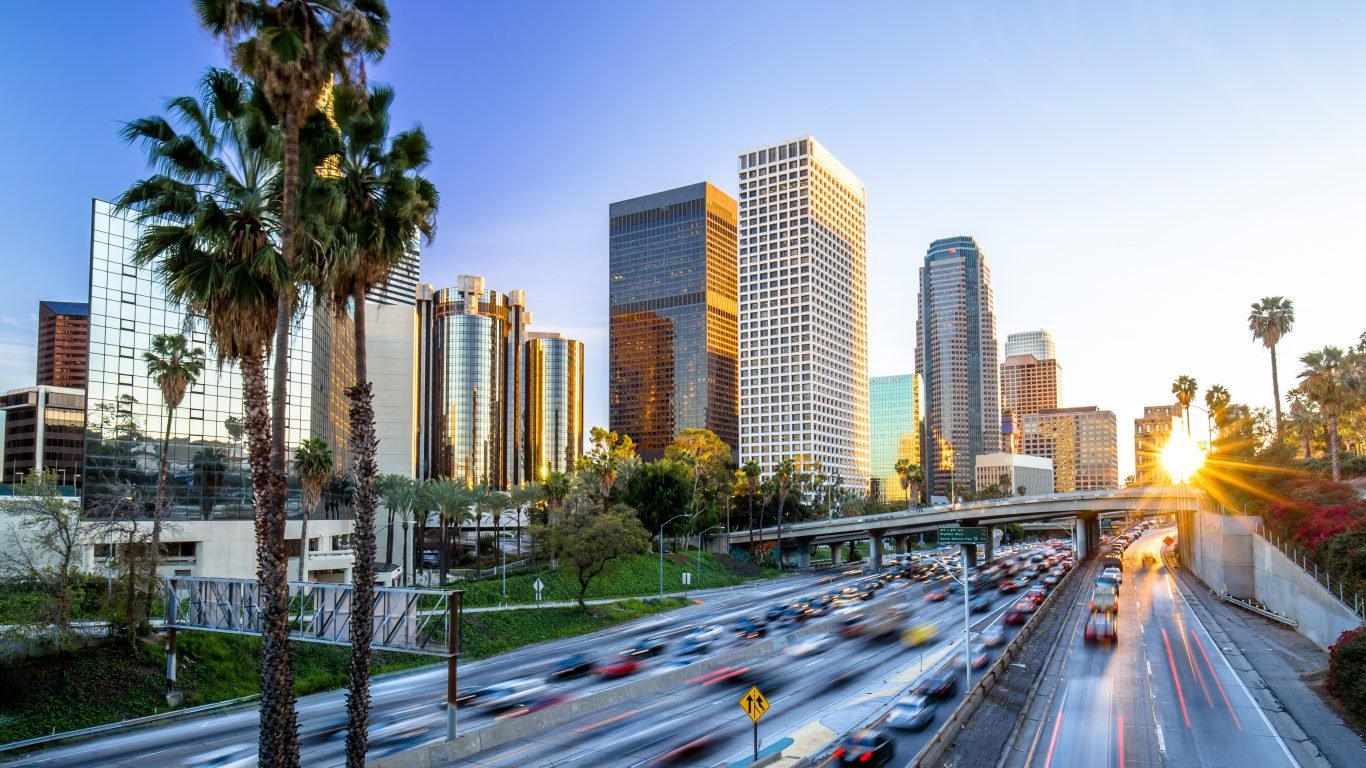
5. Los Angeles-Long Beach-Anaheim, CA
> Traffic fatalities: 7.4 deaths per 100,000 residents
> Avg. commute: 30.7 minutes
> Avg. vehicles per household: 1.2
> Avg. gas price: $2.96 per gallon
California is notorious for high gas prices, and its largest city is no exception. At $2.96 per gallon, the average cost of gas in Los Angeles is higher than in all but two other U.S. metro areas.
As one of the largest cities in the United States, Los Angeles has more cars on the road than all but one other metro area. More than 5 million vehicles are used to commute.
[in-text-ad]
Source: Allentownrocks / Wikimedia Commons
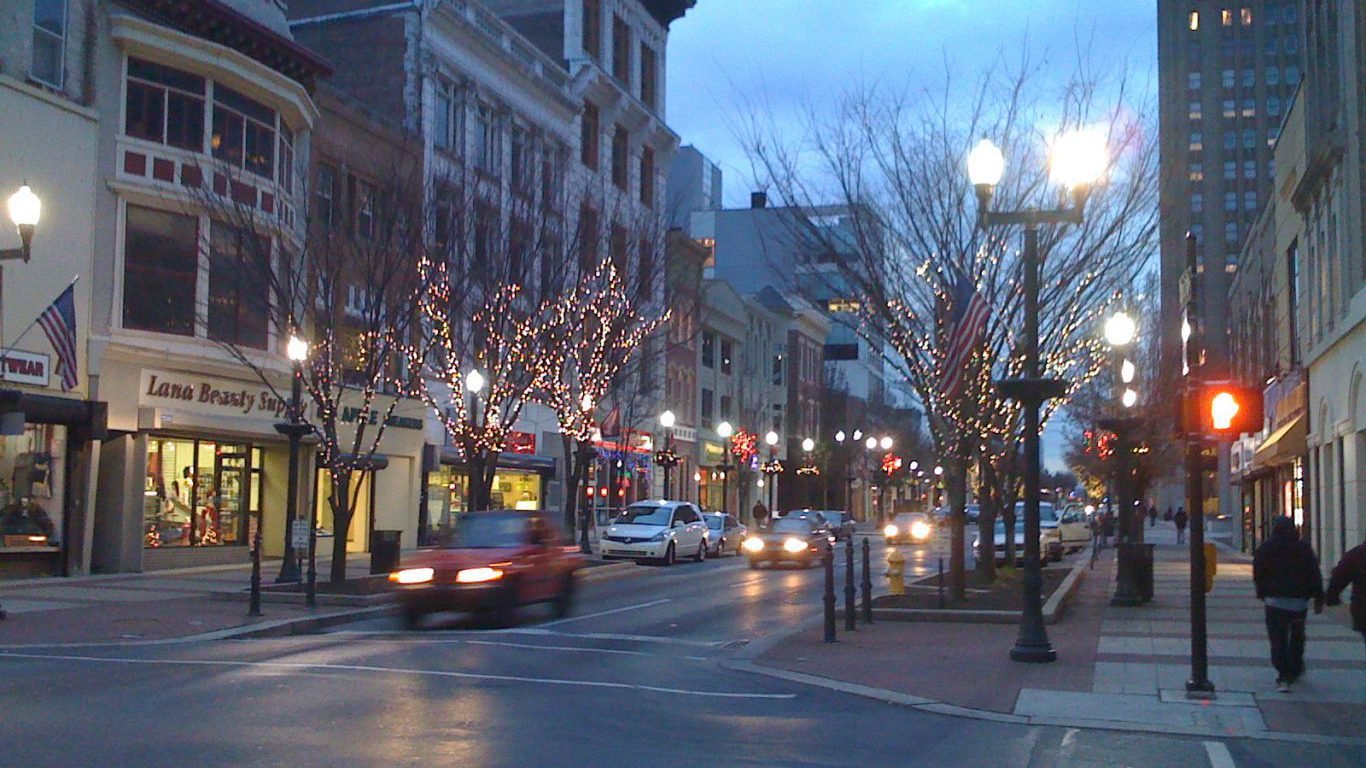
4. Allentown-Bethlehem-Easton, PA-NJ
> Traffic fatalities: 10.1 deaths per 100,000 residents
> Avg. commute: 27.9 minutes
> Avg. vehicles per household: 1.1
> Avg. gas price: $2.41 per gallon
Traffic is a major problem in the Allentown-Bethlehem-Easton metro area. The typical commuter spends about 71 hours each year sitting in traffic, the highest average delay time among U.S. metro areas. Such delays account for an average of nearly 34 gallons of wasted fuel annually.
Despite the nation-leading traffic delays, some 12.8% of workers living in the area arrive to work in under 10 minutes each day, on par with the comparable share of commuters nationwide.
 24/7 Wall St.
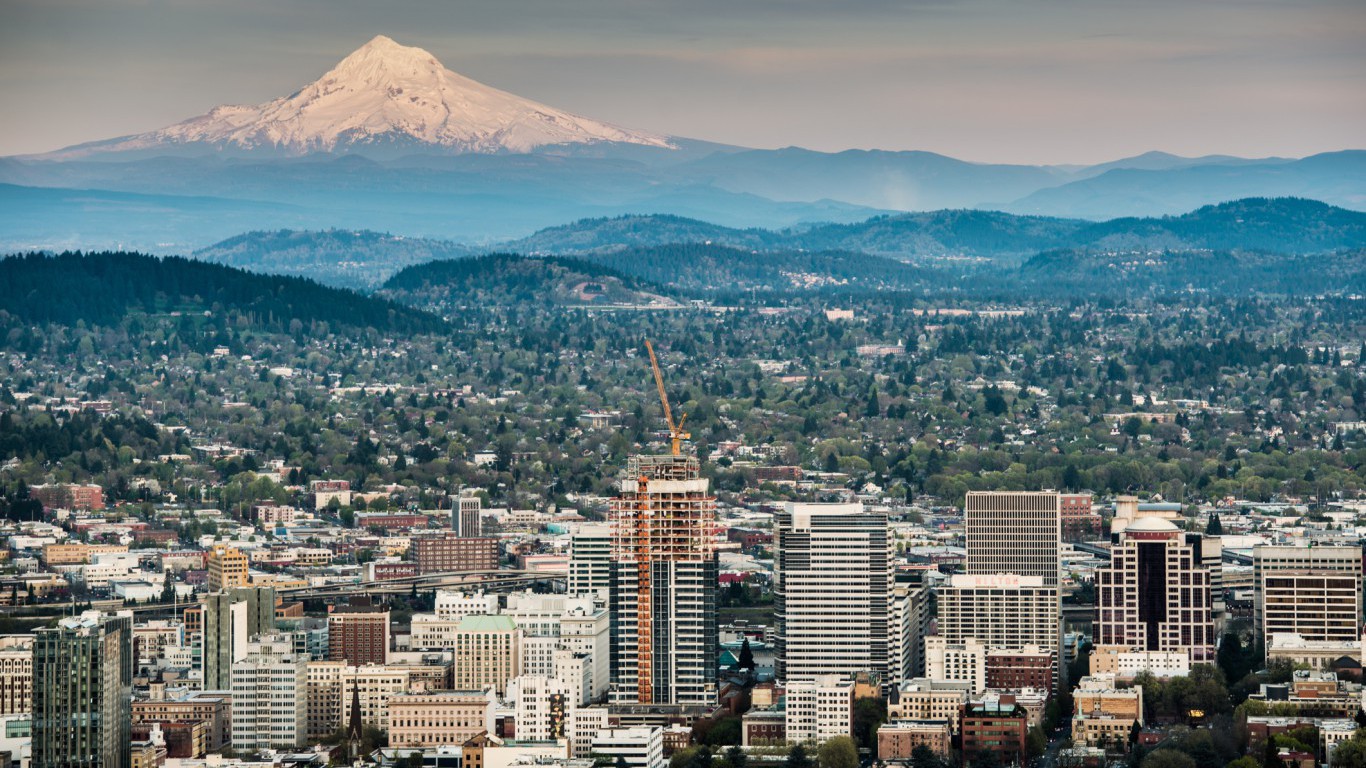
Source: Thinkstock
3. Portland-Vancouver-Hillsboro, OR-WA
> Traffic fatalities: 7.0 deaths per 100,000 residents
> Avg. commute: 27.5 minutes
> Avg. vehicles per household: 1.0
> Avg. gas price: $2.74 per gallon
Owning a car in the Portland-Vancouver-Hillsboro area is safe but very costly. There were 7.0 road traffic fatalities per 100,000 residents, one of the lower rates among metro areas.
However, driving in the area is quite the financial burden. A gallon of gas costs $2.74 on average, 10th highest price in the nation. Also, commuters lose 29 gallons annually due to traffic jams, the second highest loss among U.S. metro areas.
Source: Thinkstock
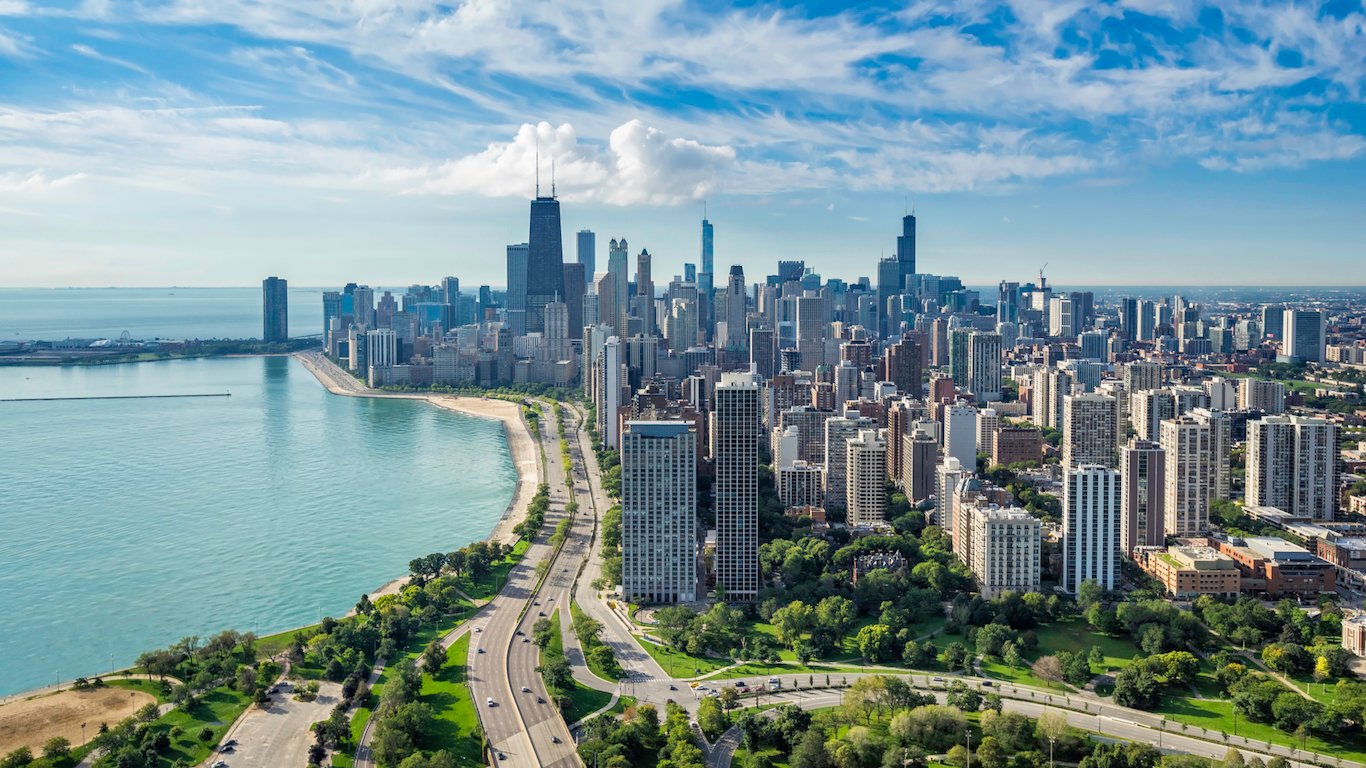
2. Chicago-Naperville-Elgin, IL-IN-WI
> Traffic fatalities: 6.1 deaths per 100,000 residents
> Avg. commute: 31.8 minutes
> Avg. vehicles per household: 1.0
> Avg. gas price: $2.85 per gallon
Chicago-Naperville-Elgin is one of the most populous metro areas in the country, which means many drivers are crowding the streets and highways each day. Drivers take an average of 31.8 minutes to get to work, the 10th longest commute among metro areas.
Those lengthy commutes, combined with the Windy City’s high gas prices, can really be a drain on drivers’ wallets. Gas costs an average of $2.85 per gallon in the Chicago metro area, the fifth most expensive price in the country.
[in-text-ad-2]
Source: Thinkstock
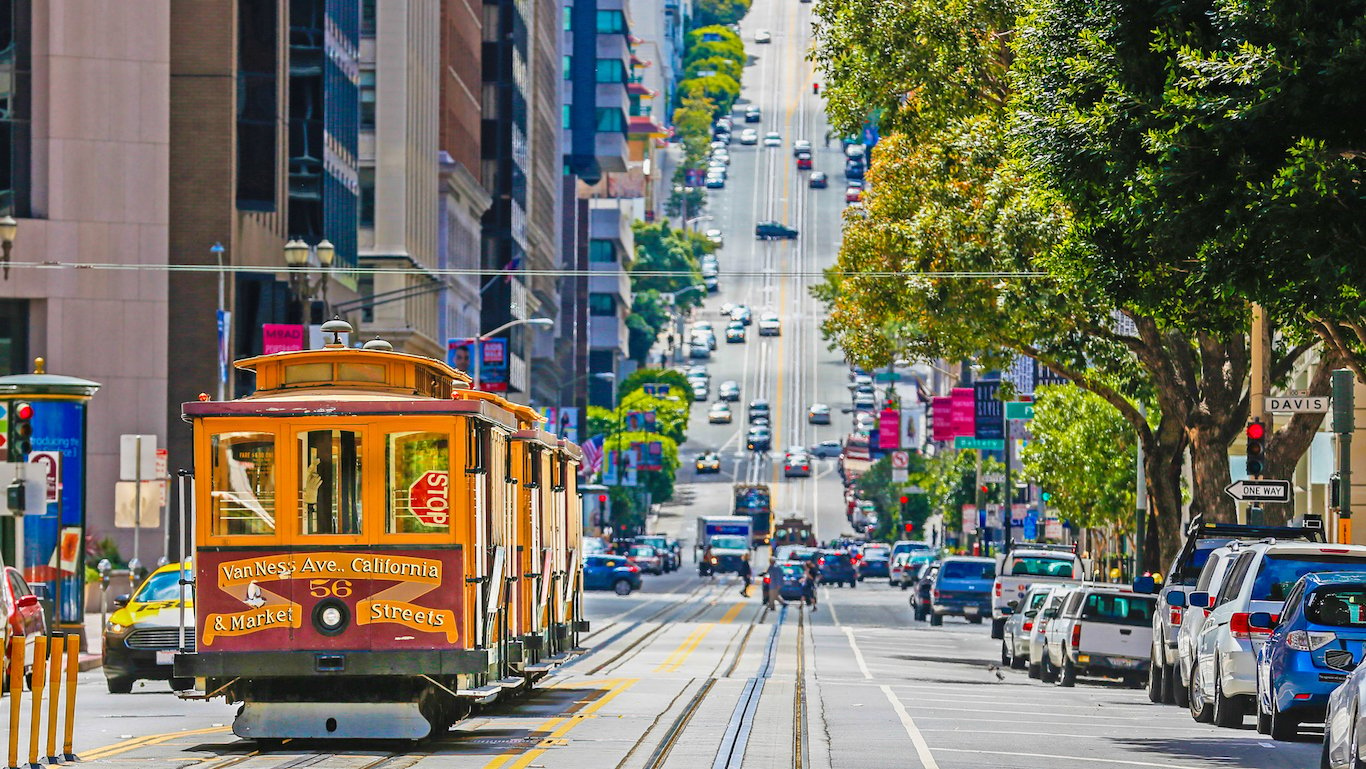
1. San Francisco-Oakland-Hayward, CA
> Traffic fatalities: 5.2 deaths per 100,000 residents
> Avg. commute: 33.6 minutes
> Avg. vehicles per household: 0.9
> Avg. gas price: $2.97 per gallon
Gas prices tend to be high in California, and San Francisco is no exception. Gas in the San Francisco metro area costs an average of $2.97 per gallon, the most of any U.S. metro area except the San Jose metro area. High gas prices are especially costly to area drivers as delays due to traffic jams account for an average of 27 wasted gallons of fuel per year per driver, one of the higher totals in the U.S.
Car theft is also a major problem for motorists in the Bay Area. There are about 640 car thefts for every 100,000 residents per year, more than six times the national rate.
Detailed Findings & Methodology
Traffic delays and congestion are among the most frustrating aspects of driving. In metro areas across the United States, motorists waste entire days sitting in traffic over the course of a year. In the Baltimore, Maryland metro area, for example, one of the worst in the country for drivers, commuters lose an average of 65 hours annually to traffic delays — several times the hours lost in most metro areas.
Idling in traffic is not only a waste of time, but also a waste of fuel. In the majority of U.S. metro areas, the average commuter wastes over 7 gallons of fuel per year to traffic. In the cities on this list, the waste is often far greater. In the Allentown-Bethlehem-Easton metro area in Pennsylvania and New Jersey, for example, the average commuter loses about 71 gallons of fuel per year sitting in traffic — the most of any metro area.
Wasted fuel can take a heavy toll on drivers’ pocket books. Though gas prices are significantly lower at the pump nationwide since the global slump in oil prices, in some cities, motorists are spending big on gasoline. In the vast majority of metro areas, the average cost of a gallon of gas is lower than $2.25. In many cities, a gallon of gas costs less than $2.00. At the other end of the spectrum, in a number of U.S. metro areas, particularly in California, gas prices are nearly $3.00 per gallon.
Fuel and other operating costs aside, a car will be one of the most expensive purchases many Americans will ever make. Unfortunately, their value makes vehicles prime targets for theft. Nationwide, there were about 103 vehicle thefts for every 100,000 people in 2016. In many of the cities on this list, motor vehicle theft is far more common. In Albuquerque, New Mexico, for example, there are 1,114 car thefts for every 100,000 people, more than 10 times the U.S. rate.
Theft is not the only danger car owners face. For many Americans, getting behind the wheel is the most dangerous thing they do on a regular basis. Some 35,000 Americans were killed in car accidents in 2015. Adjusting for population, there is considerable variance in road traffic fatalities from one city to another. Cities with higher rates of traffic deaths were penalized as being less safe for drivers.
To identify the worst metro areas in which to drive, 24/7 Wall St. created an index that consists of road fatalities, average commute time, car theft rate, average annual gallons of gas wasted due to traffic, average annual hours wasted due to traffic, and the average cost of a gallon of gas. Data on average wasted fuel per driver and the hours of delay spent per auto commuter in traffic in 2014 came from the Texas A&M Transportation Institute and was aggregated from the urban area level to metropolitan statistical areas using geographic definitions from the Census Bureau. The average price of gasoline for the period from second quarter 2016 to second quarter 2017 came from the Council for Community and Economic Research, and was also aggregated from urban areas to MSAs using Census Bureau definitions. The car theft rate is measured per 100,000 metro area residents and came from the National Insurance Crime Bureau’s “Hot Spots Vehicle Theft Report” that covers the rate of car theft for 2016. Roadway fatalities per 100,000 residents came from the Fatality Analysis Reporting System provided by the National Highway Traffic Safety Administration and are for 2016. The data was aggregated at a county level to a metropolitan level.
East Stroudsburg, Pennsylvania and California-Lexington Park, Maryland were excluded from the ranking due to insufficient data. There were 28 counties that had insufficient data for traffic fatalities per 100,000 residents and were not aggregated into the metro statistical area level.
Take This Retirement Quiz To Get Matched With An Advisor Now (Sponsored)
Are you ready for retirement? Planning for retirement can be overwhelming, that’s why it could be a good idea to speak to a fiduciary financial advisor about your goals today.
Start by taking this retirement quiz right here from SmartAsset that will match you with up to 3 financial advisors that serve your area and beyond in 5 minutes. Smart Asset is now matching over 50,000 people a month.
Click here now to get started.
Thank you for reading! Have some feedback for us?
Contact the 24/7 Wall St. editorial team.
Editors' Picks

