Over 37,000 Americans died in motor vehicle crashes in 2016, a 5.6% increase over the previous year — when deaths rose by 8.4%. The last time deaths caused by traffic accidents increased as much was in 1986.
According to several official sources, the increase in fatalities can be attributable, at least in part, to more drinking and driving and a greater overall number of people on the road, thanks to consistently low gas prices. But nationwide, traffic fatalities vary considerably across states.
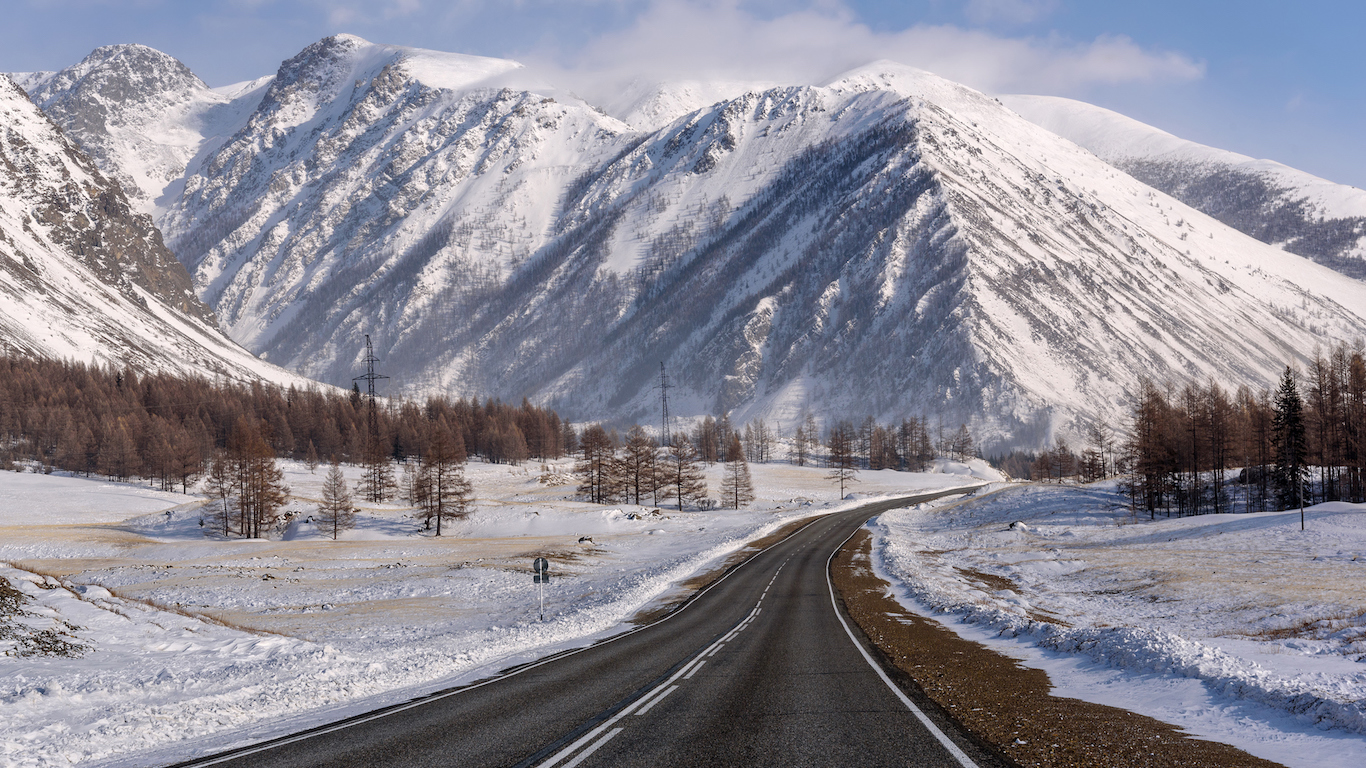
While factors outside of the control of drivers, such as weather and road conditions, can increase or lower the risk of injury, much of the regional differences in traffic fatalities have to do with driver choice.
EverQuote, an online car insurance shopping service, produces EverDrive, an app that allows drivers to monitor their driving habits, including phone use, speeding, risky braking, acceleration, and turning. Using data from app users, EverQuote published “The 2016-2017 EverDrive Safe Driving Report.” The report grades each state according to driver safety habits — habits that could have life or death implications.
The report found an interesting correlation. The states where drivers are less likely to break the speed limit or otherwise engage in dangerous behavior actually have higher roadside fatality rates. On the other hand, states where drivers engage in risky behavior more often have lower car accident fatality rates. This has more to do with state laws such as speed limits and state geographical makeup, such as urban versus more rural states.
Click here to see which state has the safest drivers.
Click here to see our detailed findings and methodology.
Source: Thinkstock
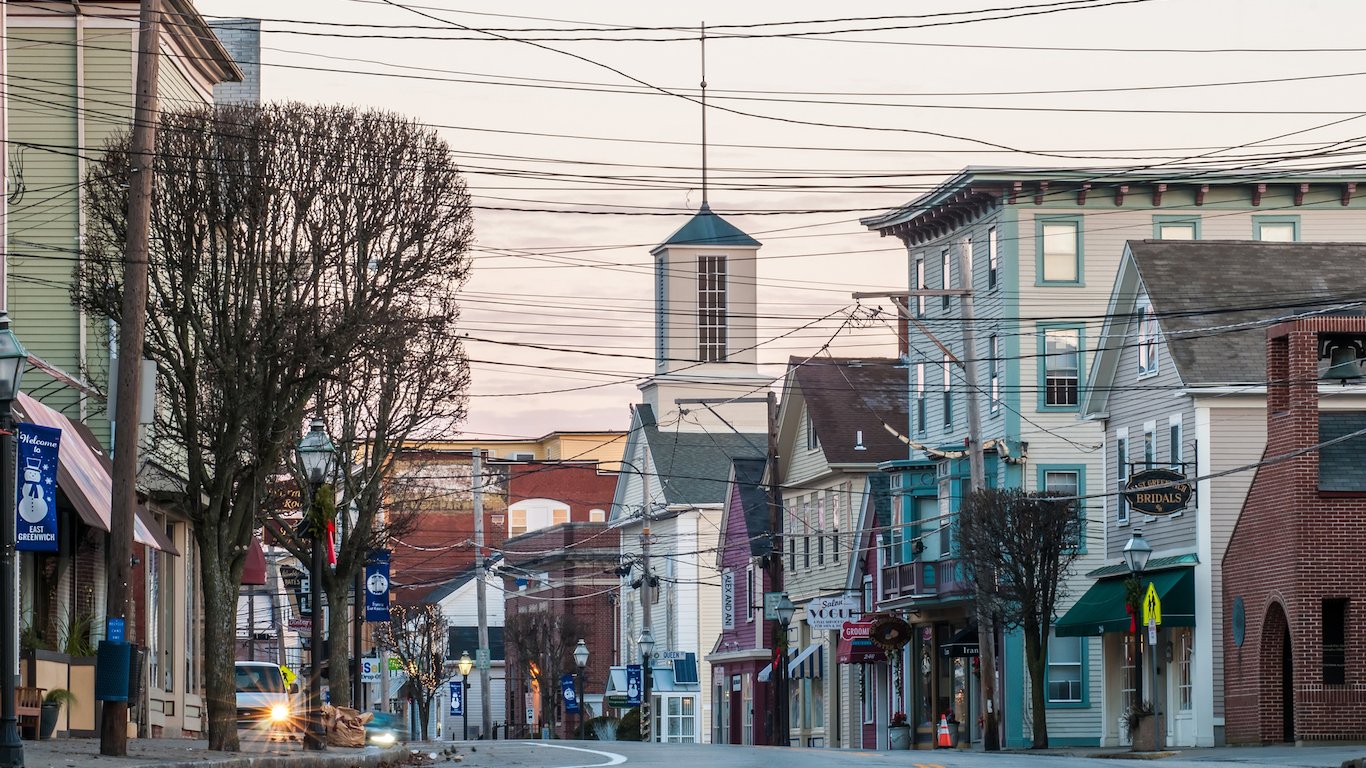
50. Rhode Island
> Phone use rate: 37.9% of trips (22nd highest)
> Speeding rate: 56.7% of trips (the highest)
> 2016 motor vehicle deaths per 100M miles: 0.57 (2nd fewest)
> Seat belt use: 87% of trips (tied — 24th highest)
[in-text-ad]
Source: Thinkstock
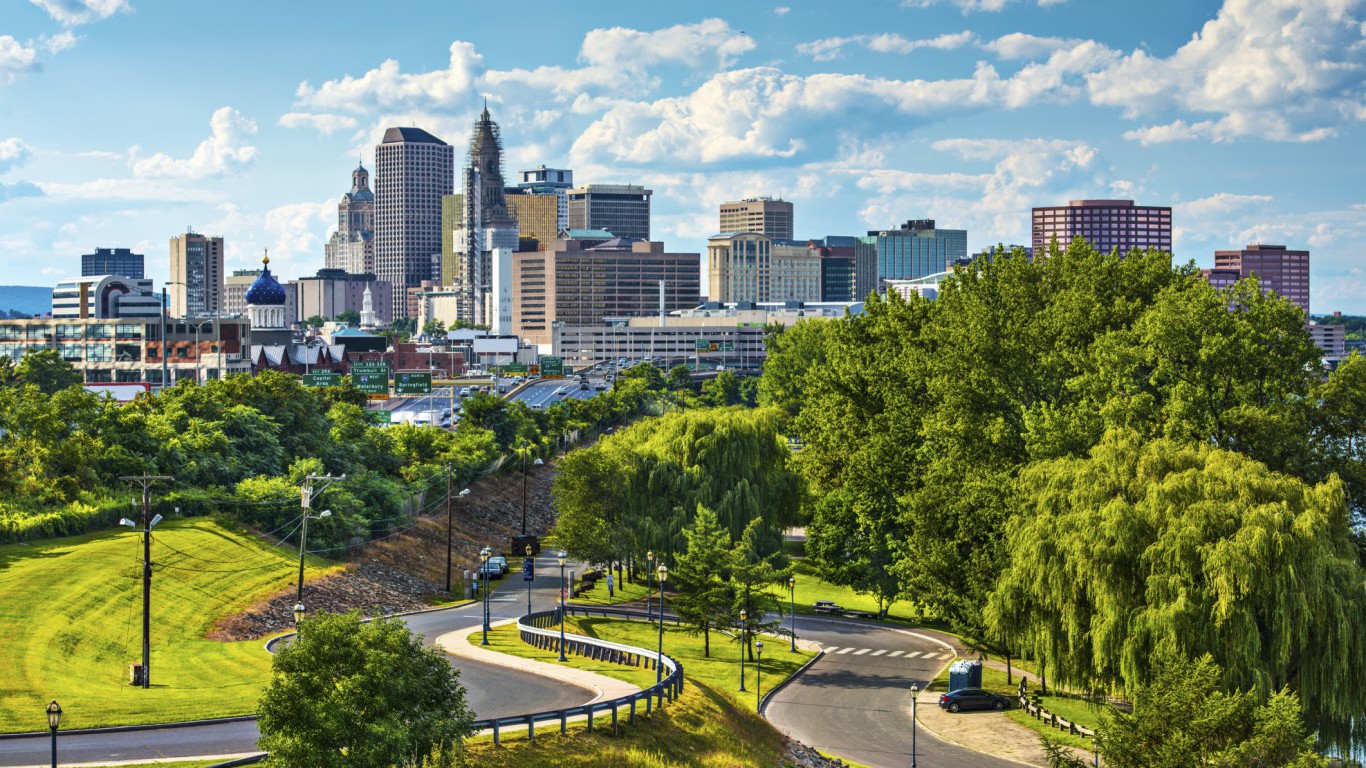
49. Connecticut
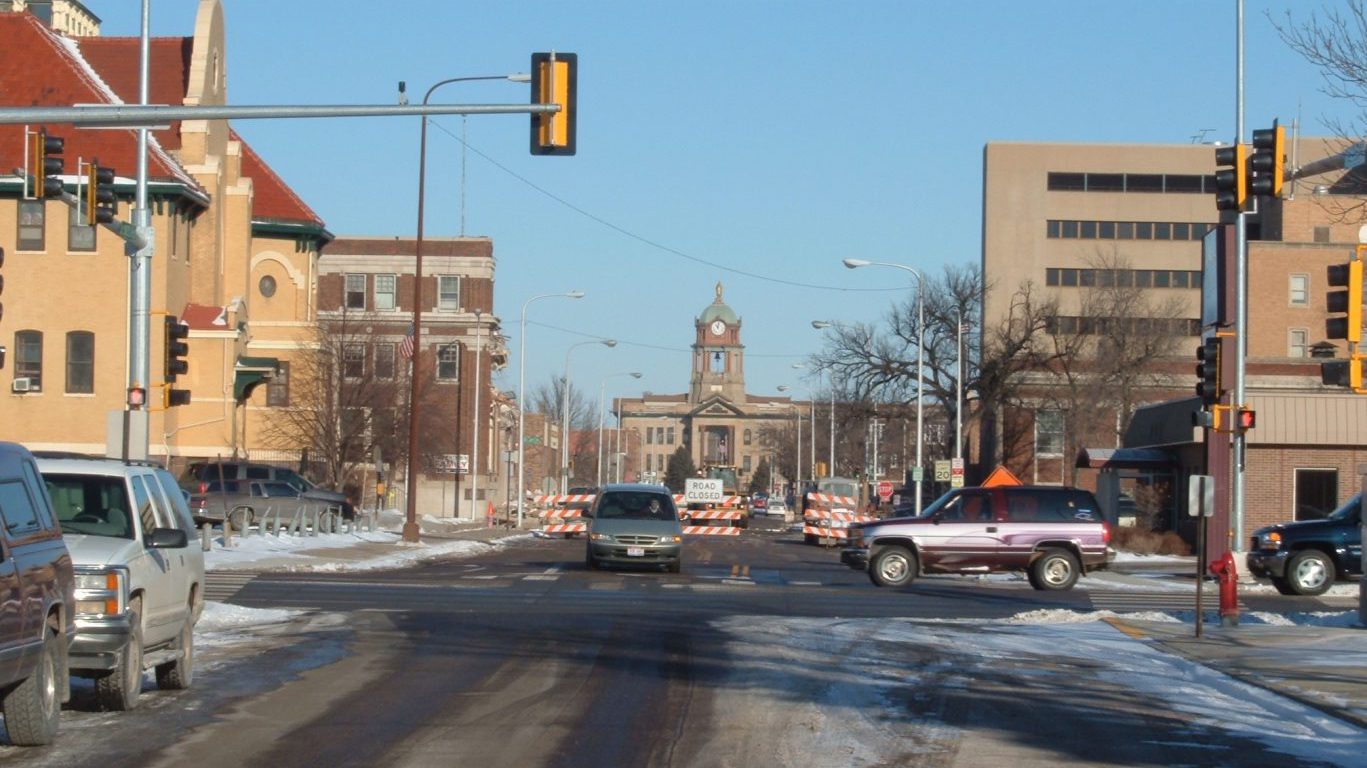
> Phone use rate: 31.1% of trips (6th lowest)
> Speeding rate: 53.3% of trips (2nd highest)
> 2016 motor vehicle deaths per 100M miles: 0.84 (6th fewest)
> Seat belt use: 85% of trips (tied — 16th lowest)
Source: https://www.flickr.com/photos/44458147@N00/
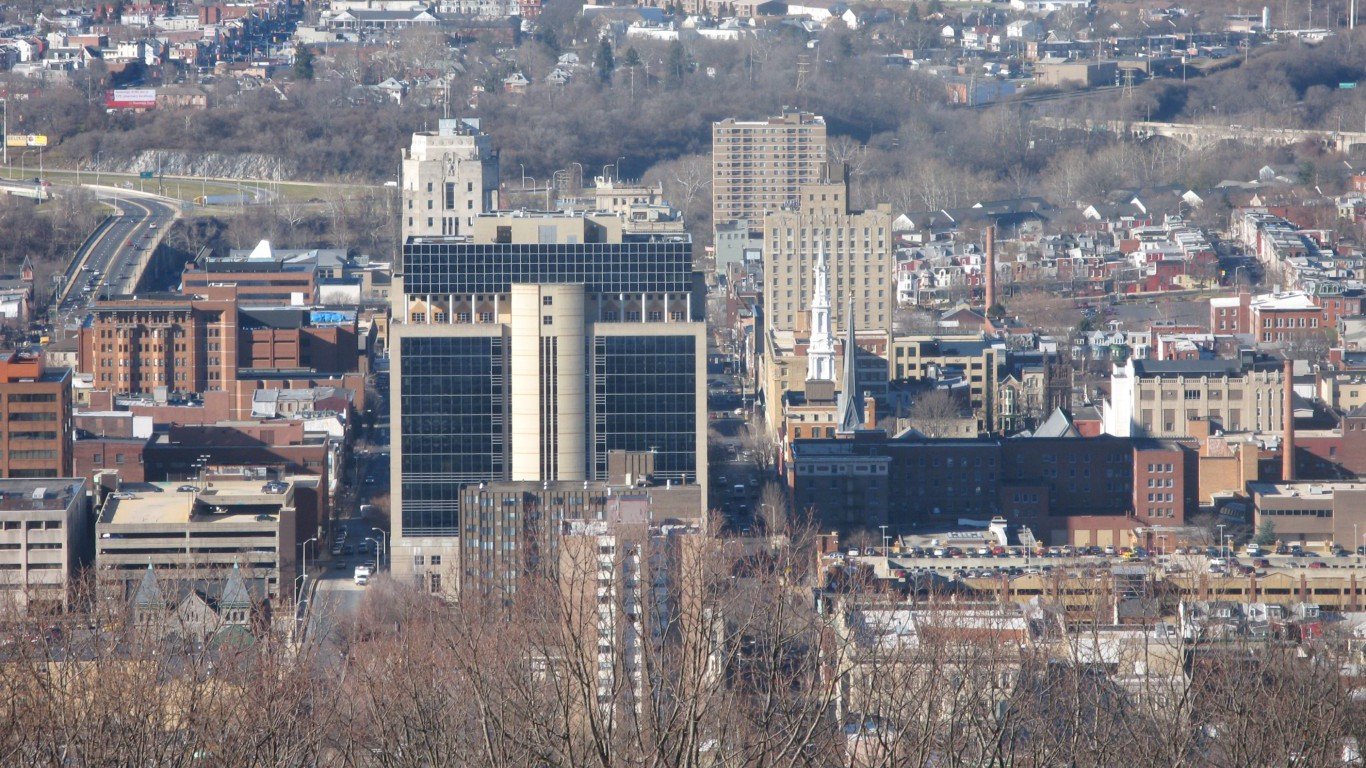
48. Pennsylvania
> Phone use rate: 37.5% of trips (25th lowest)
> Speeding rate: 47.0% of trips (6th highest)
> 2016 motor vehicle deaths per 100M miles: 1.19 (25th fewest)
> Seat belt use: 83% of trips (14th lowest)
Source: Thinkstock
47. New Jersey
> Phone use rate: 37.5% of trips (25th highest)
> Speeding rate: 43.8% of trips (9th highest)
> 2016 motor vehicle deaths per 100M miles: 0.75 (4th fewest)
> Seat belt use: 91% of trips (tied — 17th highest)
[in-text-ad-2]
Source: Thinkstock
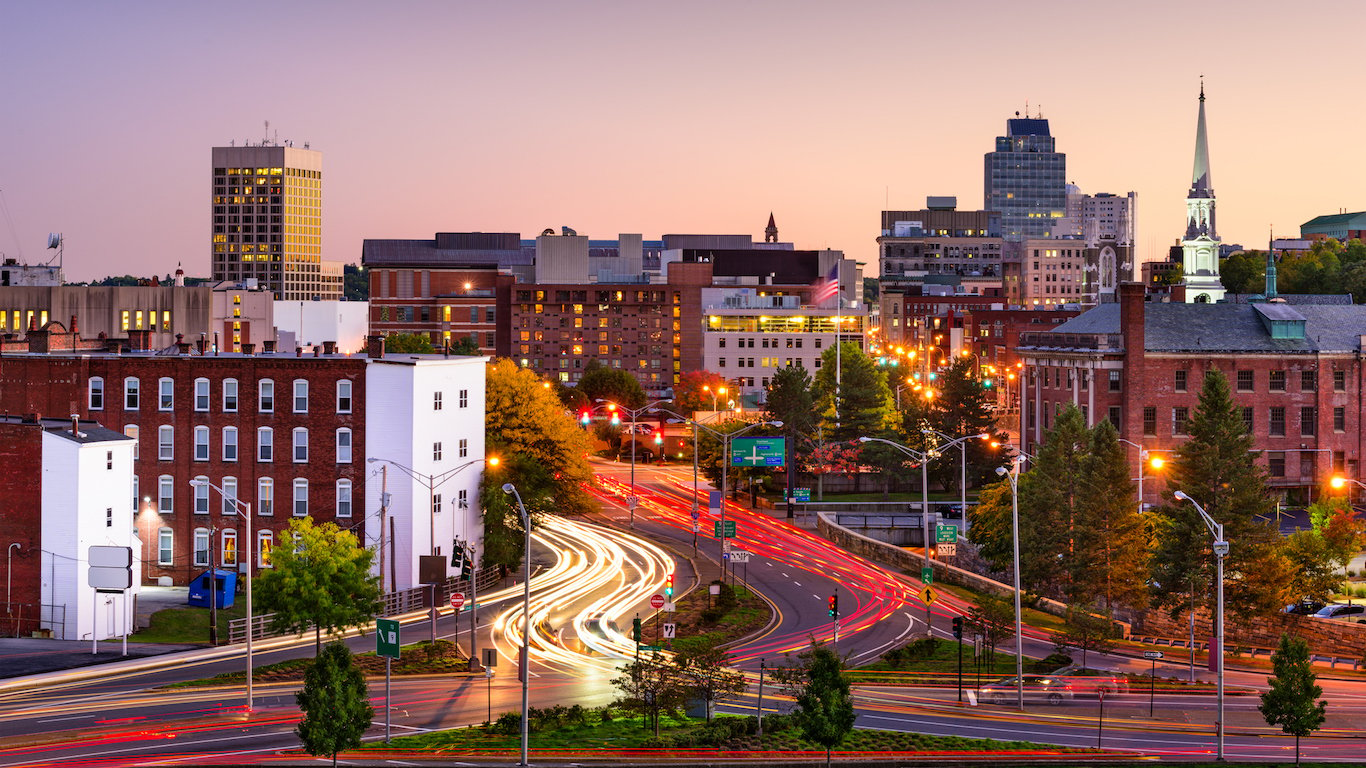
46. Massachusetts
> Phone use rate: 35.2% of trips (17th lowest)
> Speeding rate: 44.5% of trips (8th highest)
> 2016 motor vehicle deaths per 100M miles: 0.52 (the fewest)
> Seat belt use: 74% of trips (tied — 2nd lowest)
Source: Thinkstock
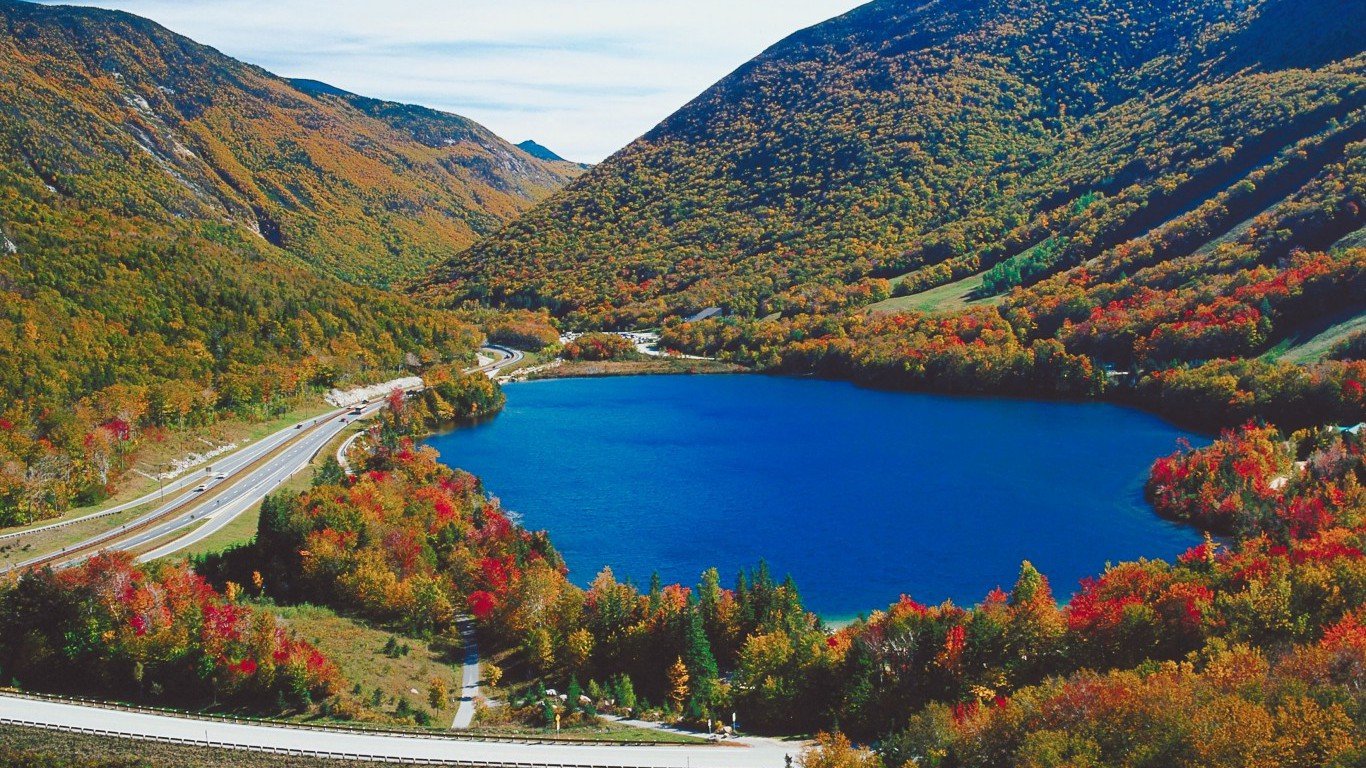
45. New Hampshire
> Phone use rate: 31.5% of trips (7th lowest)
> Speeding rate: 51.7% of trips (4th highest)
> 2016 motor vehicle deaths per 100M miles: 0.87 (7th fewest)
> Seat belt use: 70% of trips (tied — the lowest)
[in-text-ad]
Source: Thinkstock
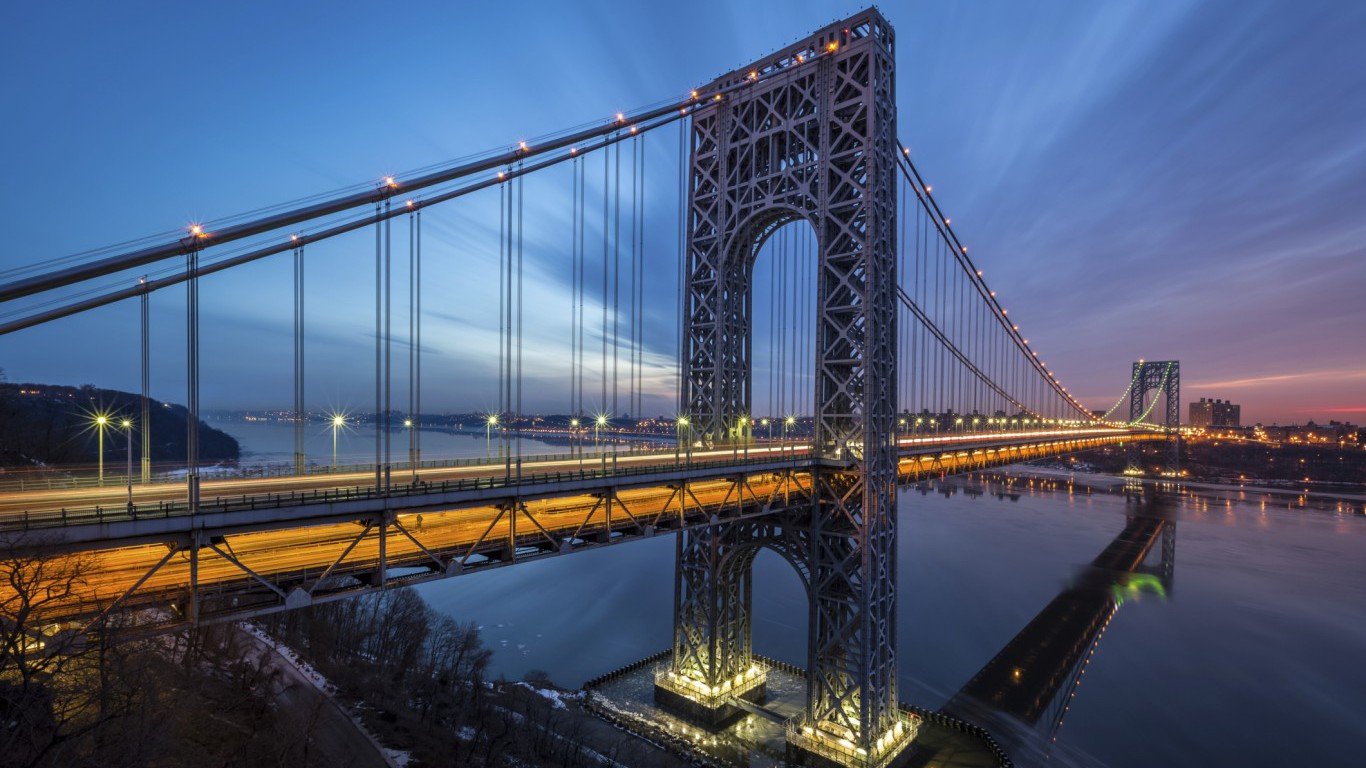
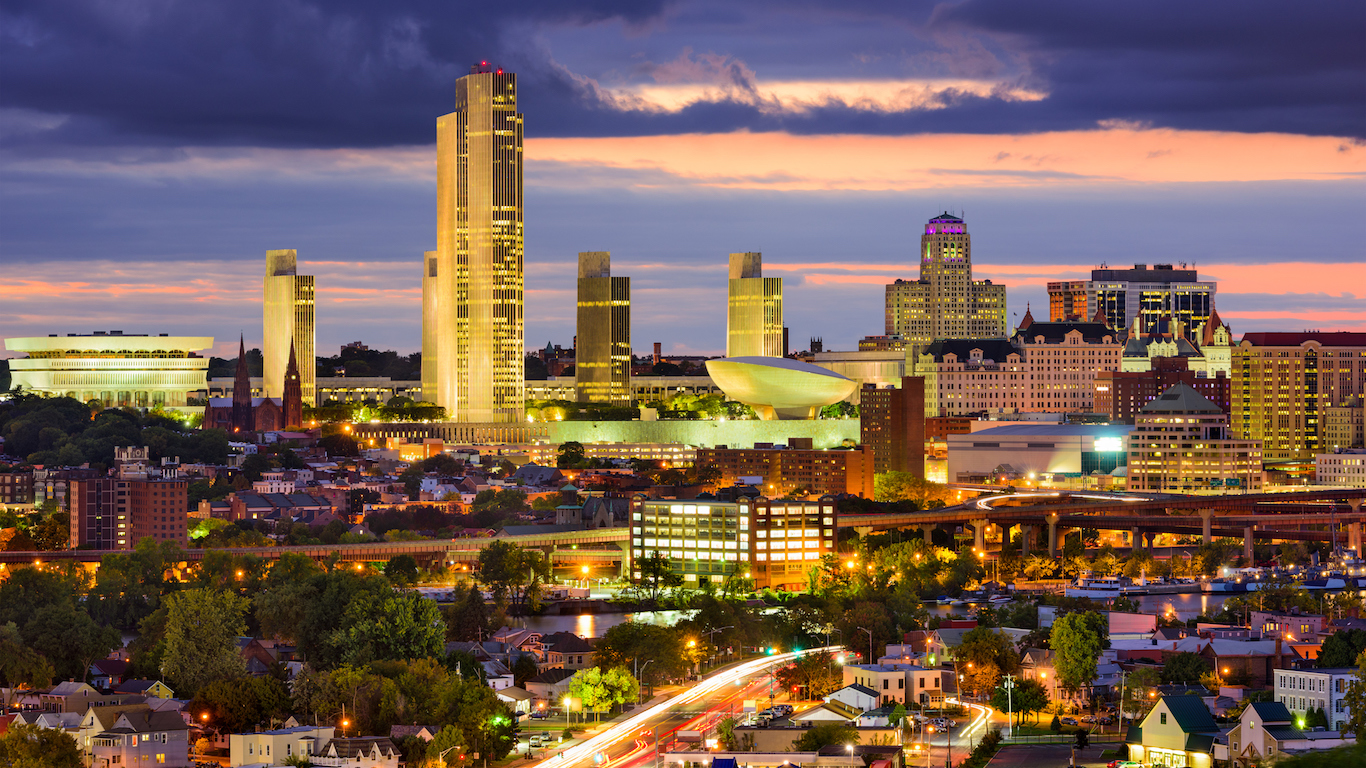
44. New York
> Phone use rate: 34.6% of trips (11th lowest)
> Speeding rate: 41.8% of trips (12th highest)
> 2016 motor vehicle deaths per 100M miles: 0.88 (8th fewest)
> Seat belt use: 92% of trips (tied — 13th highest)
 24/7 Wall St.
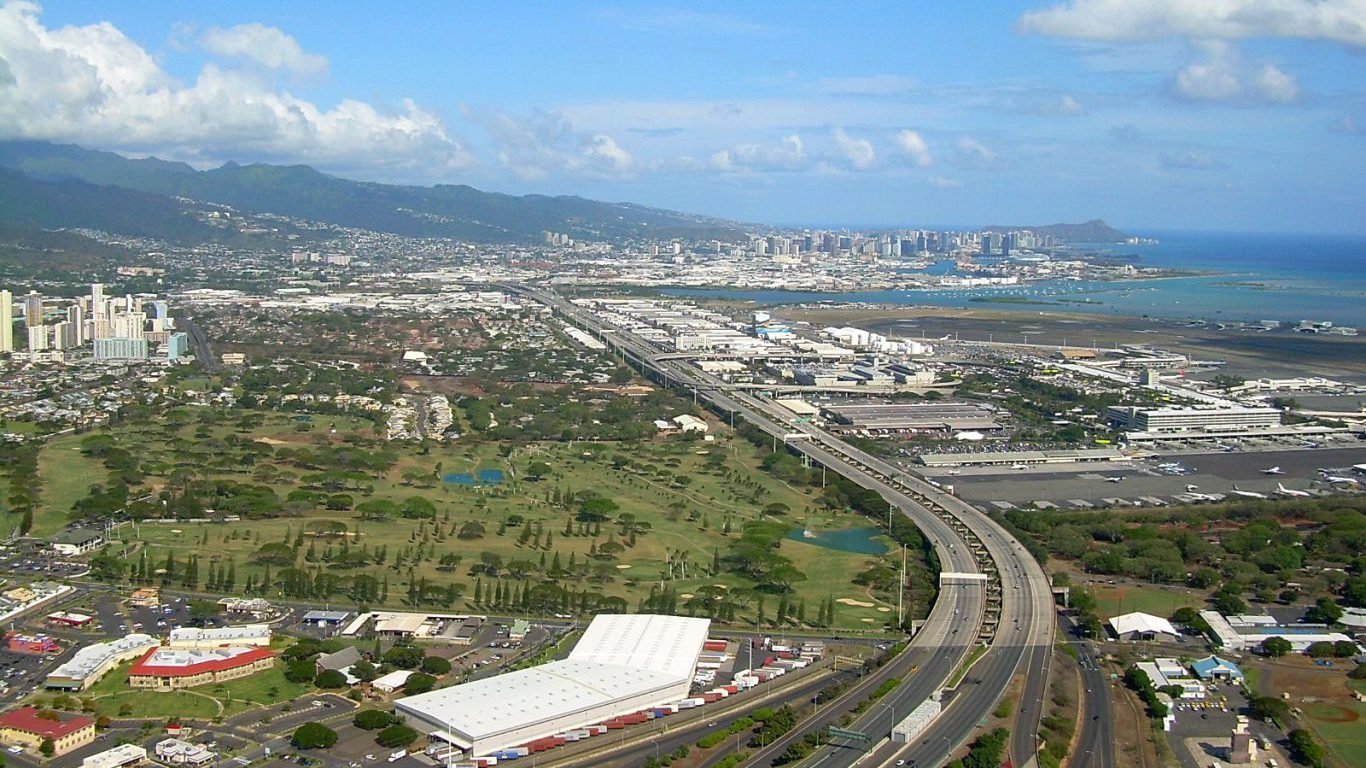
Source: ErgoSum88 / Wikimedia Commons
43. Hawaii
> Phone use rate: 30.6% of trips (5th lowest)
> Speeding rate: 52.1% of trips (3rd highest)
> 2016 motor vehicle deaths per 100M miles: 0.91 (12th fewest)
> Seat belt use: 93% of trips (tied — 7th highest)
Source: Thinkstock
42. Delaware
> Phone use rate: 39.5% of trips (17th highest)
> Speeding rate: 45.7% of trips (7th highest)
> 2016 motor vehicle deaths per 100M miles: 1.27 (17th most)
> Seat belt use: 90% of trips (tied — 19th highest)
[in-text-ad-2]
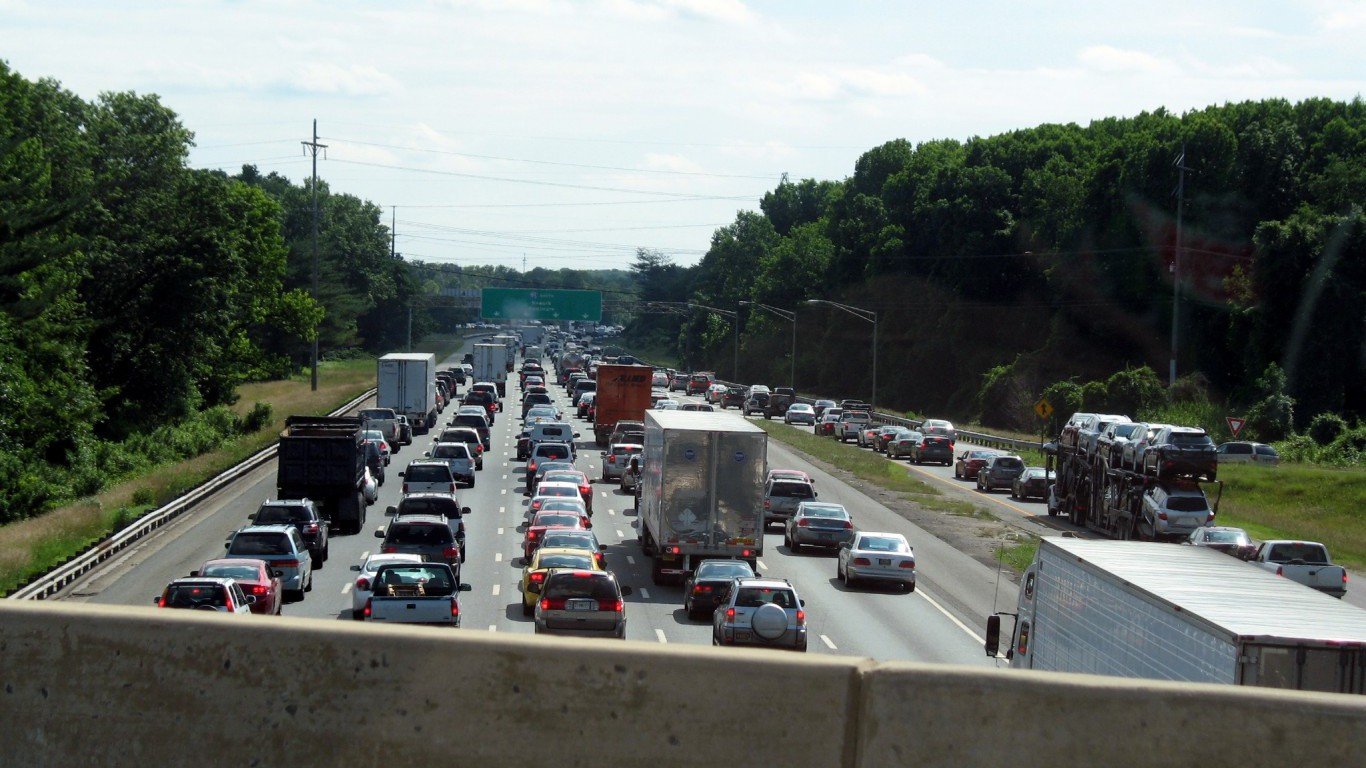
Source: Thinkstock
41. Maryland
> Phone use rate: 37.7% of trips (23rd highest)
> Speeding rate: 47.7% of trips (5th highest)
> 2016 motor vehicle deaths per 100M miles: 0.89 (9th fewest)
> Seat belt use: 93% of trips (tied — 7th highest)
Source: Thinkstock
40. Nevada
> Phone use rate: 35.8% of trips (22nd lowest)
> Speeding rate: 40.1% of trips (14th highest)
> 2016 motor vehicle deaths per 100M miles: 1.25 (19th most)
> Seat belt use: 92% of trips (tied — 13th highest)
[in-text-ad]
Source: Thinkstock
39. California
> Phone use rate: 35.0% of trips (15th lowest)
> Speeding rate: 32.3 (18th lowest)
> 2016 motor vehicle deaths per 100M miles: 0.95 (16th fewest)
> Seat belt use: 97% of trips (tied — the highest)
Source: Thinkstock
38. Illinois
> Phone use rate: 37.6% of trips (24th highest)
> Speeding rate: 38.4% of trips (18th highest)
> 2016 motor vehicle deaths per 100M miles: 0.95 (16th fewest)
> Seat belt use: 95% of trips (tied — 4th highest)
Source: Thinkstock
37. Florida
> Phone use rate: 44.0% of trips (2nd highest)
> Speeding rate: 38.1% of trips (20th highest)
> 2016 motor vehicle deaths per 100M miles: 1.42 (9th most)
> Seat belt use: 89% of trips (tied — 21st highest)
[in-text-ad-2]
Source: Thinkstock
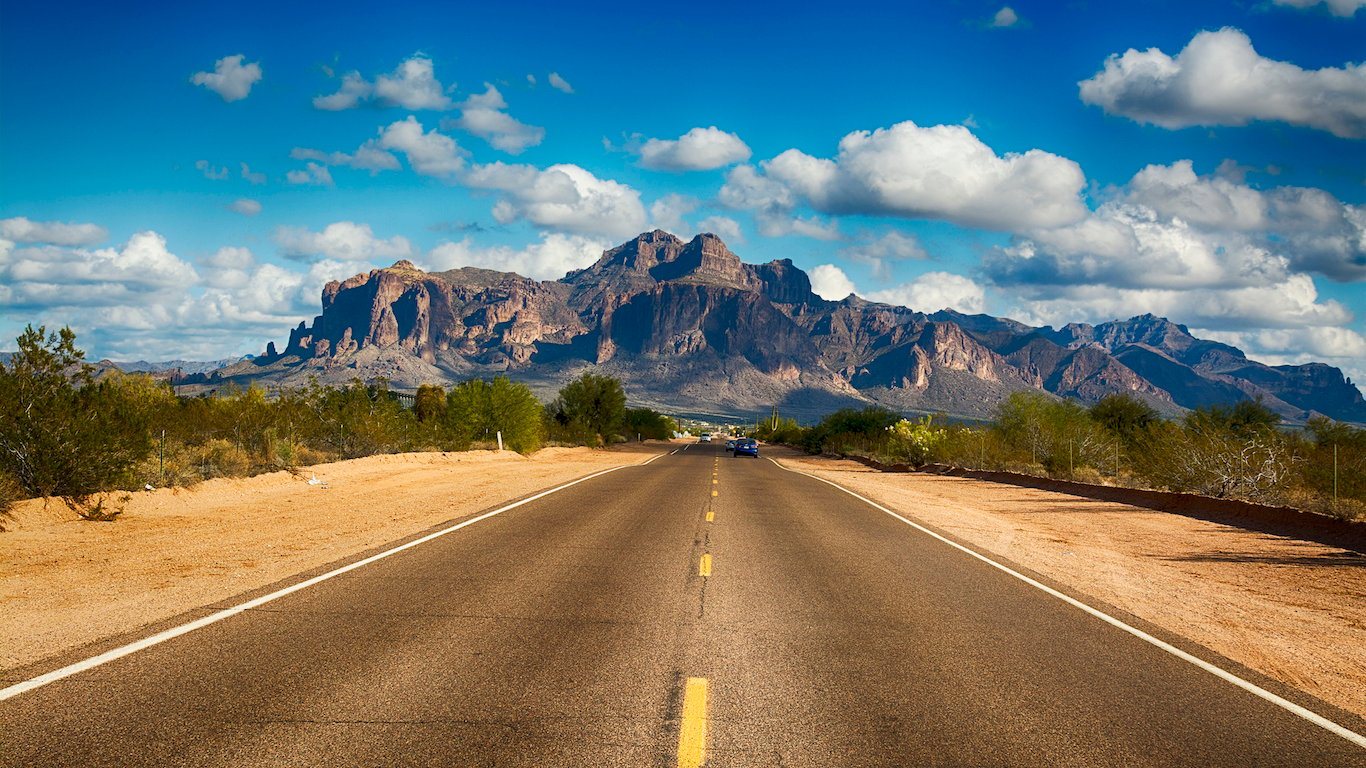
36. Arizona
> Phone use rate: 40.6% of trips (9th highest)
> Speeding rate: 40.6% of trips (13th highest)
> 2016 motor vehicle deaths per 100M miles: 1.37 (10th most)
> Seat belt use: 87% of trips (tied — 24th highest)
Source: Thinkstock
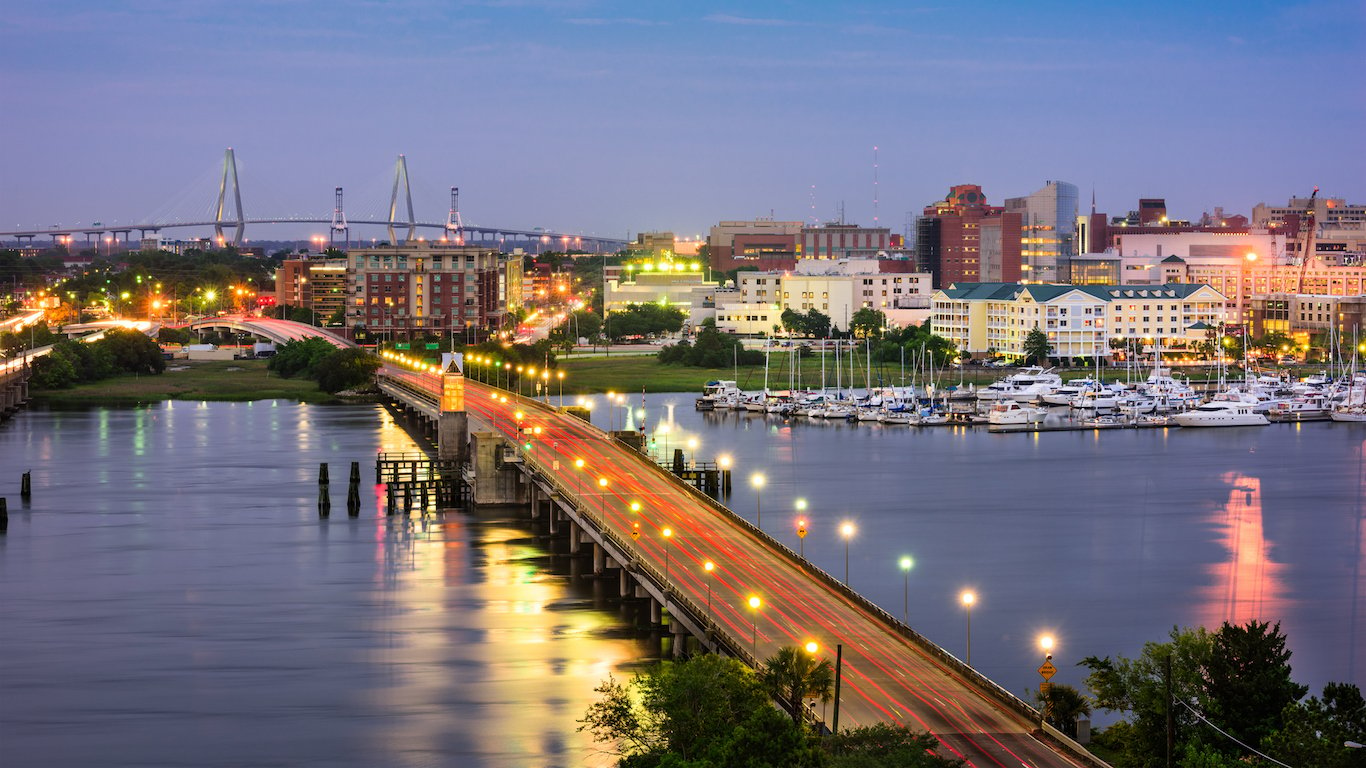
35. South Carolina
> Phone use rate: 42.3% of trips (5th highest)
> Speeding rate: 38.1% of trips (21st highest)
> 2016 motor vehicle deaths per 100M miles: 1.89 (the most)
> Seat belt use: 92% of trips (tied — 13th highest)
[in-text-ad]
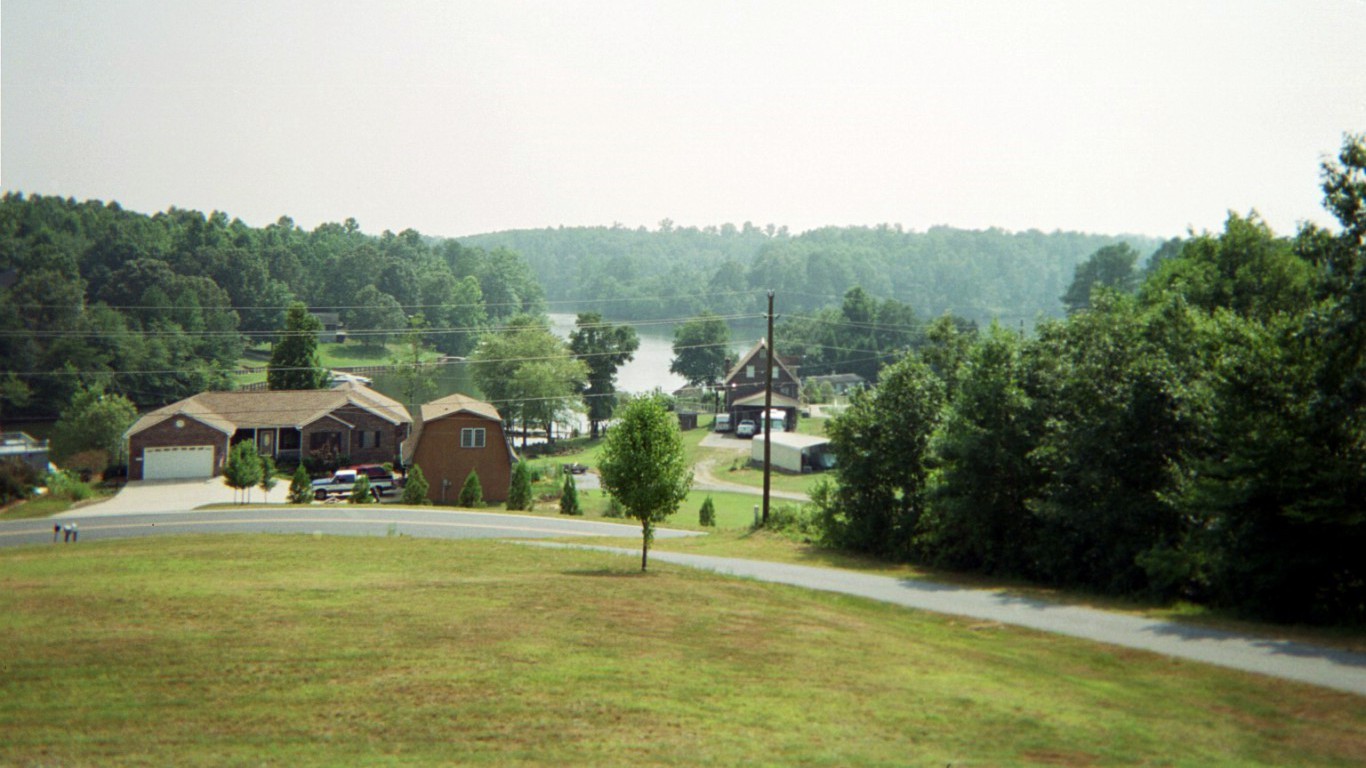
Source: Yahala / Wikimedia Commons
34. Indiana
> Phone use rate: 40.7% of trips (8th highest)
> Speeding rate: 39.3% of trips (16th highest)
> 2016 motor vehicle deaths per 100M miles: 1.04 (20th fewest)
> Seat belt use: 92% of trips (tied — 13th highest)
 24/7 Wall St.
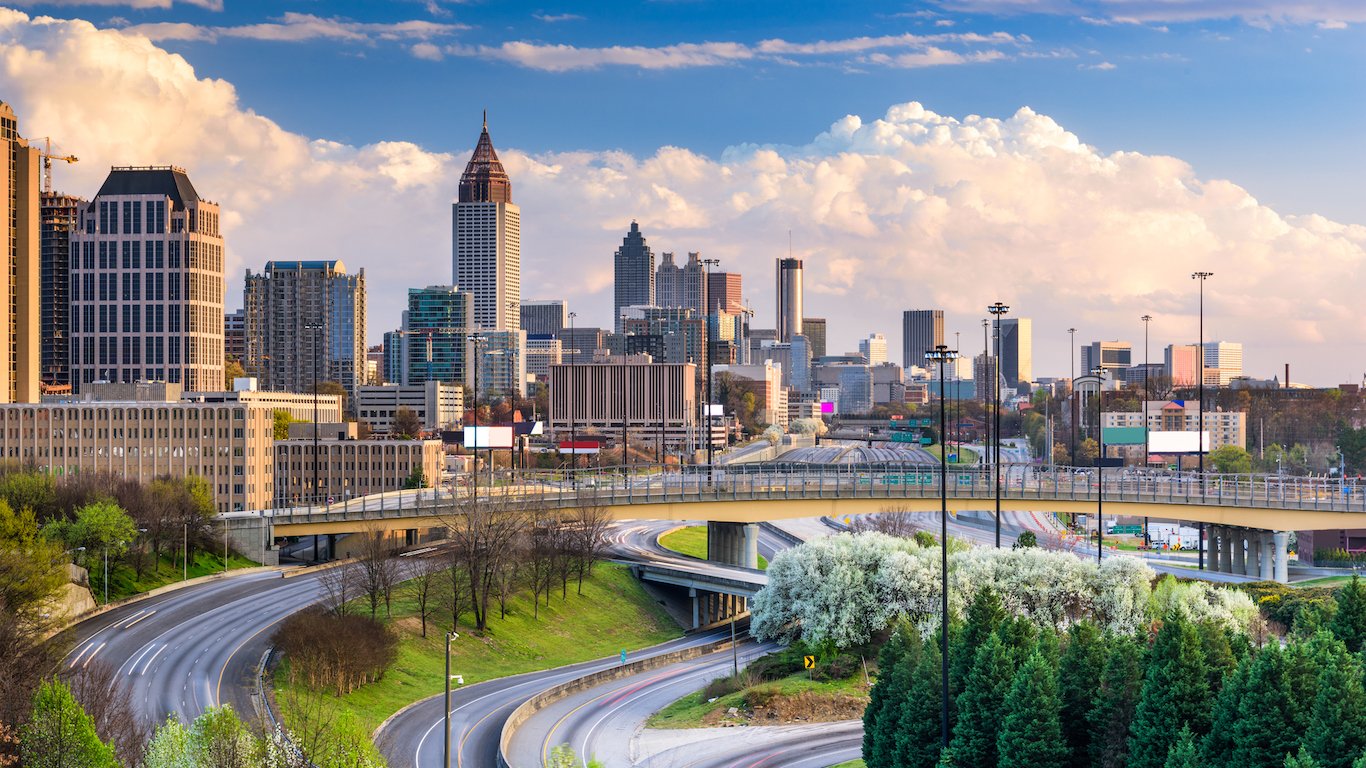
Source: Thinkstock
33. Georgia
> Phone use rate: 40.9% of trips (7th highest)
> Speeding rate: 38.4% of trips (19th highest)
> 2016 motor vehicle deaths per 100M miles: 1.21 (24th most)
> Seat belt use: 97% of trips (tied — the highest)
Source: BJ Ray / Shutterstock.com
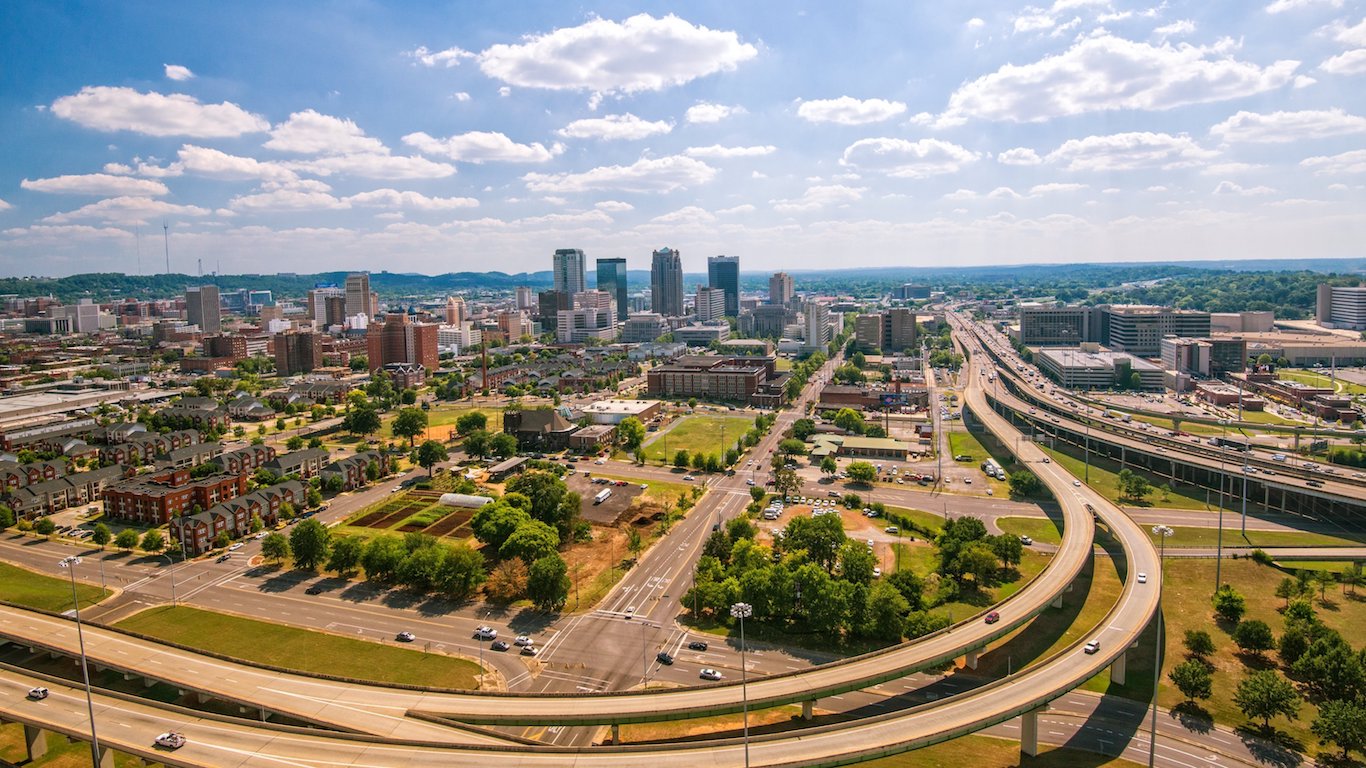
32. Alabama
> Phone use rate: 41.7% of trips (6th highest)
> Speeding rate: 43.5% of trips (10th highest)
> 2016 motor vehicle deaths per 100M miles: 1.26 (18th most)
> Seat belt use: 93% of trips (tied — 7th highest)
[in-text-ad-2]
Source: Thinkstock
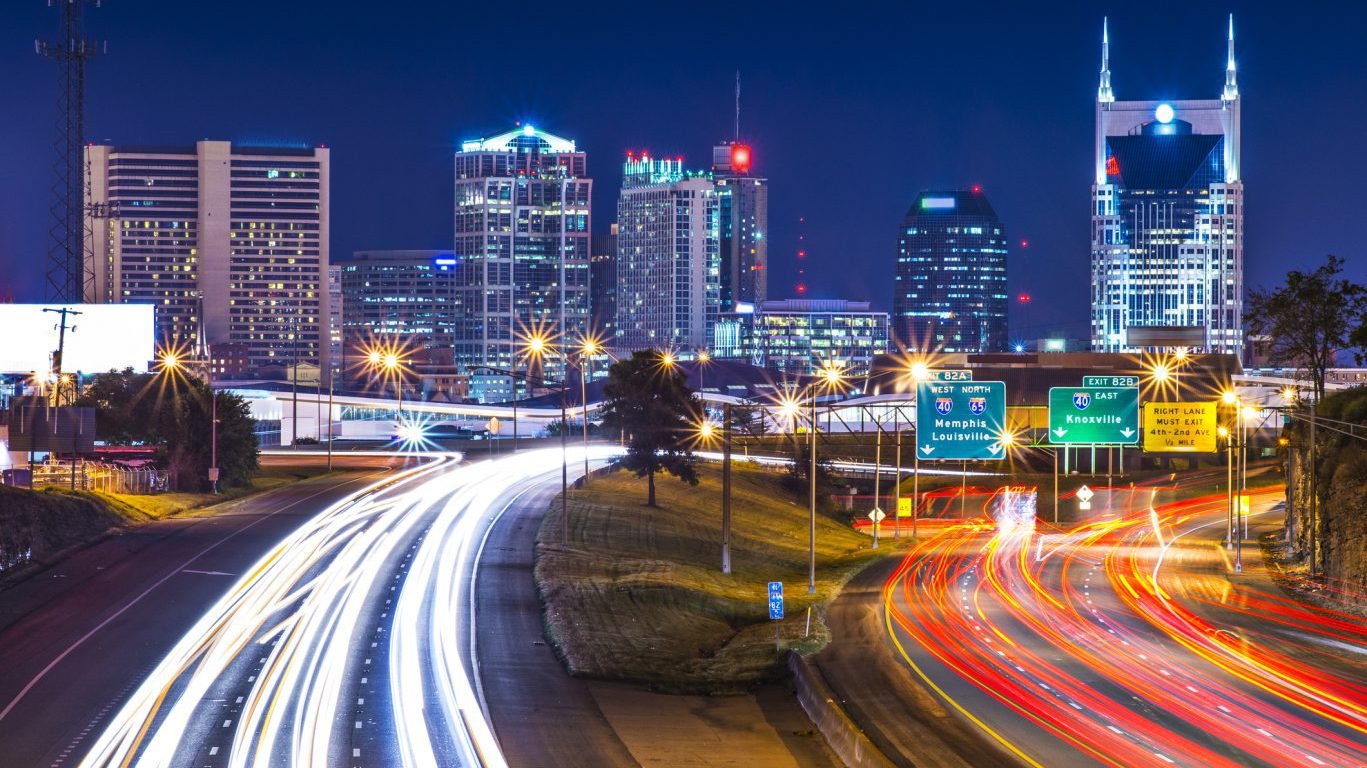
31. Tennessee
> Phone use rate: 43.9% of trips (3rd highest)
> Speeding rate: 37.8 (22nd highest)
> 2016 motor vehicle deaths per 100M miles: 1.25 (19th most)
> Seat belt use: 86 (tied — 19th lowest)
Source: Thinkstock
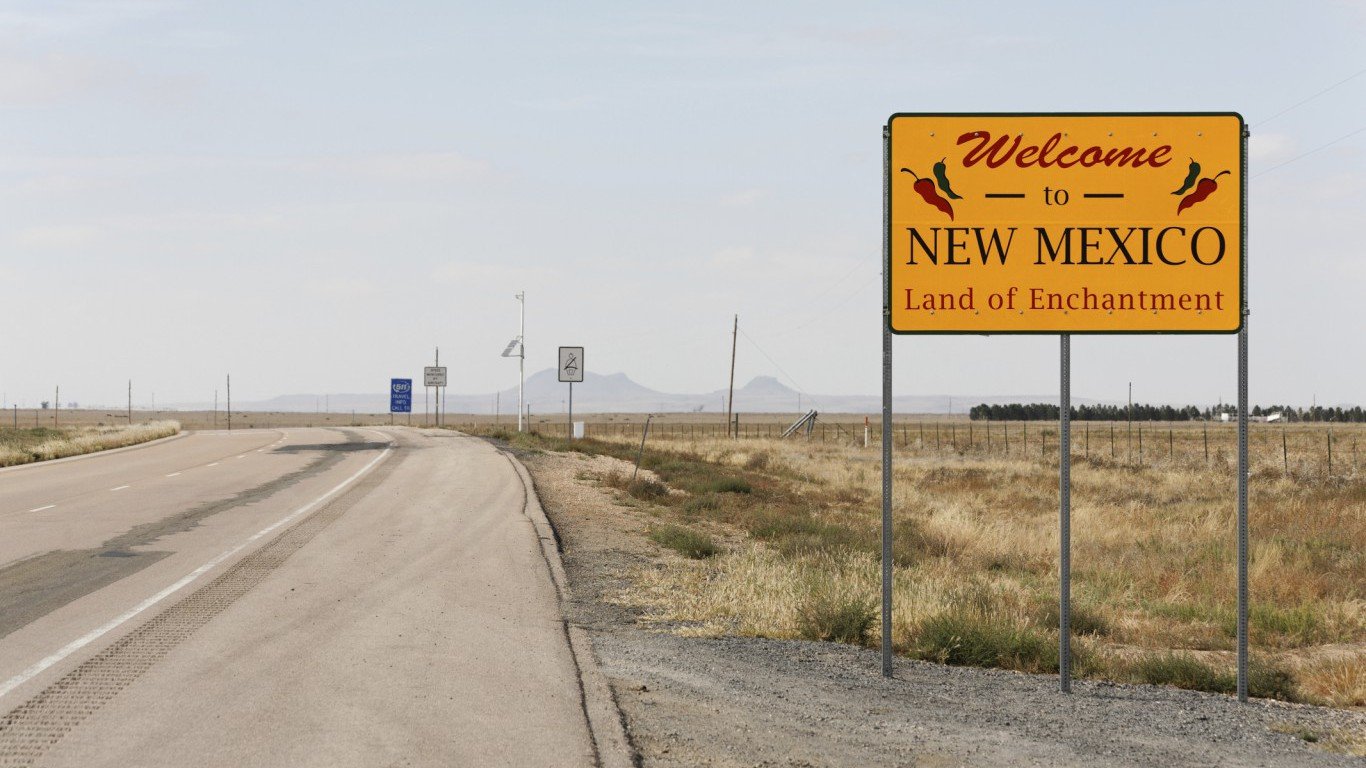
30. New Mexico
> Phone use rate: 38.5% of trips (20th highest)
> Speeding rate: 33.2% of trips (22nd lowest)
> 2016 motor vehicle deaths per 100M miles: 1.09 (23rd fewest)
> Seat belt use: 93% of trips (tied — 7th highest)
[in-text-ad]
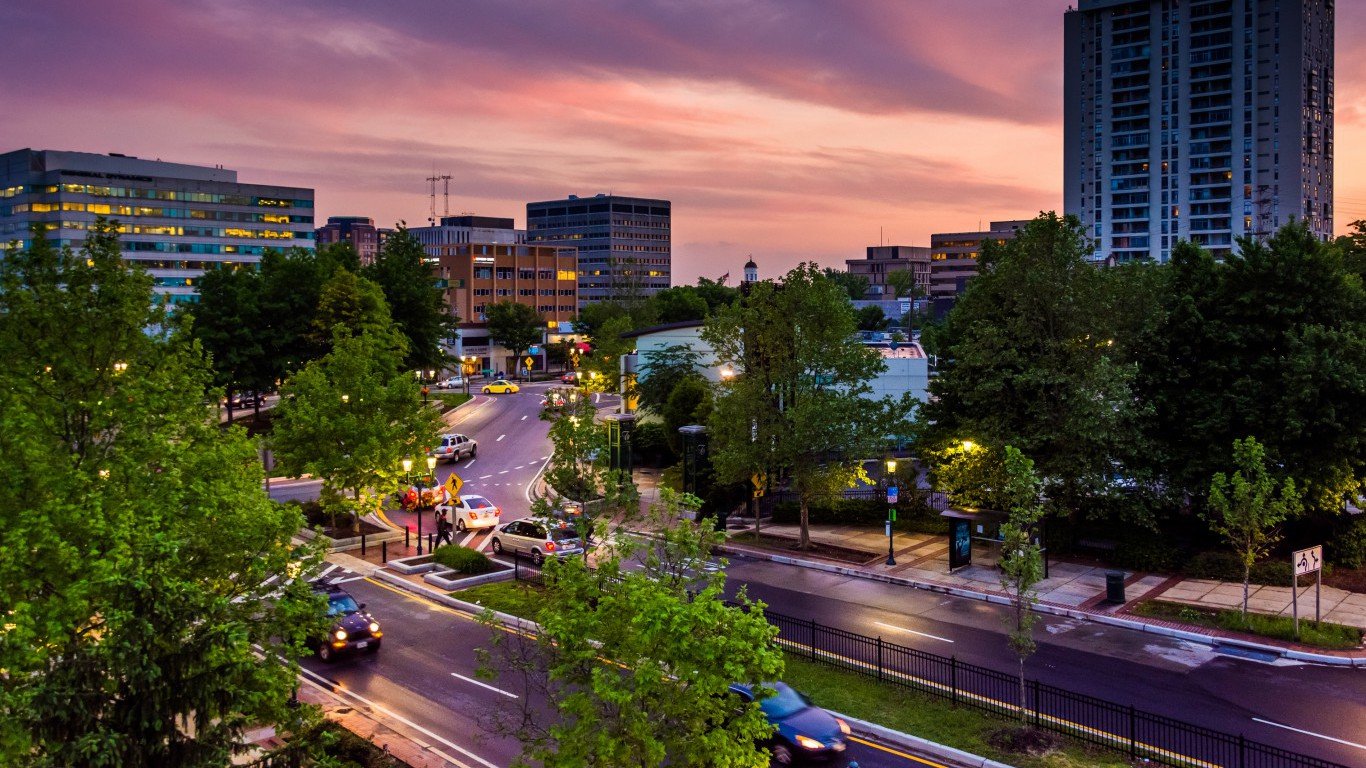
Source: Thinkstock
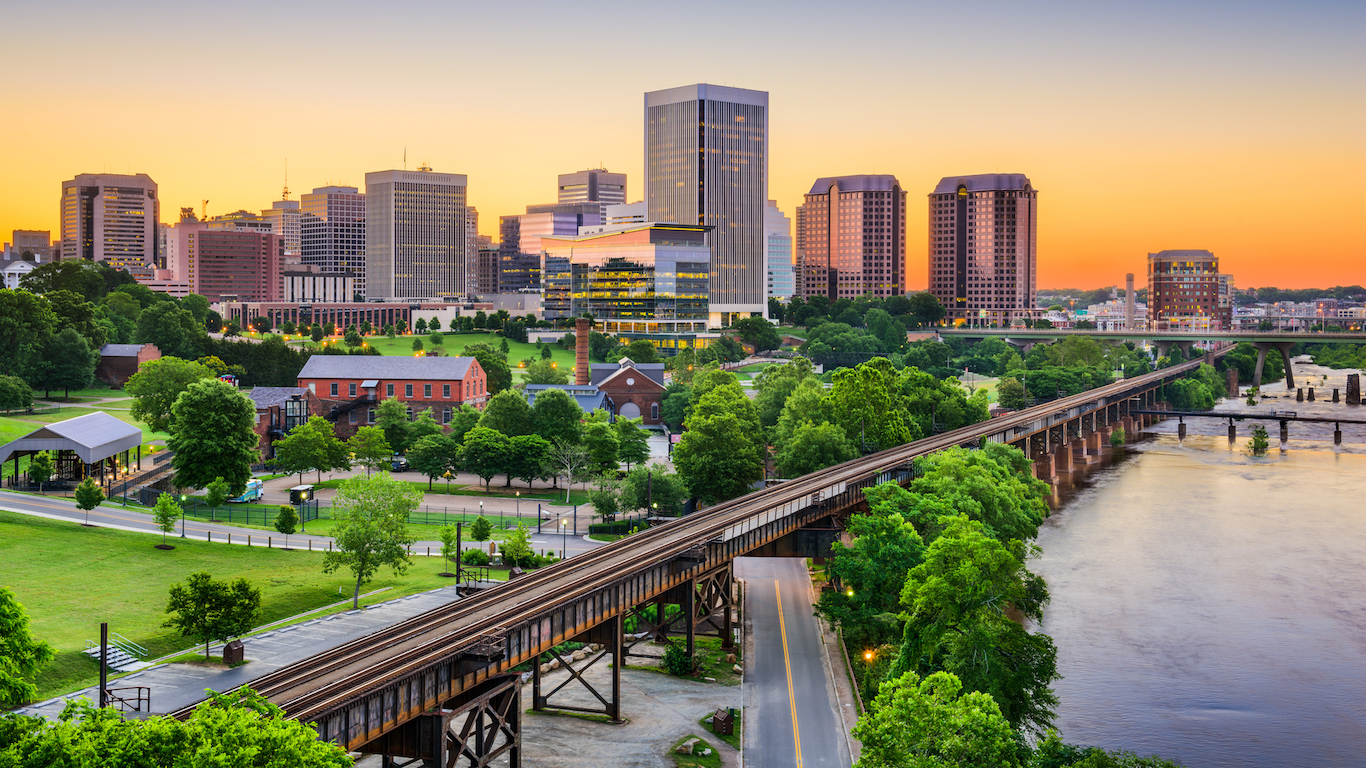
29. Virginia
> Phone use rate: 40.4% of trips (14th highest)
> Speeding rate: 37.7% of trips (23rd highest)
> 2016 motor vehicle deaths per 100M miles: 0.91 (12th fewest)
> Seat belt use: 81% of trips (tied — 11th lowest)
 24/7 Wall St.
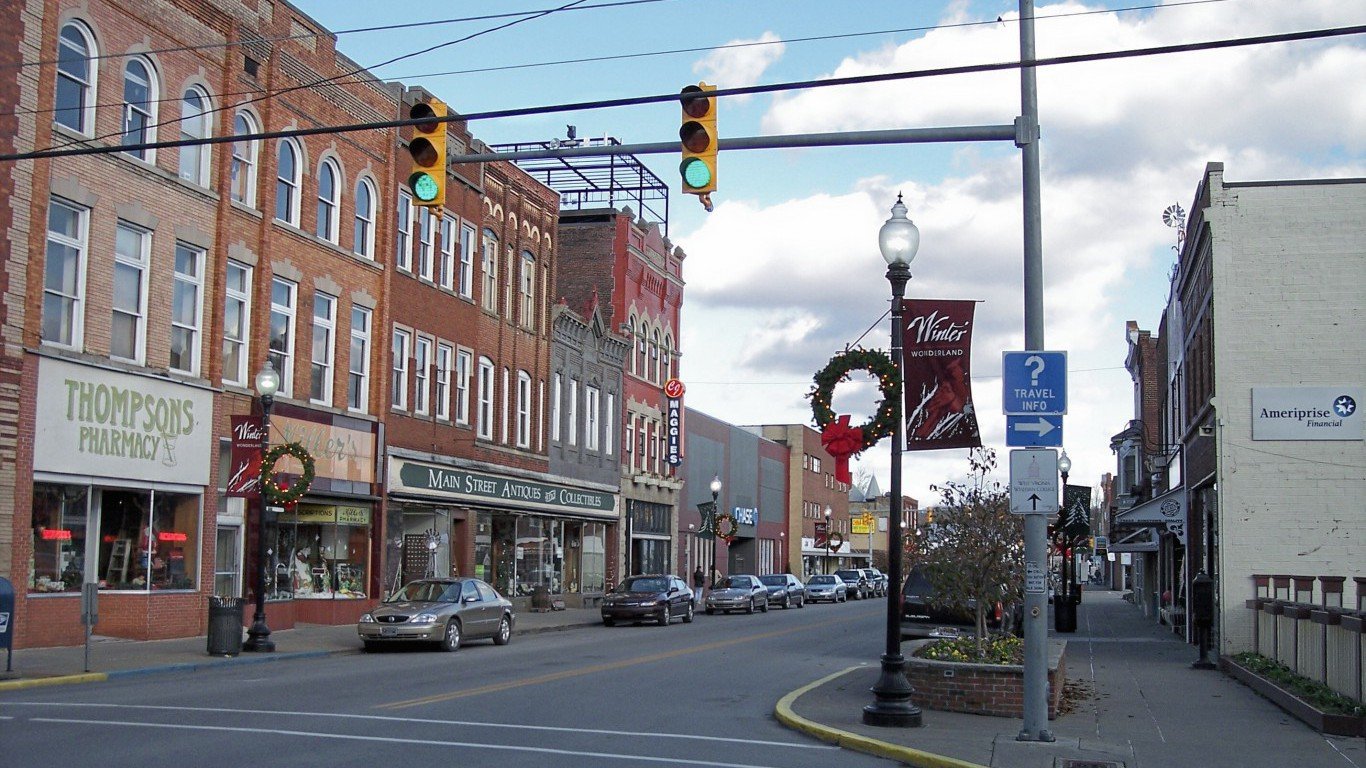
Source: Tim Kiser / Wikimedia Commons
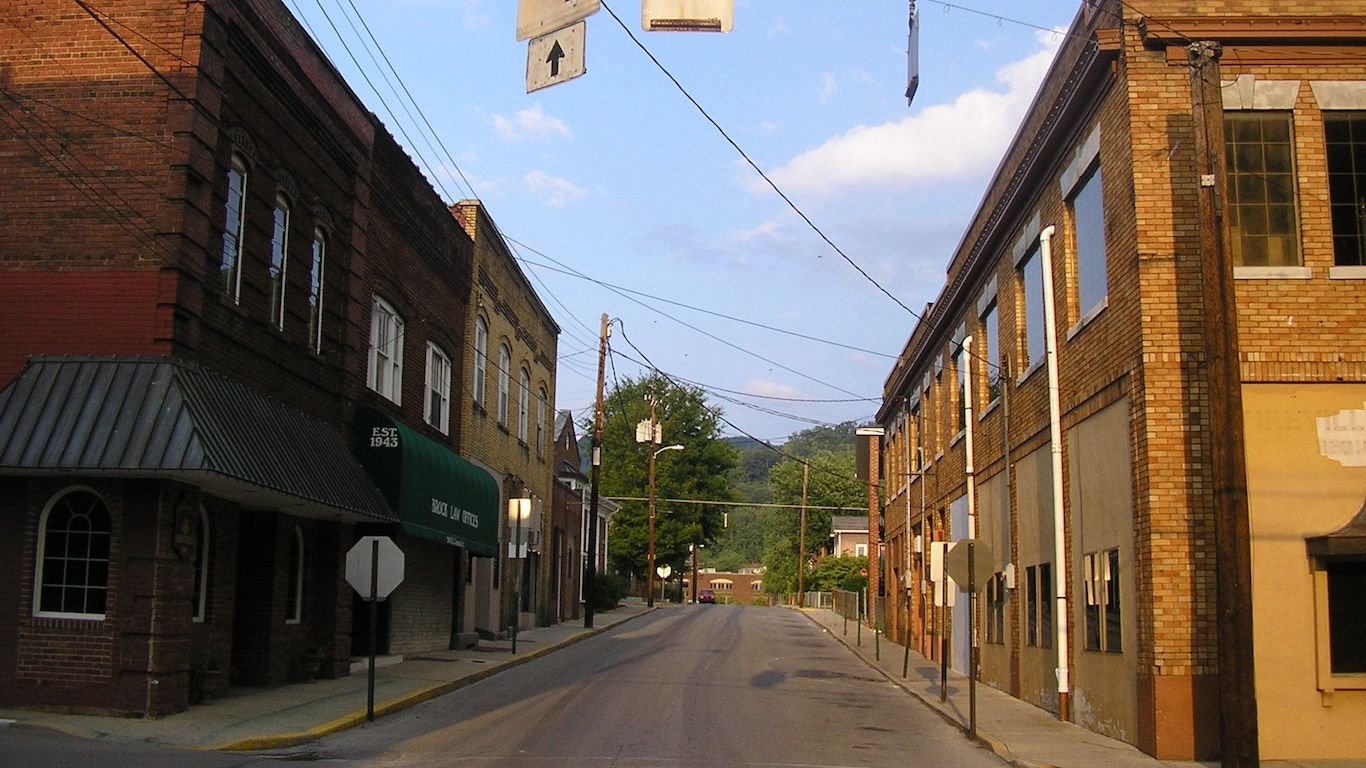
28. West Virginia
> Phone use rate: 35.4% of trips (18th lowest)
> Speeding rate: 38.8% of trips (17th highest)
> 2016 motor vehicle deaths per 100M miles: 1.35 (12th most)
> Seat belt use: 89% of trips (tied — 21st highest)
Source: jessicasarahs / Flickr
27. North Carolina
> Phone use rate: 39.9% of trips (15th highest)
> Speeding rate: 35.2% of trips (25th highest)
> 2016 motor vehicle deaths per 100M miles: 1.23 (22nd most)
> Seat belt use: 90% of trips (tied — 19th highest)
[in-text-ad-2]
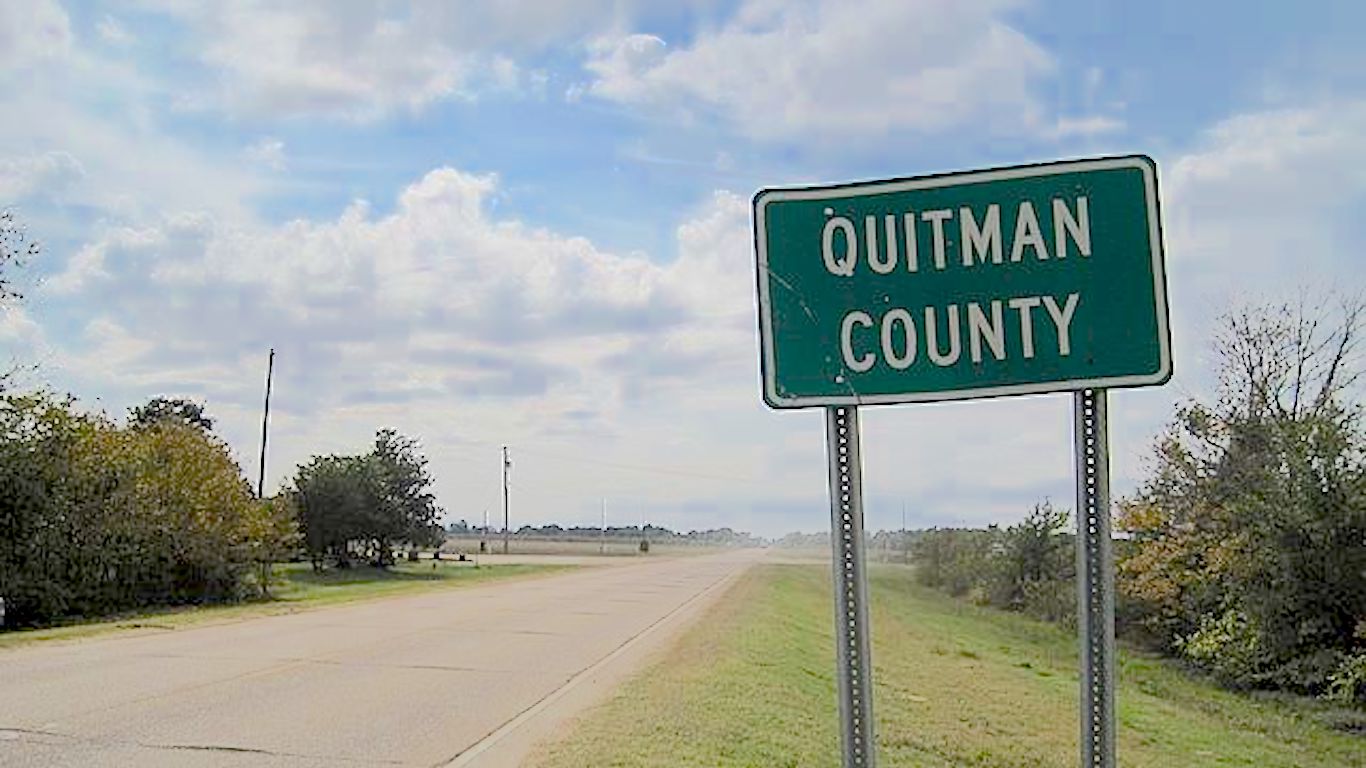
Source: Thomas R Machnitzki / Wikimedia Commons
26. Mississippi
> Phone use rate: 46.1% of trips (the highest)
> Speeding rate: 35.3% of trips (24th highest)
> 2016 motor vehicle deaths per 100M miles: 1.70 (3rd most)
> Seat belt use: 80% of trips (tied — 6th lowest)

Source: Lindsay Attaway / Flickr
25. Texas
> Phone use rate: 40.5% of trips (13th highest)
> Speeding rate: 32.6% of trips (20th lowest)
> 2016 motor vehicle deaths per 100M miles: 1.36 (11th most)
> Seat belt use: 91% of trips (tied — 17th highest)
[in-text-ad]
Source: Thinkstock
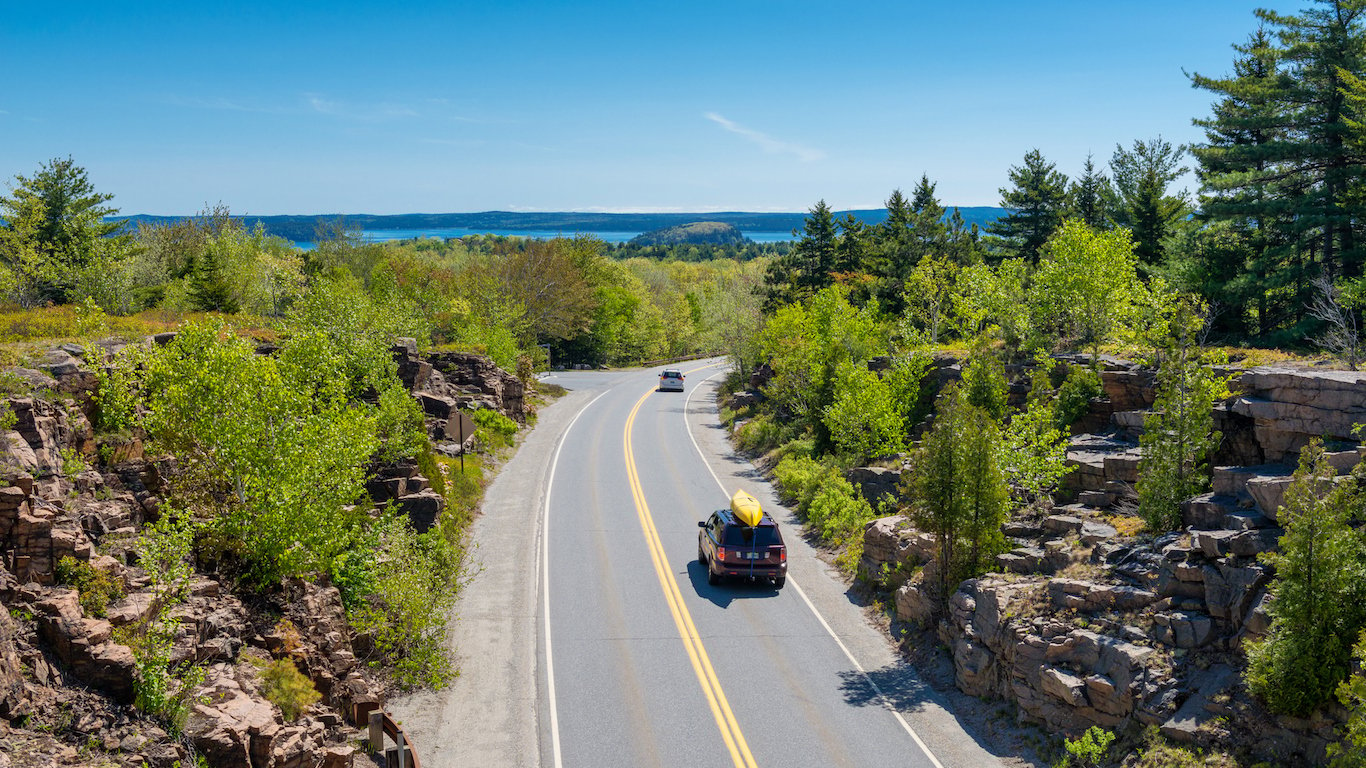
24. Maine
> Phone use rate: 38.2% of trips (21st highest)
> Speeding rate: 43.1% of trips (11th highest)
> 2016 motor vehicle deaths per 100M miles: 1.07 (21st fewest)
> Seat belt use: 86% of trips (tied — 19th lowest)
Source: Thinkstock
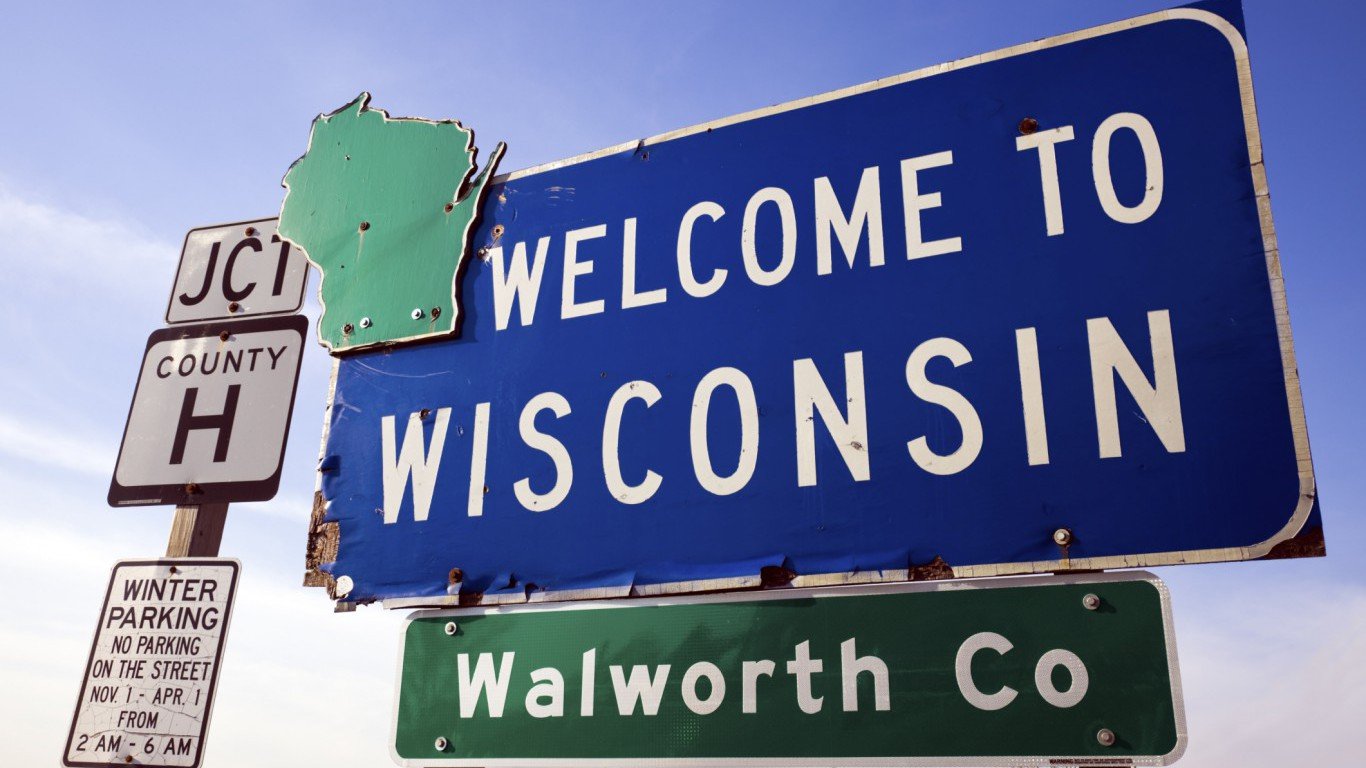
23. Wisconsin
> Phone use rate: 35.4% of trips (19th lowest)
> Speeding rate: 40.1% of trips (15th highest)
> 2016 motor vehicle deaths per 100M miles: 0.91 (12th fewest)
> Seat belt use: 86% of trips (tied — 19th lowest)
Source: faungg's photos / Flickr
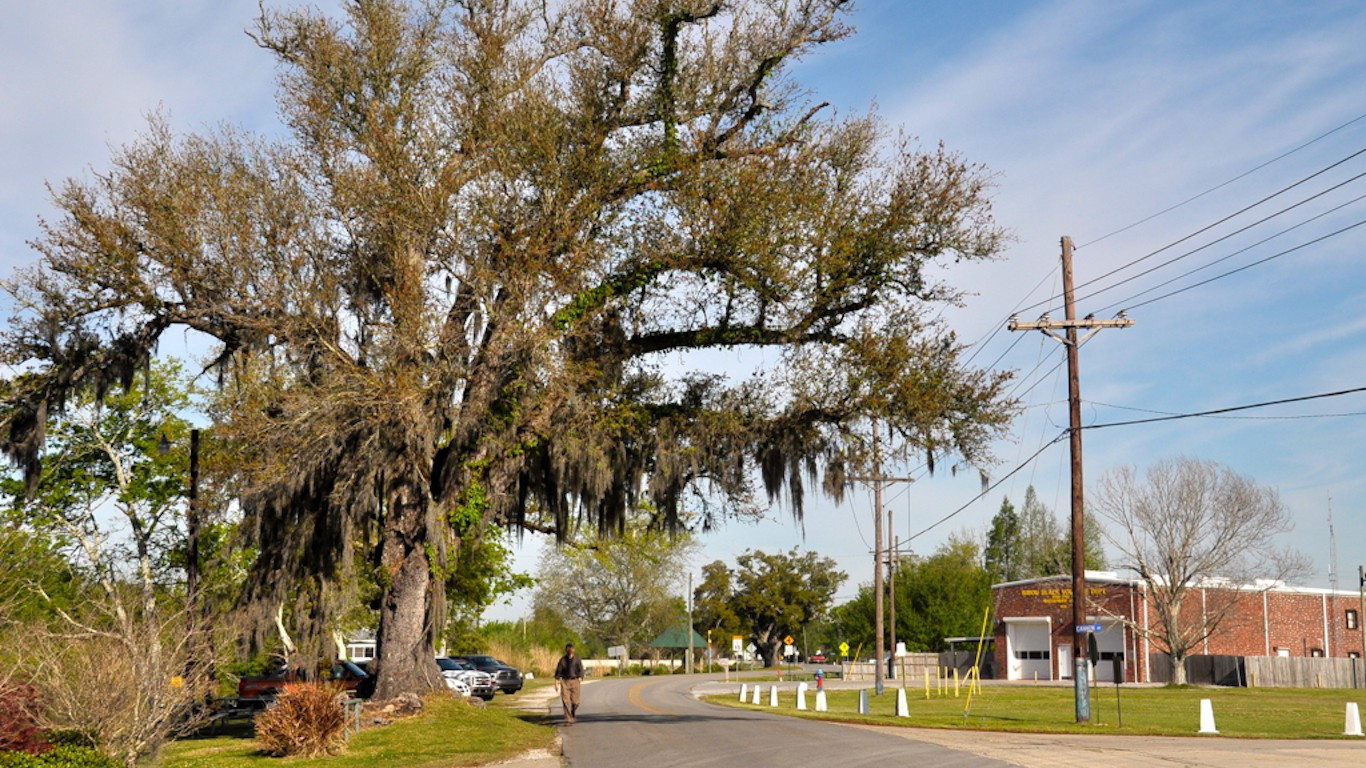
22. Louisiana
> Phone use rate: 43.4% of trips (4th highest)
> Speeding rate: 32.6% of trips (19th lowest)
> 2016 motor vehicle deaths per 100M miles: 1.51 (6th most)
> Seat belt use: 86% of trips (tied — 19th lowest)
[in-text-ad-2]
Source: Thinkstock
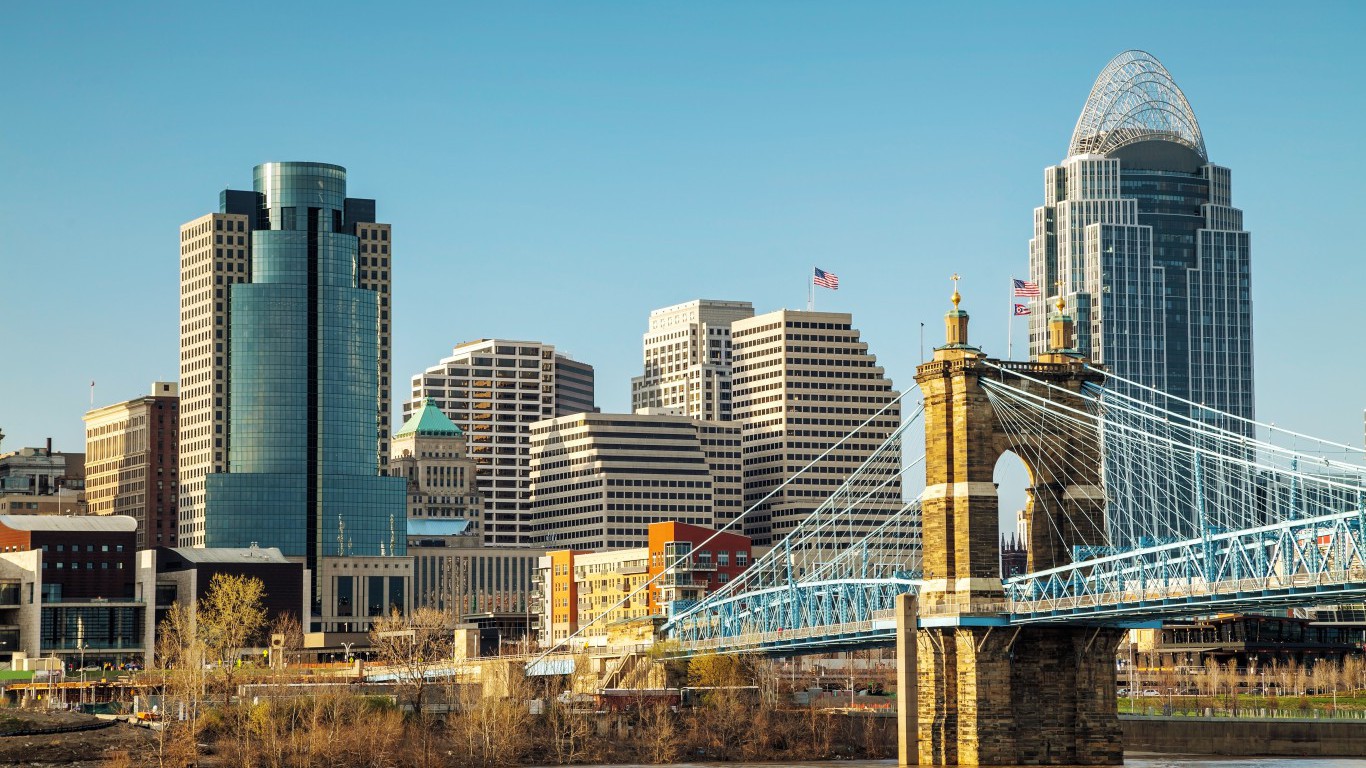
21. Ohio
> Phone use rate: 40.6% of trips (10th highest)
> Speeding rate: 33.9% of trips (25th lowest)
> 2016 motor vehicle deaths per 100M miles: 0.98 (19th fewest)
> Seat belt use: 84% of trips (15th lowest)
Source: Thinkstock
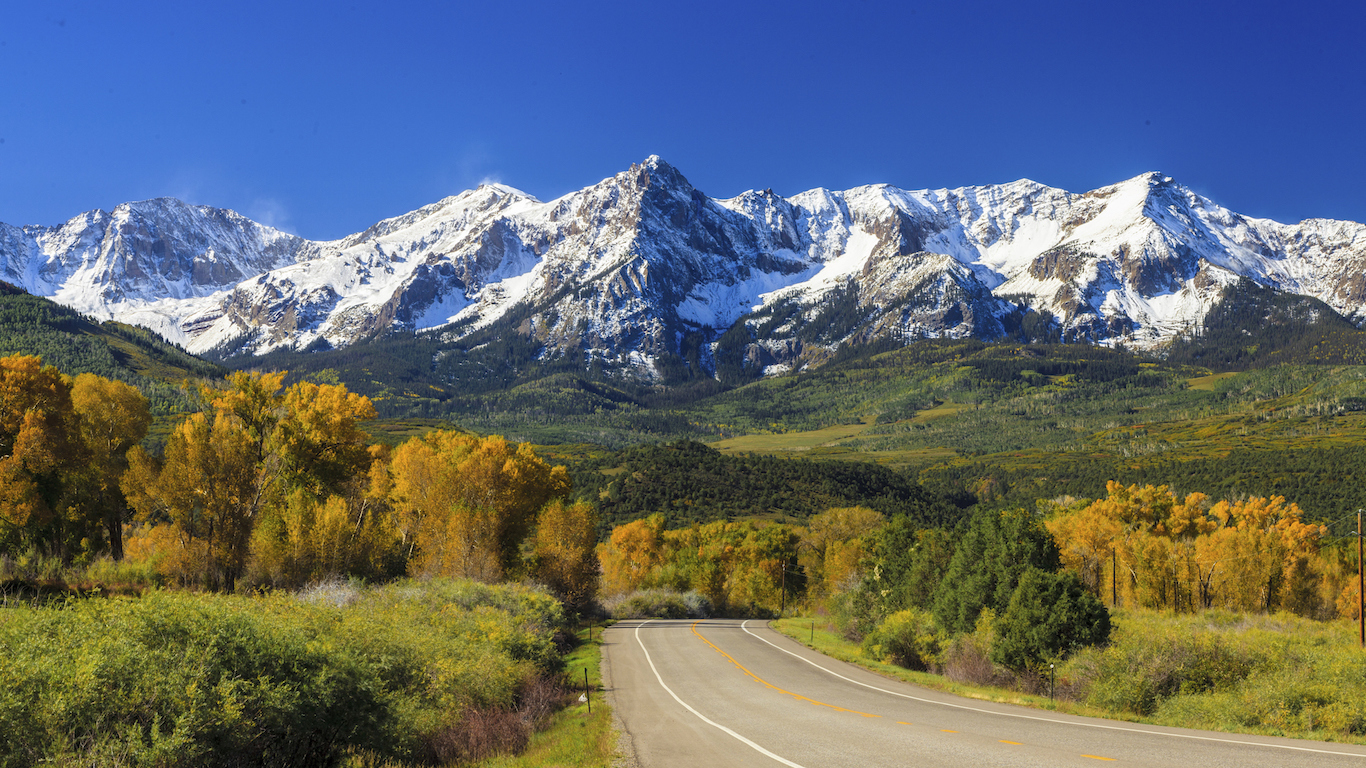
20. Colorado
> Phone use rate: 34.8% of trips (12th lowest)
> Speeding rate: 33.1% of trips (21st lowest)
> 2016 motor vehicle deaths per 100M miles: 1.08 (22nd fewest)
> Seat belt use: 85% of trips (tied — 16th lowest)
[in-text-ad]
Source: Wikimedia Commons
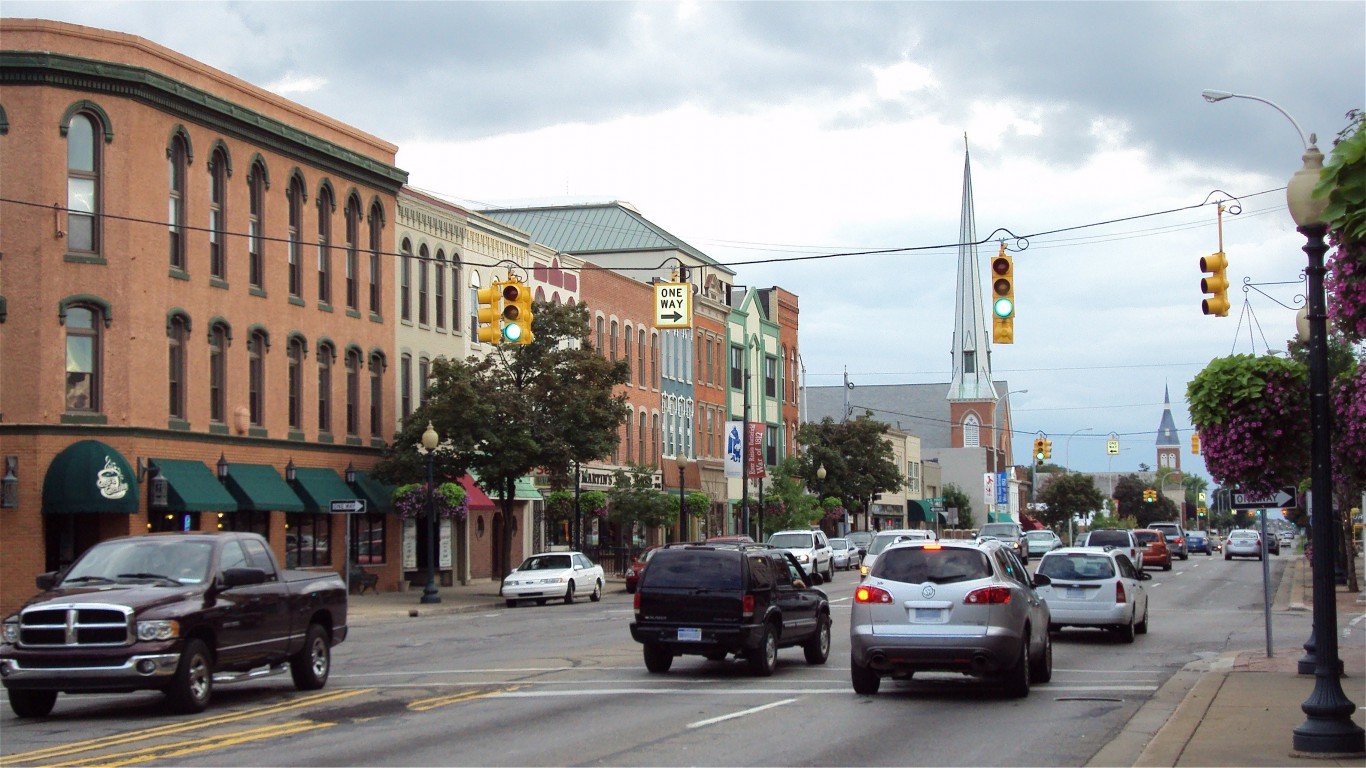
19. Michigan
> Phone use rate: 39.3% of trips (18th highest)
> Speeding rate: 31.2% of trips (17th lowest)
> 2016 motor vehicle deaths per 100M miles: 0.98 (19th fewest)
> Seat belt use: 93% of trips (tied — 7th highest)
Source: w.marsh / Flickr
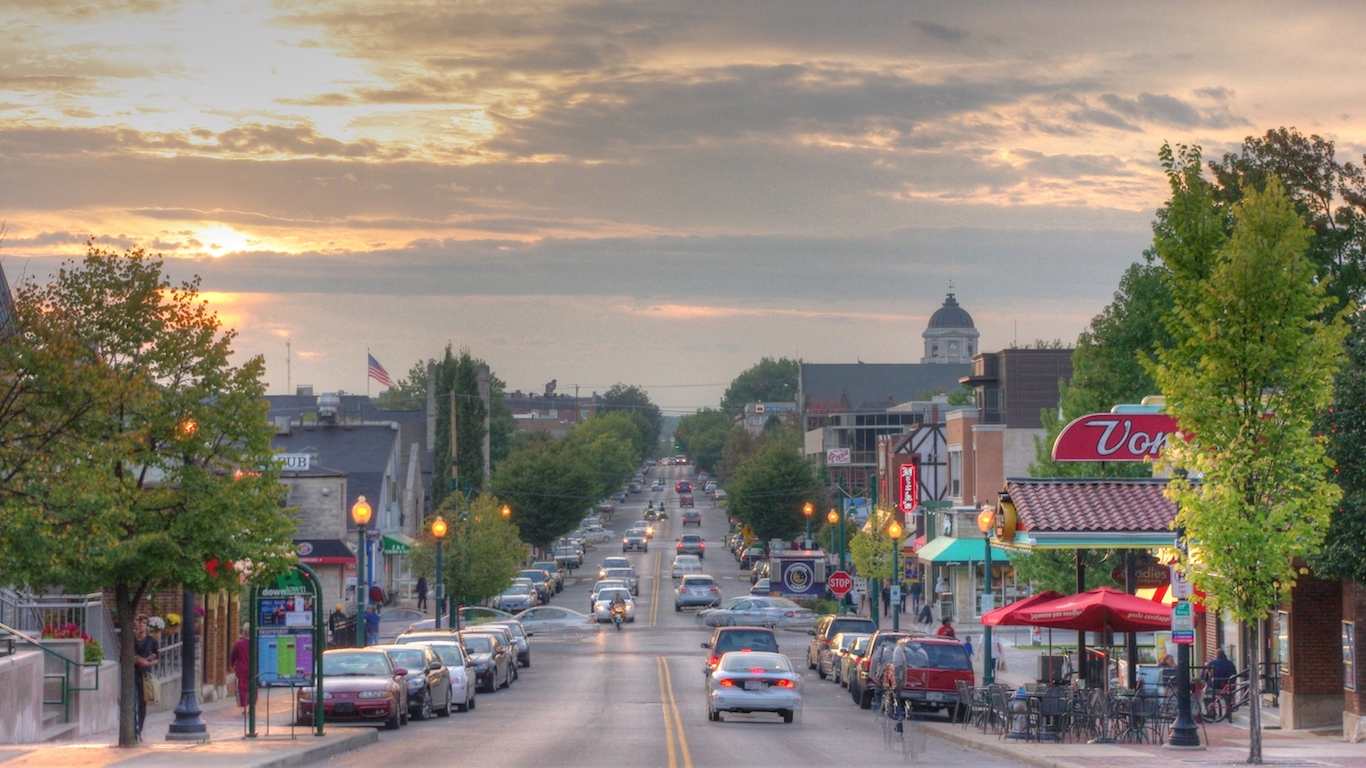
18. Kentucky
> Phone use rate: 40.6% of trips (11th highest)
> Speeding rate: 33.3% of trips (23rd lowest)
> 2016 motor vehicle deaths per 100M miles: 1.56 (4th most)
> Seat belt use: 87% of trips (tied — 24th highest)
Source: Thinkstock
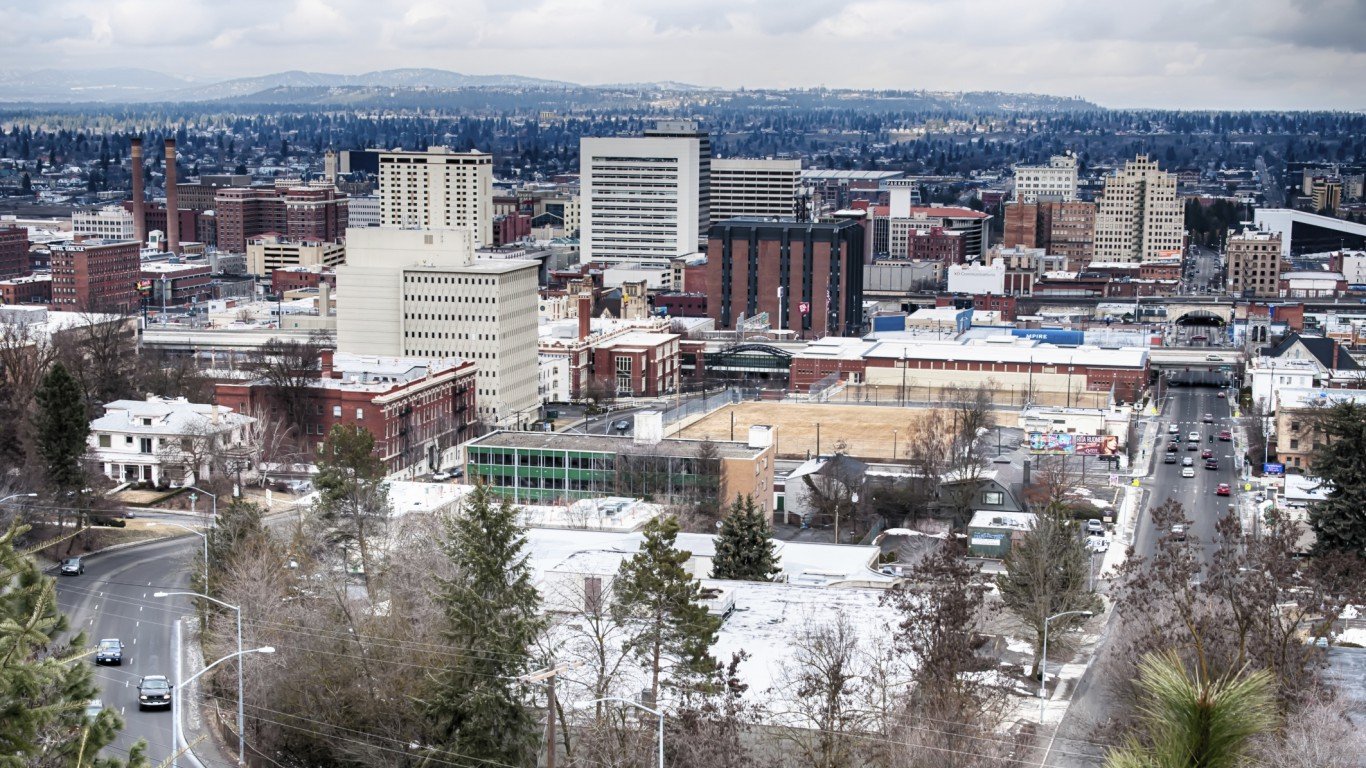
17. Washington
> Phone use rate: 35.1% of trips (16th lowest)
> Speeding rate: 33.4% of trips (24th lowest)
> 2016 motor vehicle deaths per 100M miles: 0.95 (16th fewest)
> Seat belt use: 95% of trips (tied — 4th highest)
[in-text-ad-2]
Source: Thinkstock
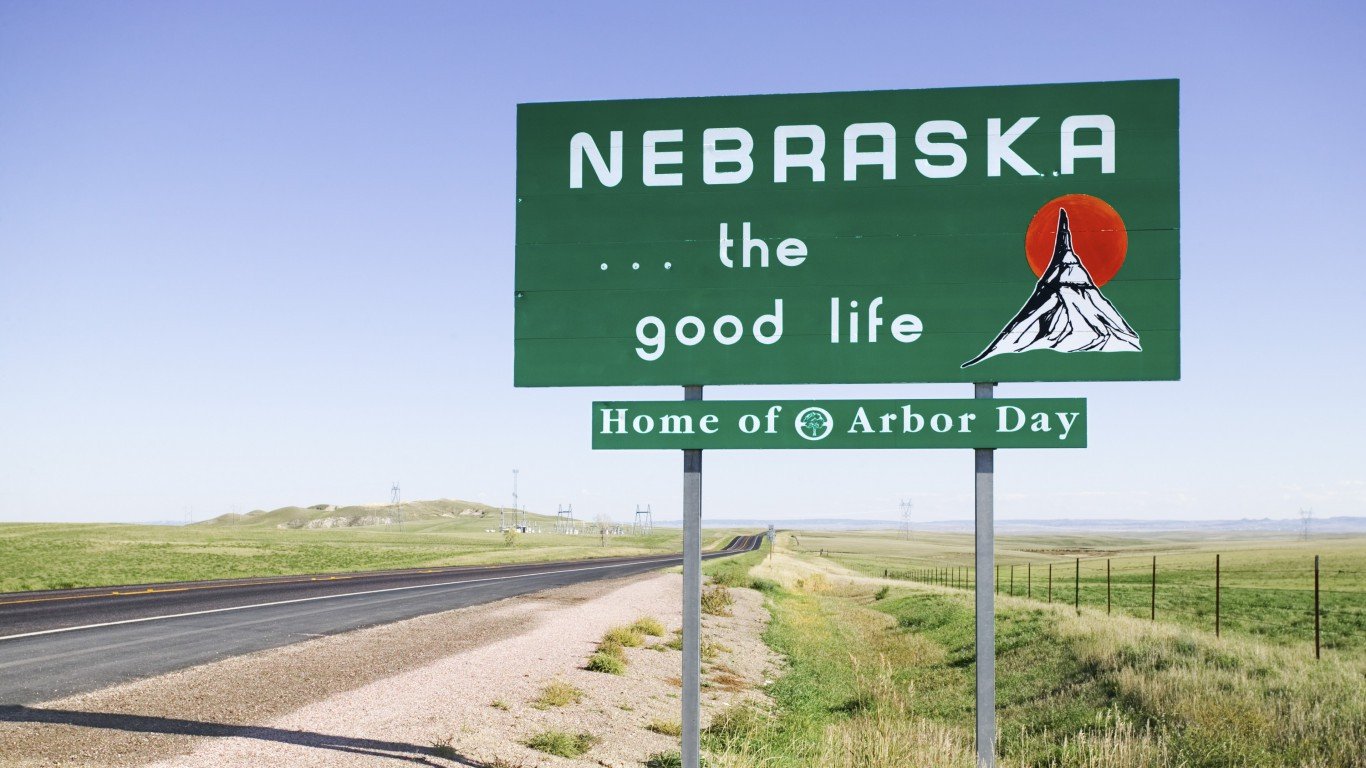
16. Nebraska
> Phone use rate: 37.2% of trips (23rd lowest)
> Speeding rate: 27.5% of trips (11th lowest)
> 2016 motor vehicle deaths per 100M miles: 1.22 (23rd most)
> Seat belt use: 80% of trips (tied — 6th lowest)
Source: Thinkstock
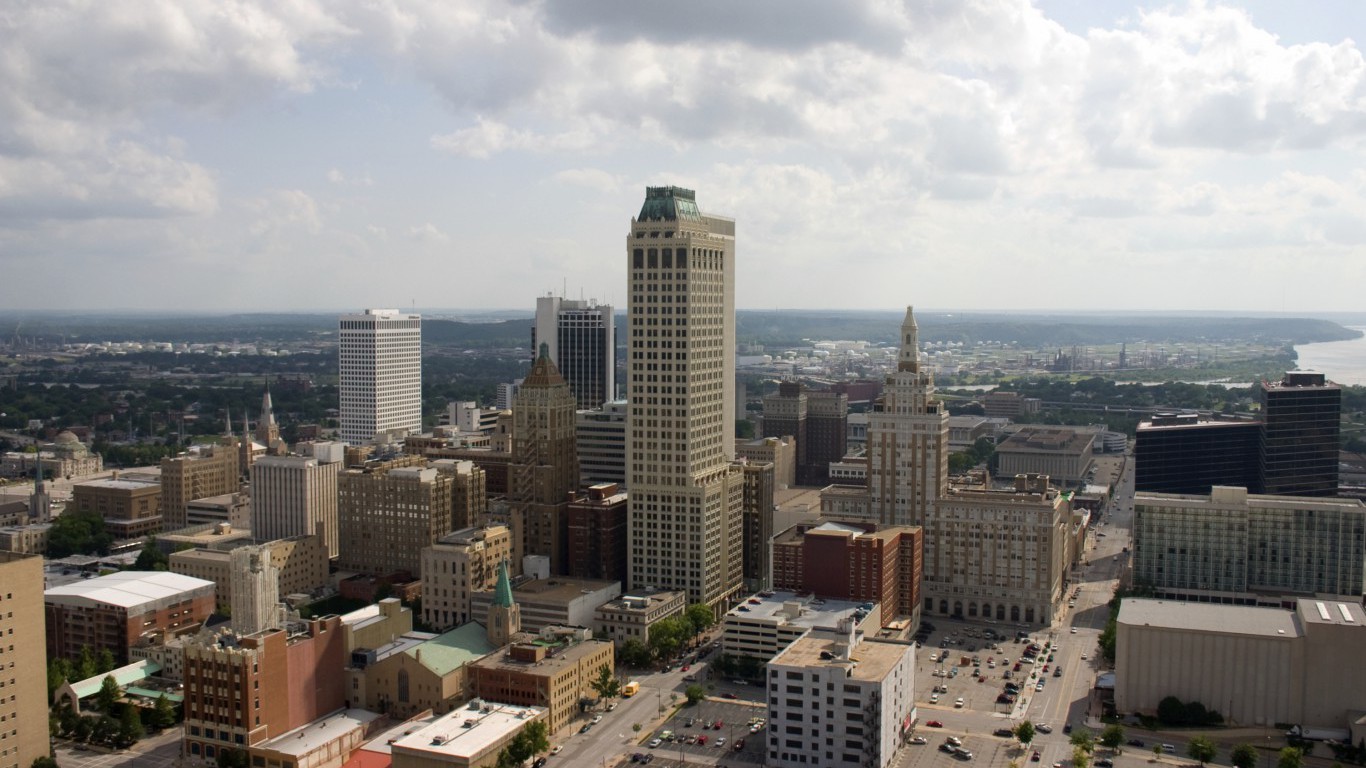
15. Oklahoma
> Phone use rate: 39.7% of trips (16th highest)
> Speeding rate: 26.5% of trips (8th lowest)
> 2016 motor vehicle deaths per 100M miles: 1.35 (12th most)
> Seat belt use: 85% of trips (tied — 16th lowest)
[in-text-ad]
Source: Wikimedia Commons
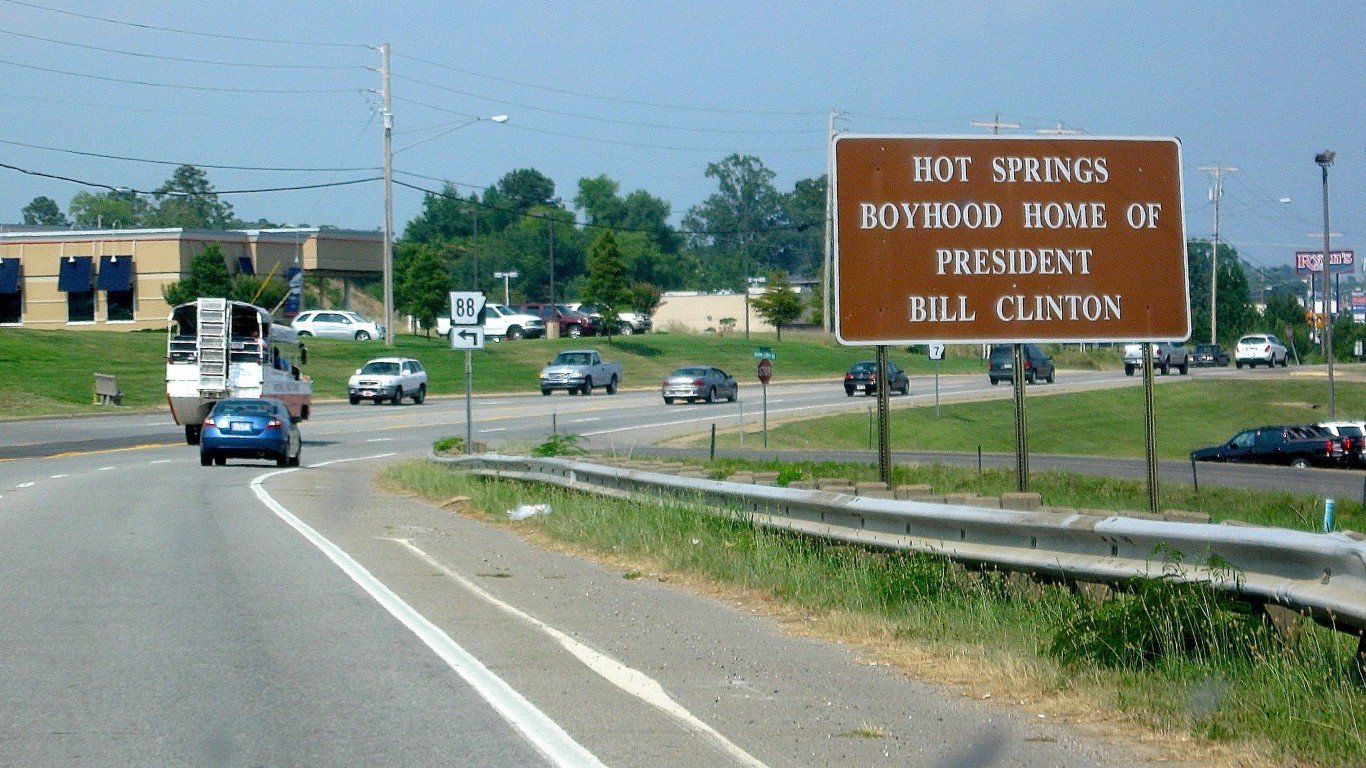
14. Arkansas
> Phone use rate: 38.9% of trips (19th highest)
> Speeding rate: 30.5% of trips (15th lowest)
> 2016 motor vehicle deaths per 100M miles: 1.52 (5th most)
> Seat belt use: 78% of trips (5th lowest)
Source: Zack Frank / Shutterstock.com
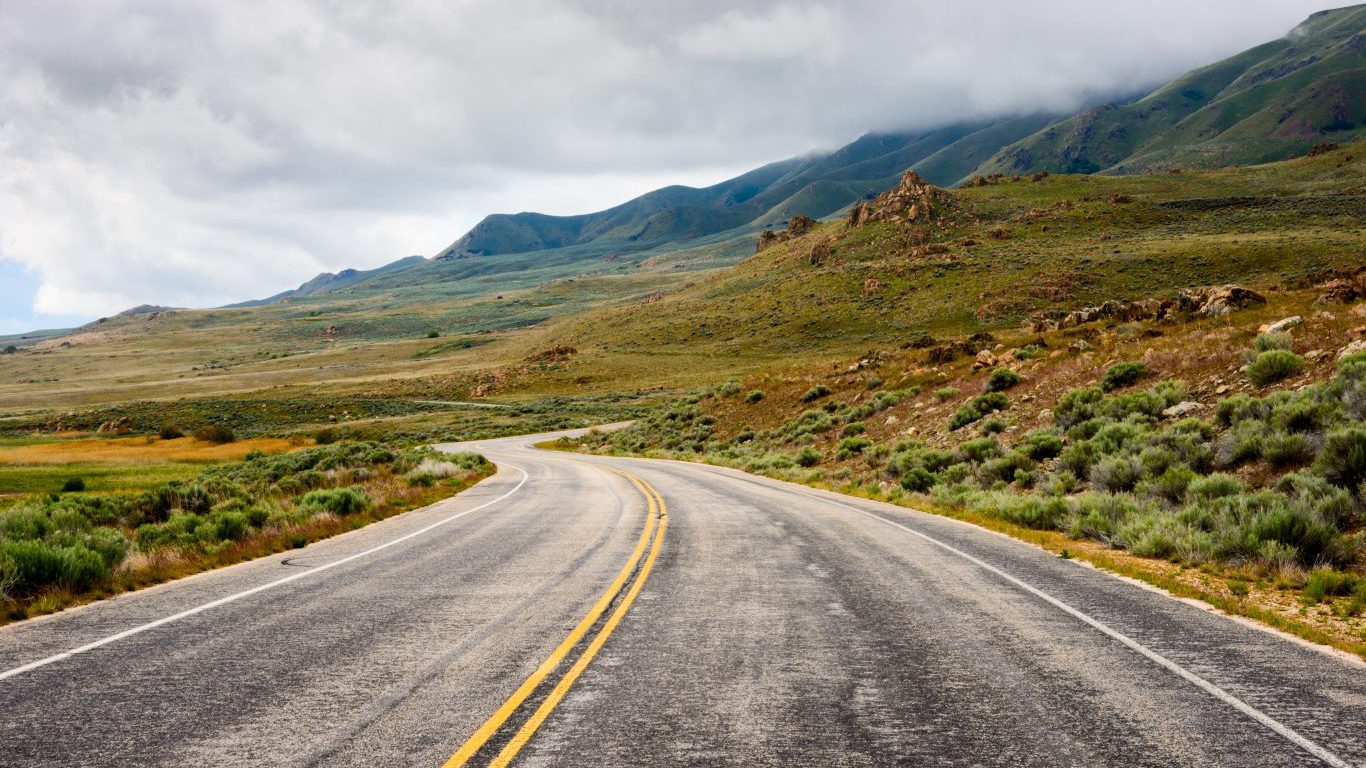
13. Utah
> Phone use rate: 33.3% of trips (8th lowest)
> Speeding rate: 29.4% of trips (13th lowest)
> 2016 motor vehicle deaths per 100M miles: 0.93 (13th fewest)
> Seat belt use: 87% of trips (tied — 24th highest)
Source: https://www.flickr.com/photos/teamperks/
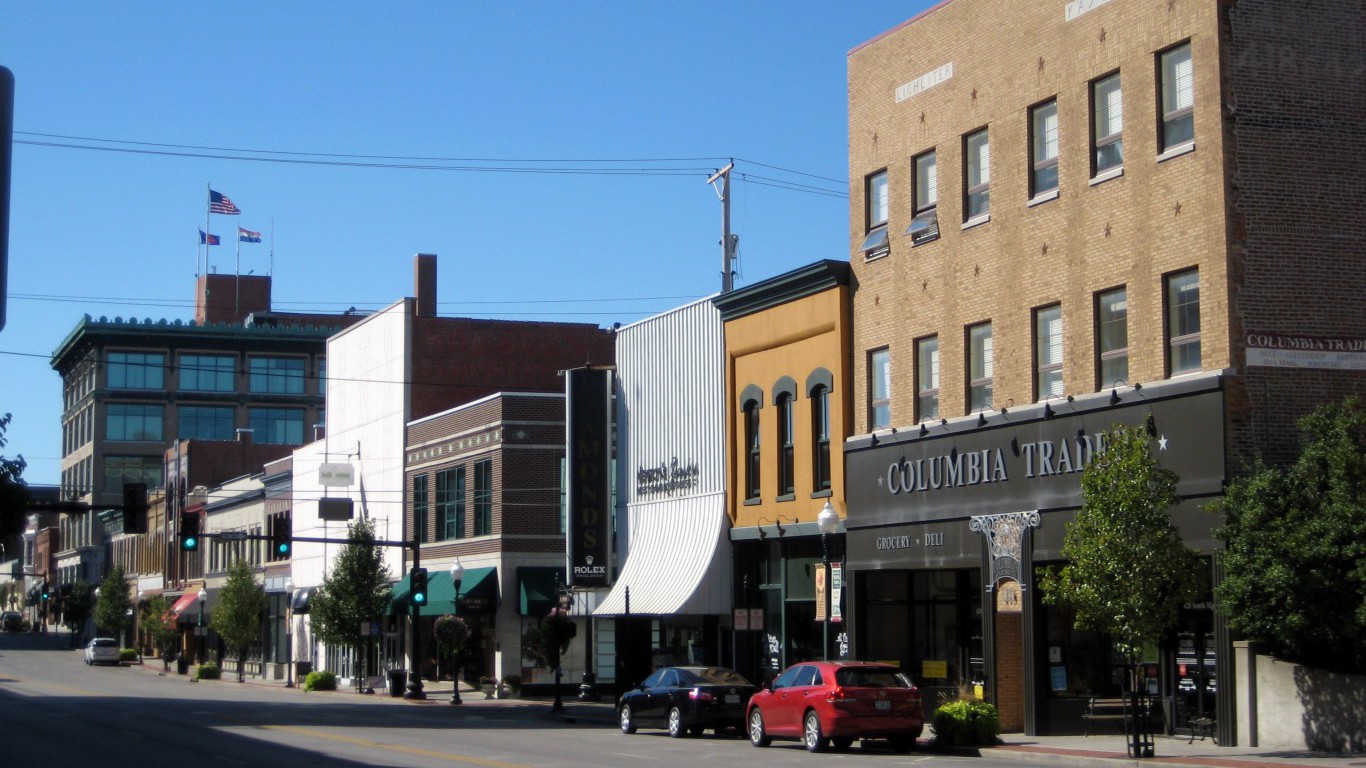
12. Missouri
> Phone use rate: 40.5% of trips (12th highest)
> Speeding rate: 30.2% of trips (14th lowest)
> 2016 motor vehicle deaths per 100M miles: 1.21 (24th most)
> Seat belt use: 80% of trips (tied — 6th lowest)
[in-text-ad-2]
Source: Thinkstock
11. Oregon
> Phone use rate: 29.3% of trips (3rd lowest)
> Speeding rate: 26.6% of trips (10th lowest)
> 2016 motor vehicle deaths per 100M miles: 1.24 (21st most)
> Seat belt use: 96% of trips (3rd highest)
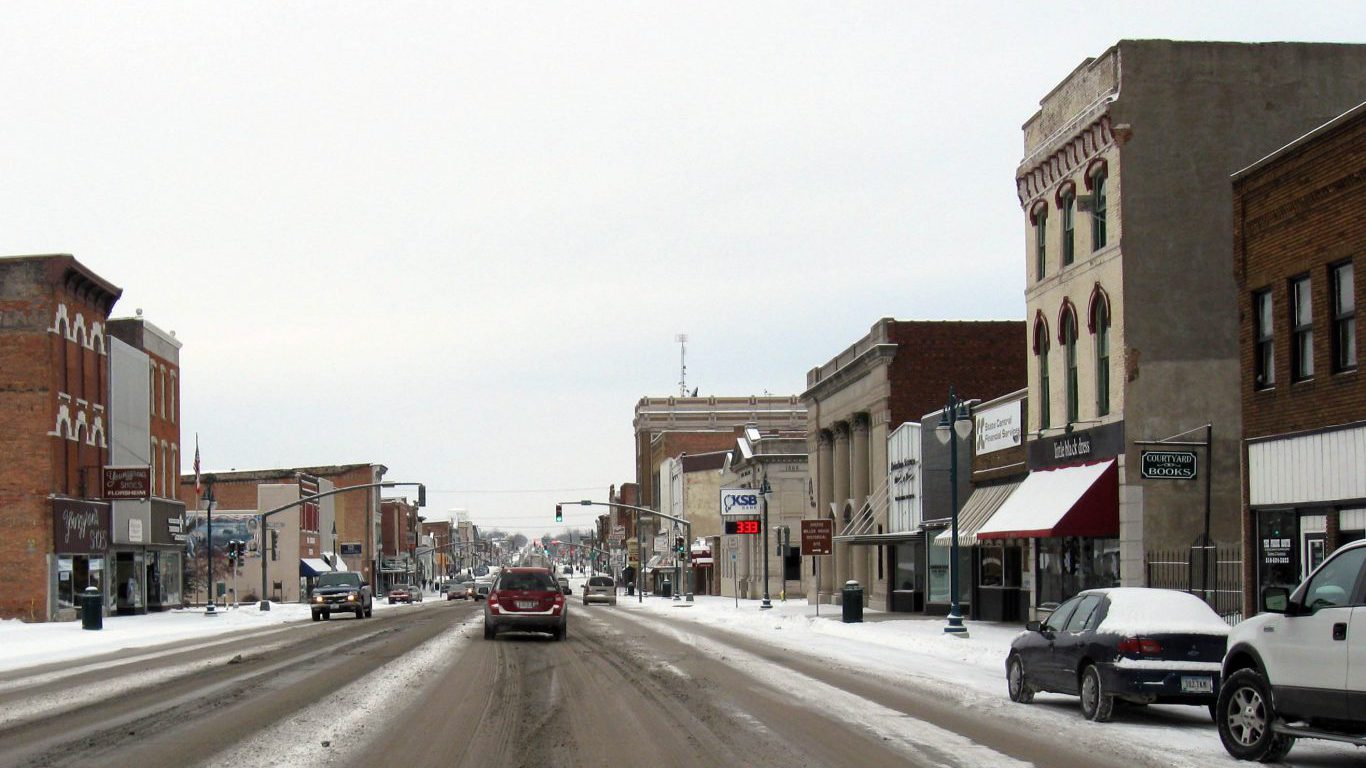
Source: Billwhittaker / Wikimedia Commons
10. Iowa
> Phone use rate: 35.5% of trips (20th lowest)
> Speeding rate: 26.6% of trips (9th lowest)
> 2016 motor vehicle deaths per 100M miles: 0.96 (17th fewest)
> Seat belt use: 93% of trips (tied — 7th highest)
[in-text-ad]
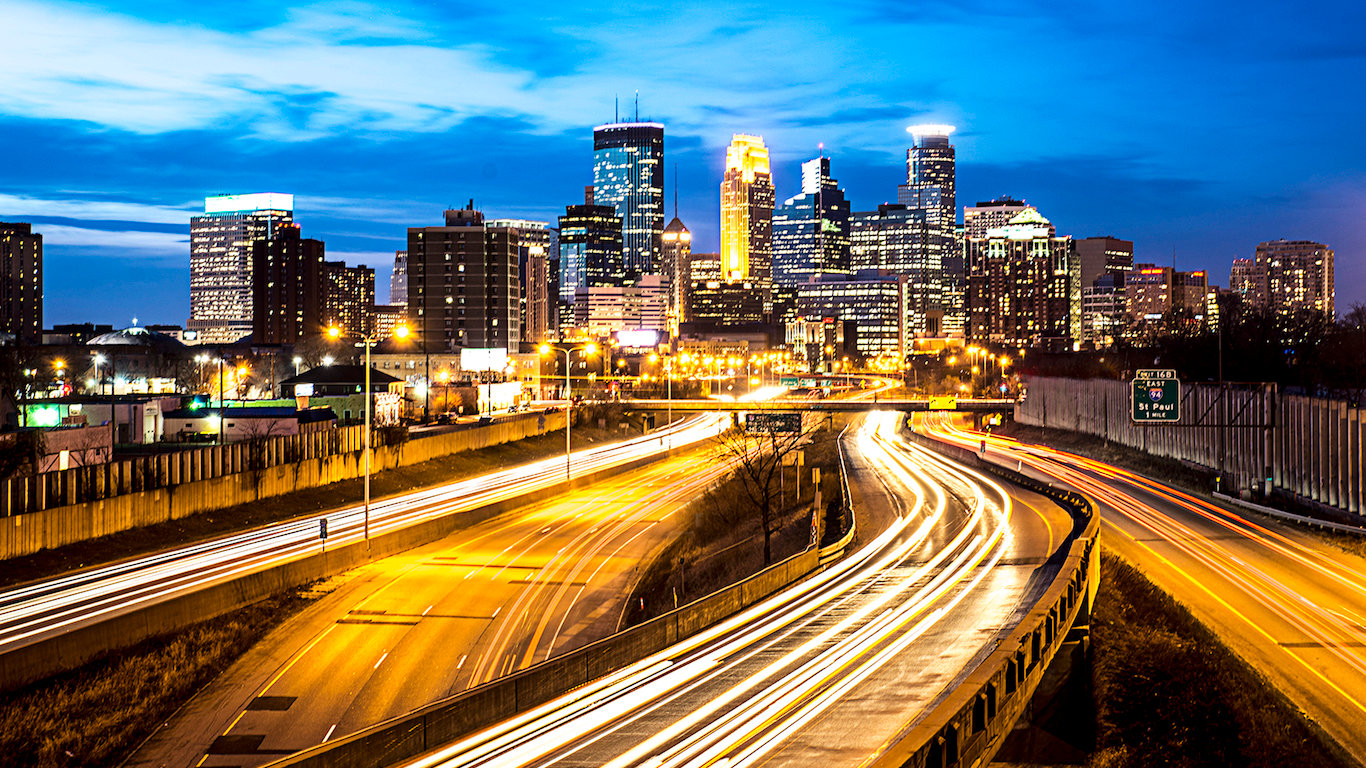
Source: Thinkstock
9. Minnesota
> Phone use rate: 33.5% of trips (9th lowest)
> Speeding rate: 28.1% of trips (12th lowest)
> 2016 motor vehicle deaths per 100M miles: 0.72 (3rd fewest)
> Seat belt use: 94% of trips (tied — 6th highest)
 24/7 Wall St.
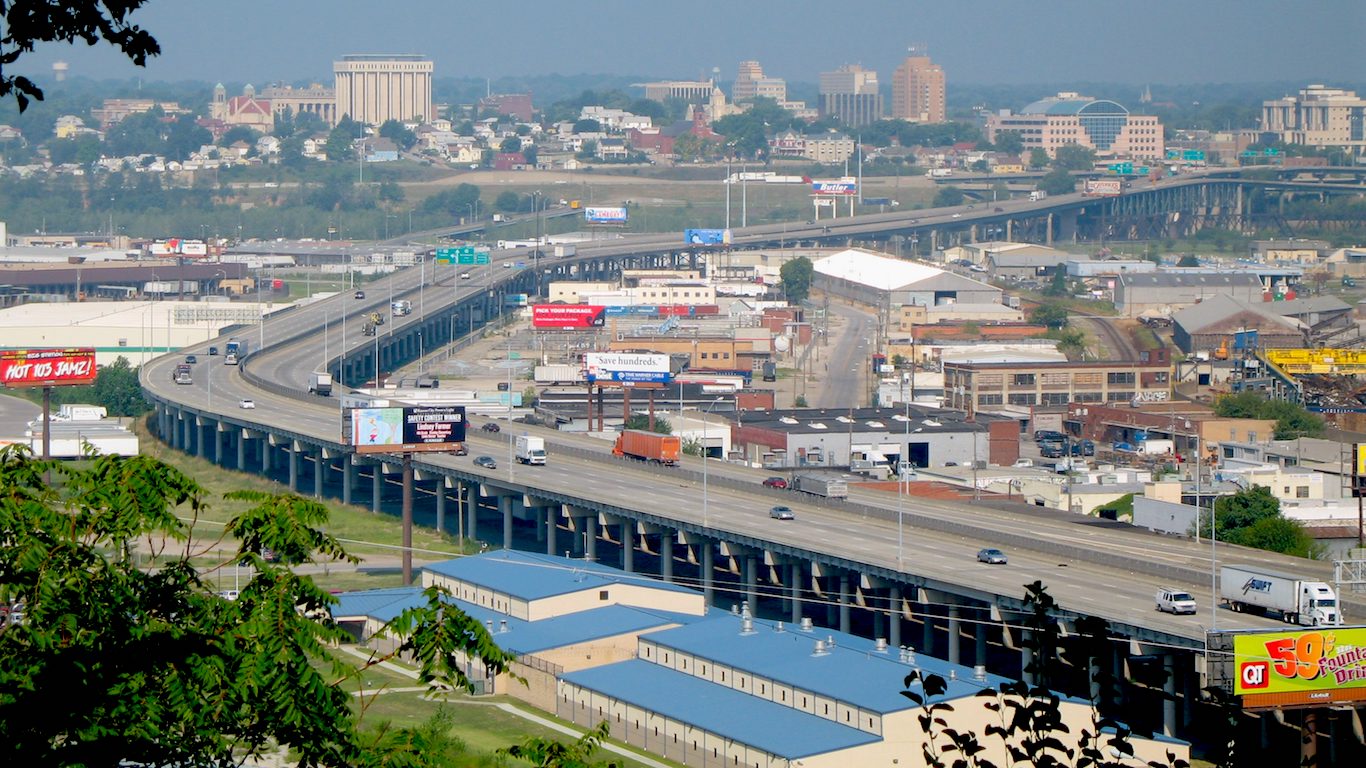
Source: Americasroof / Wikimedia Commons
8. Kansas
> Phone use rate: 35.7% of trips (21st lowest)
> Speeding rate: 22.7% of trips (6th lowest)
> 2016 motor vehicle deaths per 100M miles: 1.13 (24th fewest)
> Seat belt use: 82% of trips (tied — 13th lowest)
Source: Thinkstock
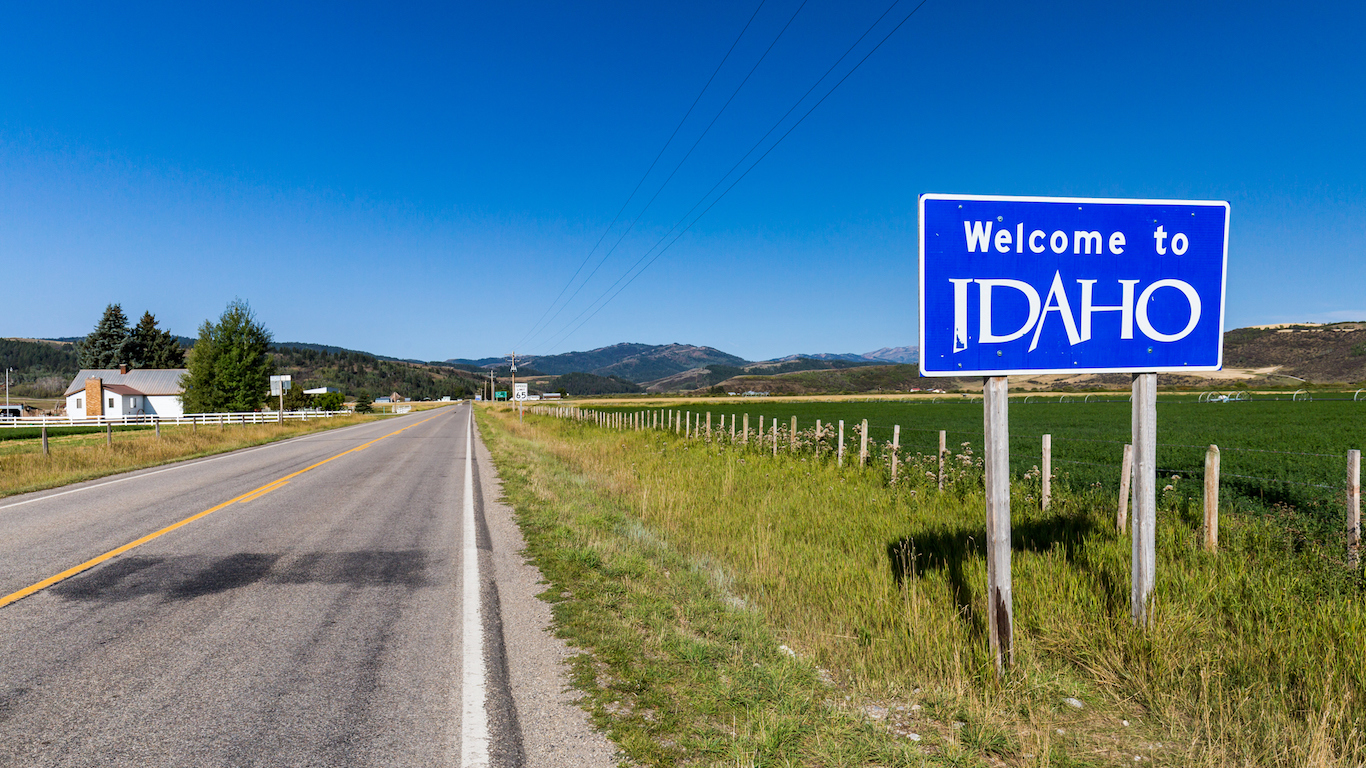
7. Idaho
> Phone use rate: 37.5% of trips (24th lowest)
> Speeding rate: 20.4% of trips (4th lowest)
> 2016 motor vehicle deaths per 100M miles: 1.30 (15th most)
> Seat belt use: 81% of trips (tied — 11th lowest)
[in-text-ad-2]
Source: FiledIMAGE / Shutterstock.com
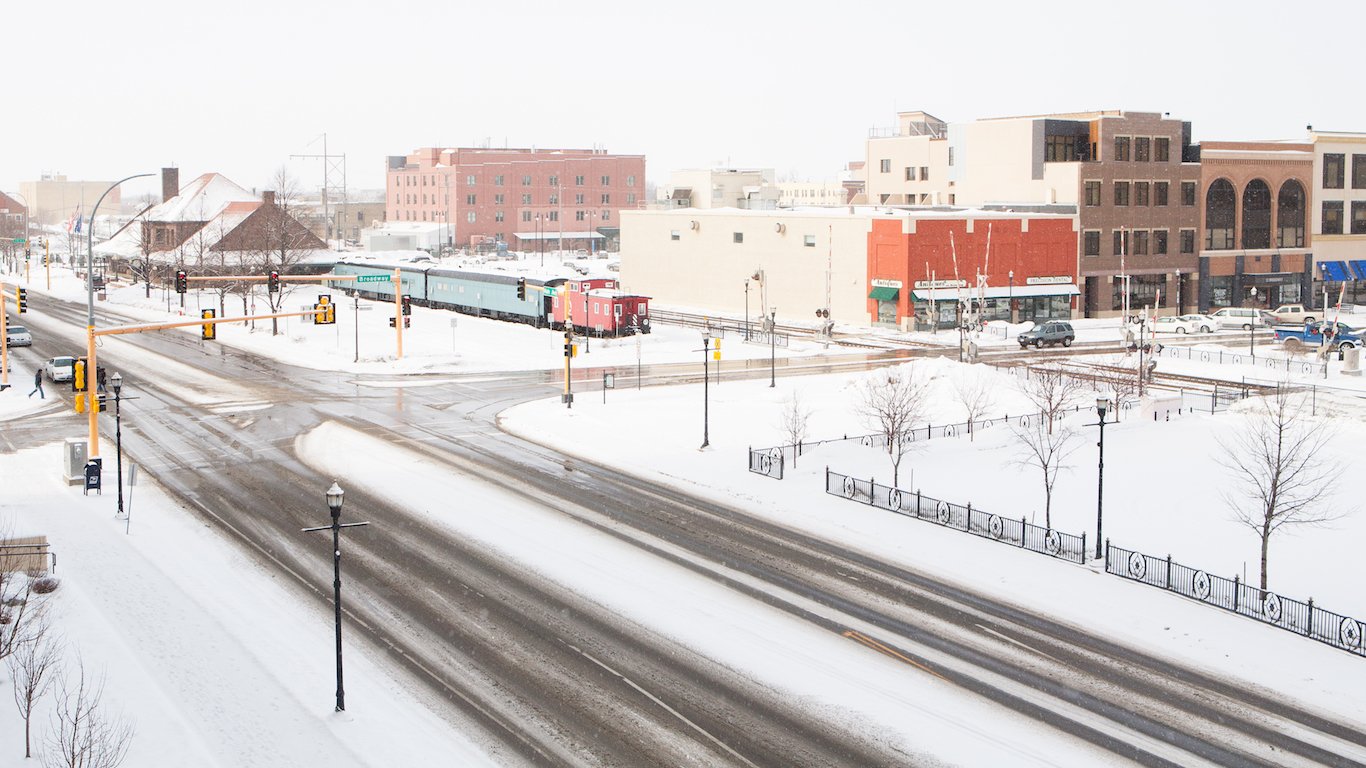
6. North Dakota
> Phone use rate: 30.4% of trips (4th lowest)
> Speeding rate: 20.3% of trips (3rd lowest)
> 2016 motor vehicle deaths per 100M miles: 1.31 (14th most)
> Seat belt use: 80% of trips (tied — 6th lowest)
Source: DonLand / Shutterstock.com
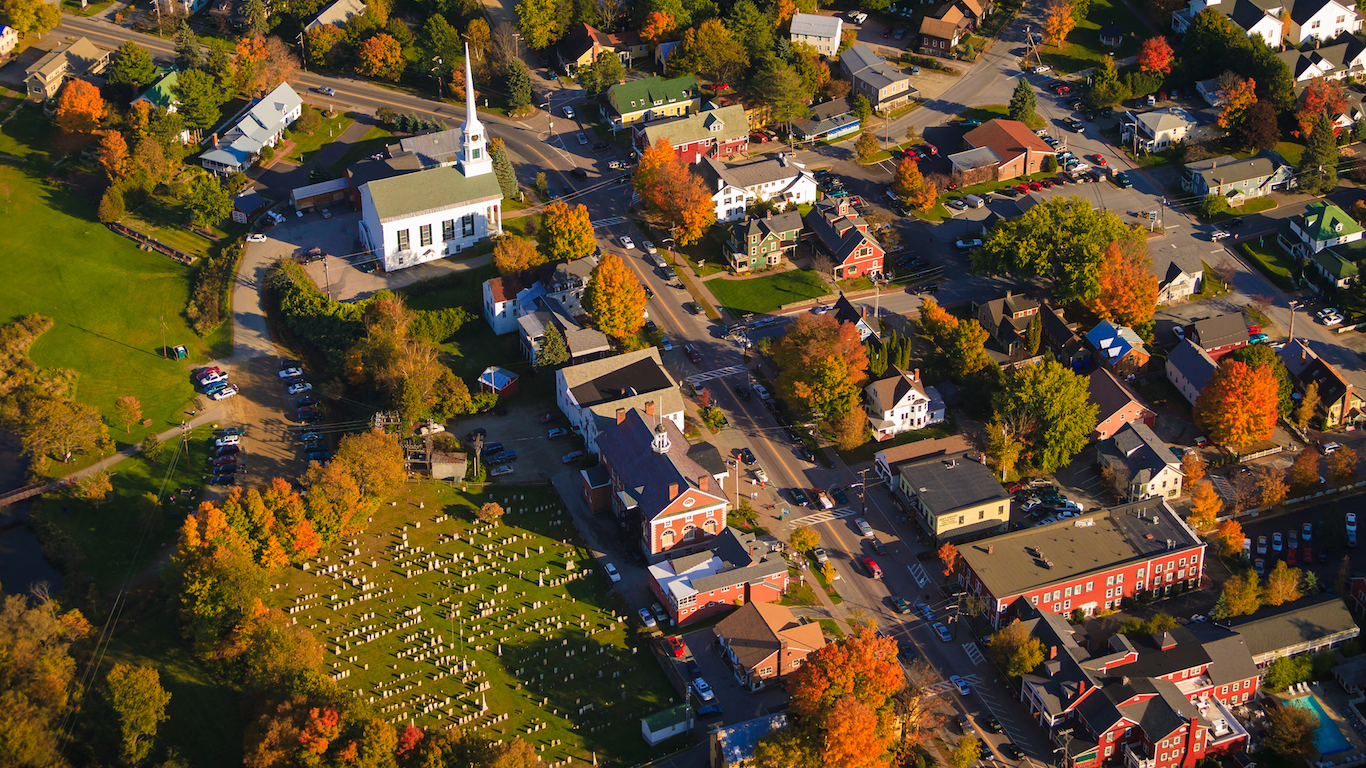
5. Vermont
> Phone use rate: 27.2% of trips (the lowest)
> Speeding rate: 31.0% of trips (16th lowest)
> 2016 motor vehicle deaths per 100M miles: 0.78 (5th fewest)
> Seat belt use: 86% of trips (tied — 19th lowest)
[in-text-ad]
Source: Wikimedia Commons
4. South Dakota
> Phone use rate: 34.9% of trips (13th lowest)
> Speeding rate: 22.6% of trips (5th lowest)
> 2016 motor vehicle deaths per 100M miles: 1.43 (8th most)
> Seat belt use: 74% of trips (tied — 2nd lowest)
Source: Thinkstock
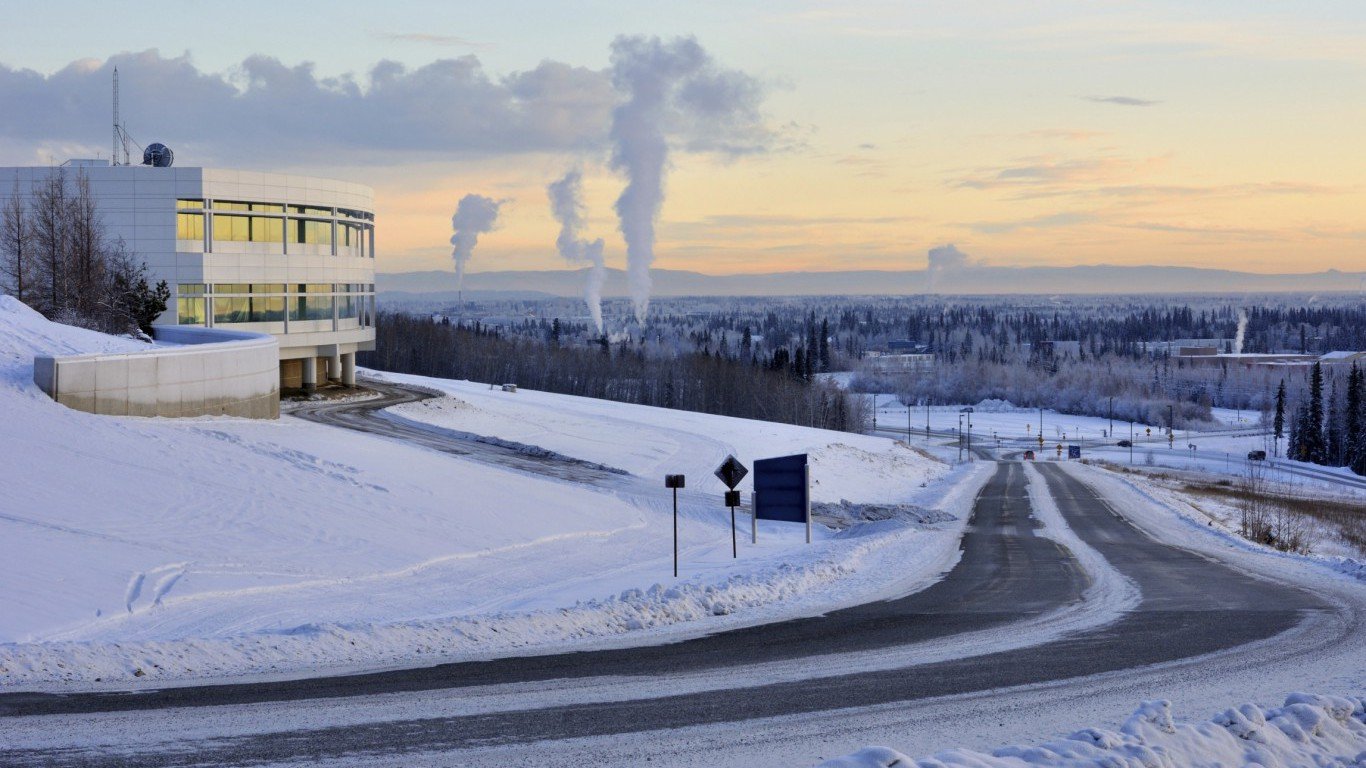
3. Alaska
> Phone use rate: 28.9% of trips (2nd lowest)
> Speeding rate: 19.7% of trips (2nd lowest)
> 2016 motor vehicle deaths per 100M miles: 1.29 (16th most)
> Seat belt use: 89% of trips (tied — 21st highest)
Source: Thinkstock
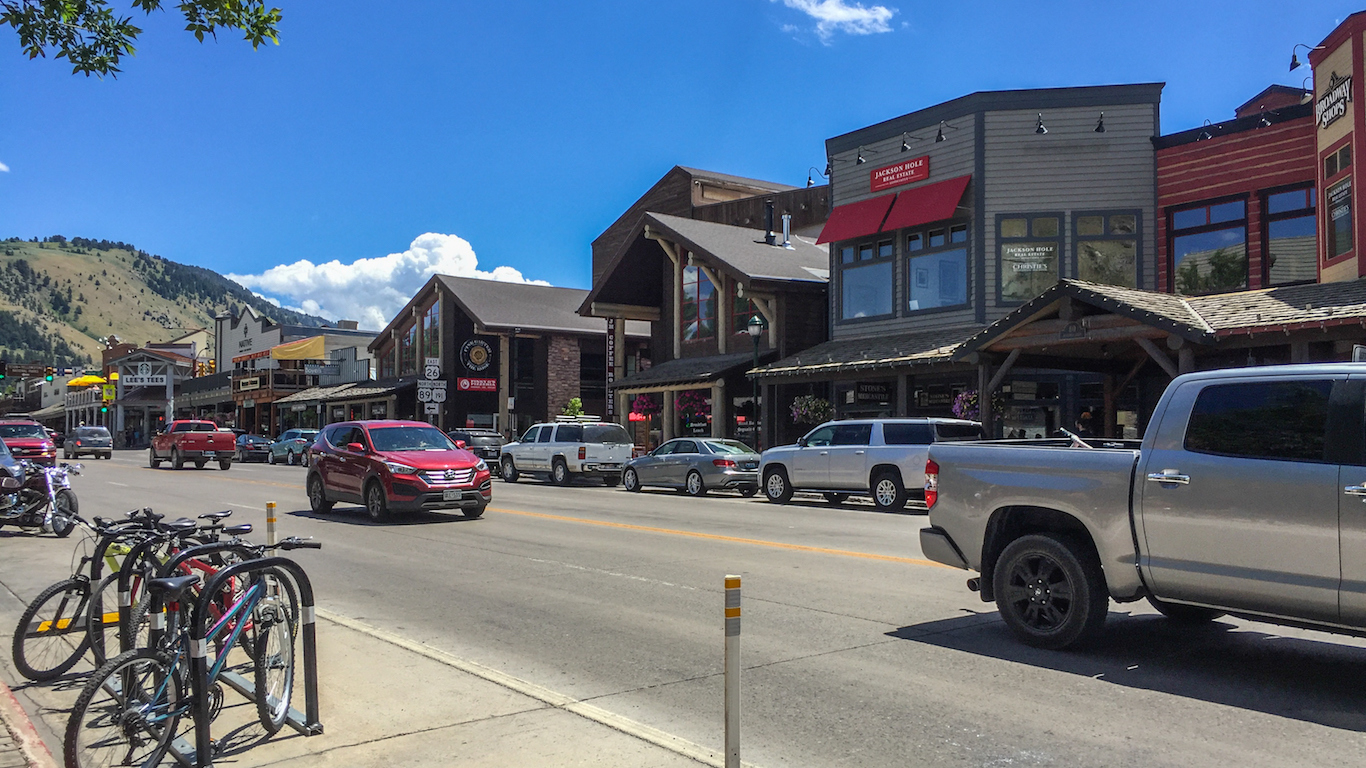
2. Wyoming
> Phone use rate: 34.0% of trips (10th lowest)
> Speeding rate: 24.0% of trips (7th lowest)
> 2016 motor vehicle deaths per 100M miles: 1.51 (6th most)
> Seat belt use: 80% of trips (tied — 6th lowest)
[in-text-ad-2]
Source: Wikimedia Commons / Mike Cline
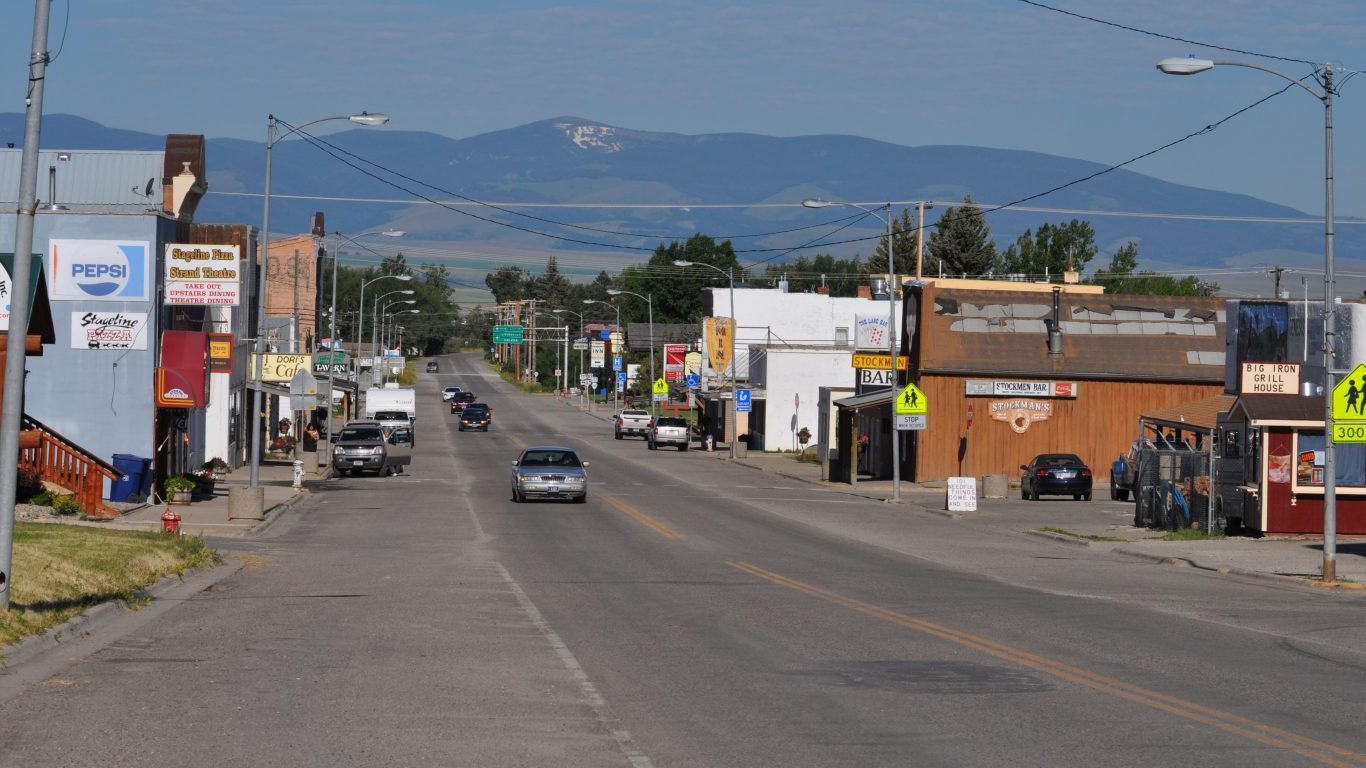
1. Montana
> Phone use rate: 35.0% of trips (14th lowest)
> Speeding rate: 16.8% of trips (the lowest)
> 2016 motor vehicle deaths per 100M miles: 1.81 (2nd most)
> Seat belt use: 77% of trips (tied — 4th lowest)
In fact, eight of the 10 states graded as having the least safe driving habits reported lower traffic fatality rates than the national rate of 1.13 fatalities per 100M miles driven in 2016. This includes Rhode Island, the state where drivers exhibit the worst habits, which had the second lowest fatality rate at 0.57 per 100 million miles. Massachusetts, which has the lowest traffic fatality rate, one of the worst graded state in EverDrive’s report.
At the other end of the list, eight of the 10 states with the best safety driving habits report vehicle fatality rates at or above the national rate. Montana, the best graded state, had the second highest fatality rate at 1.81 deaths per 100 million miles driven in 2016.
In an interview with 24/7 Wall St., Ryan Ruffing, director of communications for EverQuote, explained that while the habits measured by EverDrive are indeed important to safety, the issue is more complicated. In many of the states where residents are less likely to exceed the speed limit, the limits tend to be higher. So while drivers in states like Montana and Wyoming, where speed limits reach 80 mph, may not be speeding as often as drivers in poorly graded New England states, where speed limits on highways peak at 65 mph, they may still be driving faster.
The states that have safer drivers also tend to be much more rural. Driving across long distances on less well-tended roads is much more likely to lead to a fatal accident than urban traffic, where drivers are much less likely to reach life-threatening speeds. While erratic or inattentive driving might result in a fender-bender in suburban or city driving in Rhode Island or Connecticut, It could lead to loss of life while driving in remote parts of Alaska or Idaho, for example.
Ruffing further explained that unsafe cellphone use is lower in states in the West and Northwest likely because wireless coverage can be poor there. This prevents drivers from feeling the need to check their phones and risk their lives.
Phone use, driving at unsafe speeds, and erratic driving — those elements measured by EverDrive — have all been shown to affect the level of risk one takes while driving. But so have factors like drunk driving and seat belt use. On those two measures, states with good grades from EverDrive for safety are less consistent. In fact, alcohol is a factor in a high share of traffic fatalities in many of the best graded states on our list. For example, alcohol accounted for 45% of all traffic deaths in North Dakota in 2016, compared to the 28% of traffic fatalities related to drunk driving nationwide. North Dakota receives a better grade from EverDrive than all but a few states.
Methodology:
The states with the safest drivers are ranked based on their score in the “EverDrive Safe Driving Report 2016-2017.” EverQuote, an online car insurance shopping service, produces EverDrive, an app that allows drivers to monitor their driving habits, including phone use, speeding, risky braking, acceleration, and turning by measuring phone movement and use. The report covers driving habits of roughly 140,000 app users in 50 states, covering 2.7 million trips and 230 million miles of driving. Using data from app users, EverQuote grades the drivers of each state based on those measures of safety.
Data on alcohol-related traffic fatalities came from the NHTSA, and are for 2016. Estimated seat belt use, as well as traffic fatality data per 100 million miles driven came from the Insurance Institute for Highway Safety, a nonprofit organization funded by auto insurers. Some states on EverDrive’s ranking were tied, and considerations like seat belt use, roadside fatalities, and other measures related to highway safety were used to break ties.
Sponsored: Attention Savvy Investors: Speak to 3 Financial Experts – FREE
Ever wanted an extra set of eyes on an investment you’re considering? Now you can speak with up to 3 financial experts in your area for FREE. By simply
clicking here you can begin to match with financial professionals who can help guide you through the financial decisions you’re making. And the best part? The first conversation with them is free.
Click here to match with up to 3 financial pros who would be excited to help you make financial decisions.
Thank you for reading! Have some feedback for us?
Contact the 24/7 Wall St. editorial team.
Editors' Picks

