
Most Americans do not choose where they grow up and often end up living in the same place as adults, either for financial reasons or because of social and familial connections. Still, many Americans choose to pack up and move to a new state — usually in search of better life.
People who contemplate such a move would certainly consider a state’s overall quality of life. While every person is different and may weigh certain factors more than others, quality of life generally consists of a multitude of factors, including an area’s economy, jobs market, income levels, poverty, crime, education levels, health care, transportation, and whether the area is generally desirable.
Based on these factors and others, 24/7 Wall St. ranked all 50 states for overall quality of life.
Click here to see how livable each state is.
Click here to see our detailed findings and methodology.
Source: Thinkstock
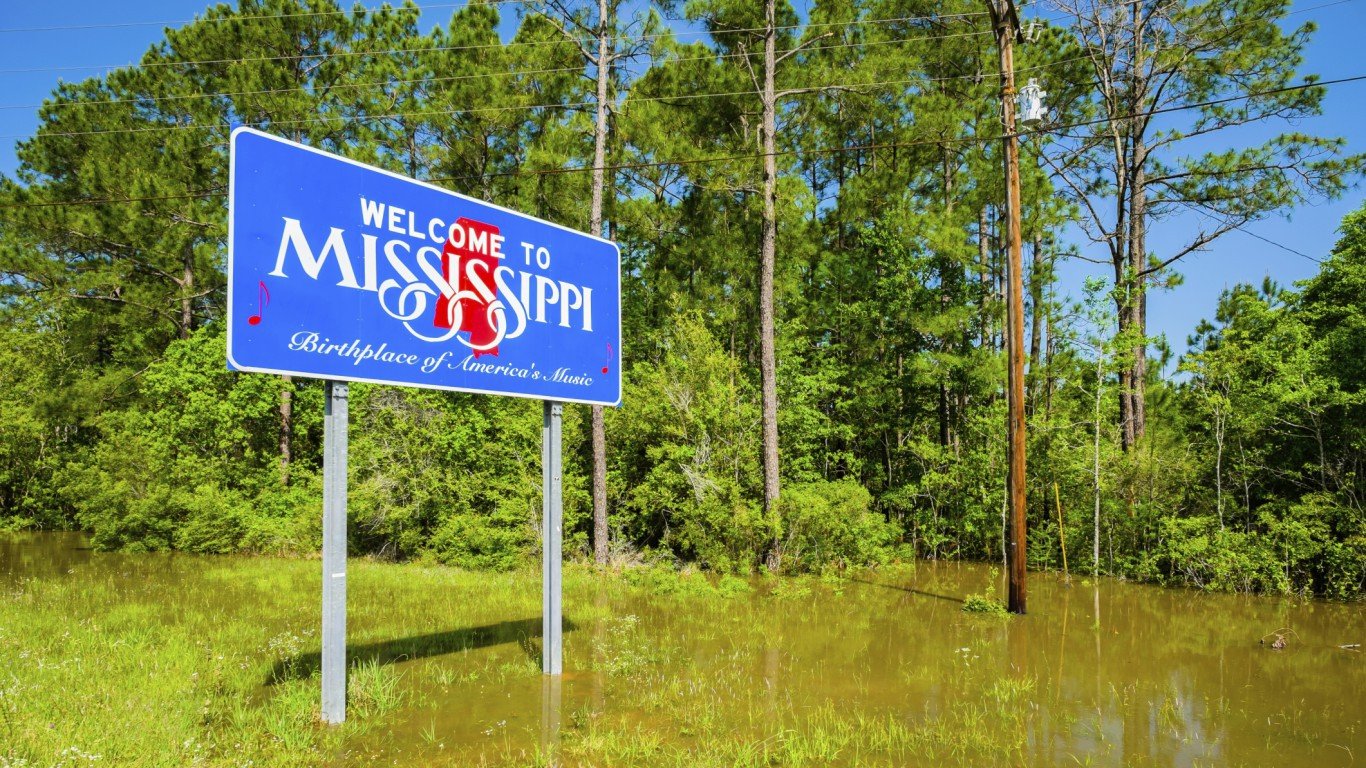
50. Mississippi
> 10-yr. population change: +2.7% (9th smallest increase)
> Annual unemployment: 5.8% (7th highest)
> Poverty rate: 20.8% (the highest)
> Life expectancy at birth: 74.8 years (the shortest)
The U.S. poverty line is set at an annual income of $12,060 for individuals and $24,600 for a family of four. By that standard, more than 1 in every 5 Mississippi residents live in poverty. The prevalence of financial hardship in the state is partially the product of a stagnant job market. An average of 5.8% of the state’s labor force was out of a job in 2016 — a larger share than in all but six other states and nearly a full percentage point above the U.S. annual unemployment rate of 4.9%.
Poor economic conditions in the state likely undermine social stability and personal well-being. Mississippi has both the highest teen birth rate and the largest share of children raised in single parent homes of any state in the country. Additionally, Mississippi is the only state in the country in which life expectancy is below 75 years.
[in-text-ad]

Source: https://www.flickr.com/photos/prayitnophotography/
49. Louisiana
> 10-yr. population change: +9.2% (25th smallest increase)
> Annual unemployment: 6.1% (3rd highest)
> Poverty rate: 20.2% (2nd highest)
> Life expectancy at birth: 75.8 years (4th shortest)
Louisiana struggles with a range of social and economic problems to a far greater degree than most states. The state is one of only two nationwide in which more than 1 in every 5 residents live in poverty. Also, no state has greater income inequality than Louisiana. Crime is also relatively common across Louisiana. There were 566 violent crimes and 3,298 property crimes in the state for every 100,000 residents — each among the five worst crime rates of all states in 2016.
Louisiana residents are also more likely than most Americans to struggle with poor health. About 35% of adults in the state are obese, third highest. Additionally, life expectancy at birth is only 75.8 years, about three years less than the average life expectancy nationwide.

Source: https://www.flickr.com/photos/82955120@N05/
48. West Virginia
> 10-yr. population change: +0.7% (2nd smallest increase)
> Annual unemployment: 6.0% (tied — 4th highest)
> Poverty rate: 17.9% (5th highest)
> Life expectancy at birth: 75.4 years (3rd shortest)
Compared to people with lower educational attainment, college-educated individuals tend to have a greater sense of control over their lives and are often better equipped to obtain high-paying jobs, which in turn support longer, healthier lives. In West Virginia, only 20.8% of the adult population has a bachelor’s degree, the smallest share of any state. Among West Virginia’s adult population, 25.7% are smokers and 34.6% are obese, each the second largest share among states. Unhealthy lifestyles lead to poor health outcomes, and adults in West Virginia report they feel physically unhealthy 5.1 days a month and mentally unhealthy 4.8 days, more than in any other state.
With some of the nation’s lowest incomes, financial hardship is relatively common in West Virginia. The typical household in the state earns $43,385 a year, less than in every state except for Mississippi and about $14,200 less than the median income nationwide.

Source: Thinkstock
47. Kentucky
> 10-yr. population change: +5.5% (16th smallest increase)
> Annual unemployment: 5.0% (tied — 18th highest)
> Poverty rate: 18.5% (4th highest)
> Life expectancy at birth: 75.8 years (6th shortest)
A strong economy is often the foundation of other positive socioeconomic outcomes. However, in a break from the national trend, Kentucky’s economy appears to be worsening rather than improving. The state is one of only a handful where unemployment worsened this year. Currently, 5.2% of Kentucky’s labor force is out of a job, the third highest unemployment rate of all states in September, compared to the 2016 annual average of 5.0%.
The state’s sluggish economy and poor jobs figures may partially explain the relatively large share of state residents living in poverty. Some 18.5% of Kentucky residents live below the poverty line, a larger share than in all but three other states.
[in-text-ad-2]
Source: Thinkstock
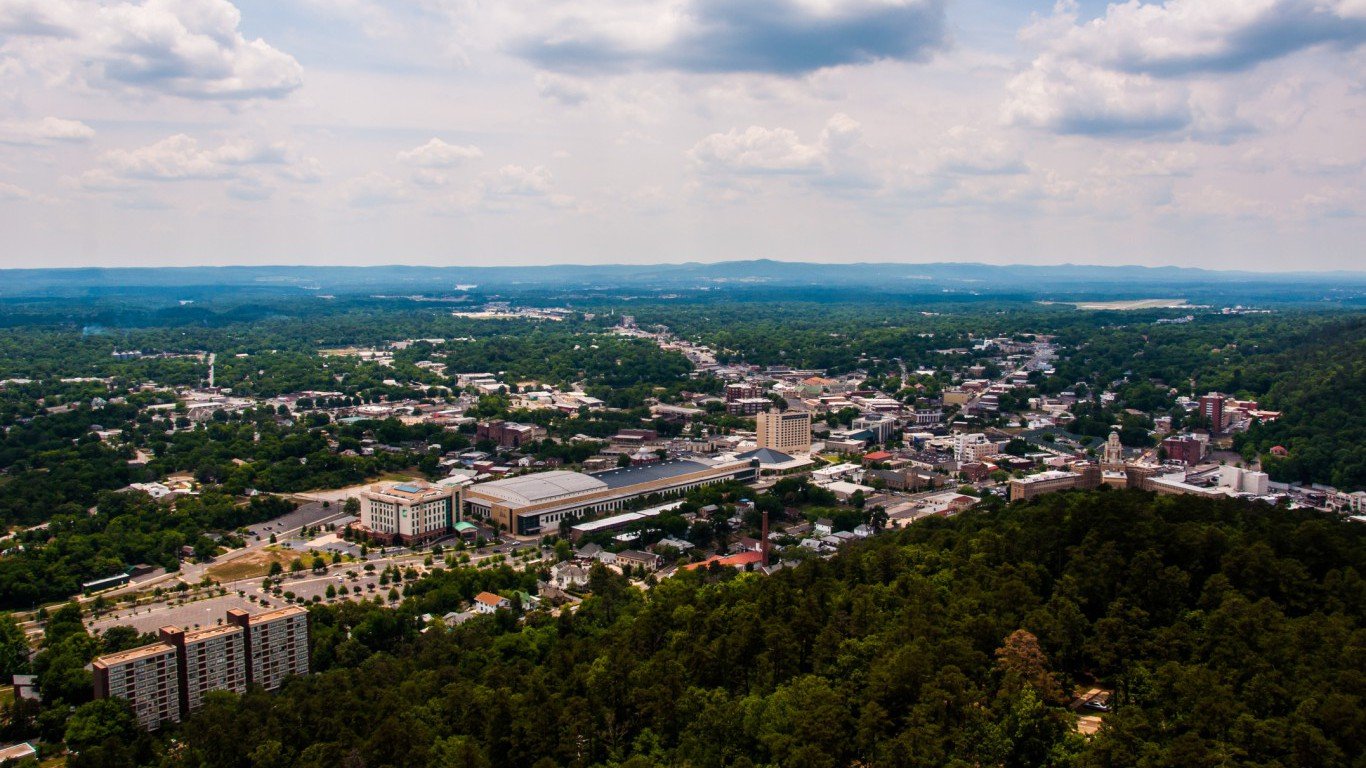
46. Arkansas
> 10-yr. population change: +6.3% (19th smallest increase)
> Annual unemployment: 4.0% (tied — 14th lowest)
> Poverty rate: 17.2% (6th highest)
> Life expectancy at birth: 75.8 years (7th shortest)
The typical household in Arkansas earns $44,334 a year, less than in all but two other states and about $13,300 less than the typical American household. As is often the case in low-income areas, cost of living is also lower in Arkansas. Goods and services in the state are 12.6% less expensive on average than they are nationwide. While the low cost of living can help somewhat offset the low incomes, for many it is not nearly enough. As many as 17.2% of state residents live below the poverty line, well above the 14.0% U.S. poverty rate.
Healthy lifestyles, and medical bills both for preventative as well as unexpected care, can be prohibitively expensive for low-income individuals, and the relatively widespread financial hardship in Arkansas may partially explain the poor health outcomes in the state. An estimated 23% of adults report being in fair or poor health, the largest share of any state with the exception of West Virginia.
Source: Thinkstock
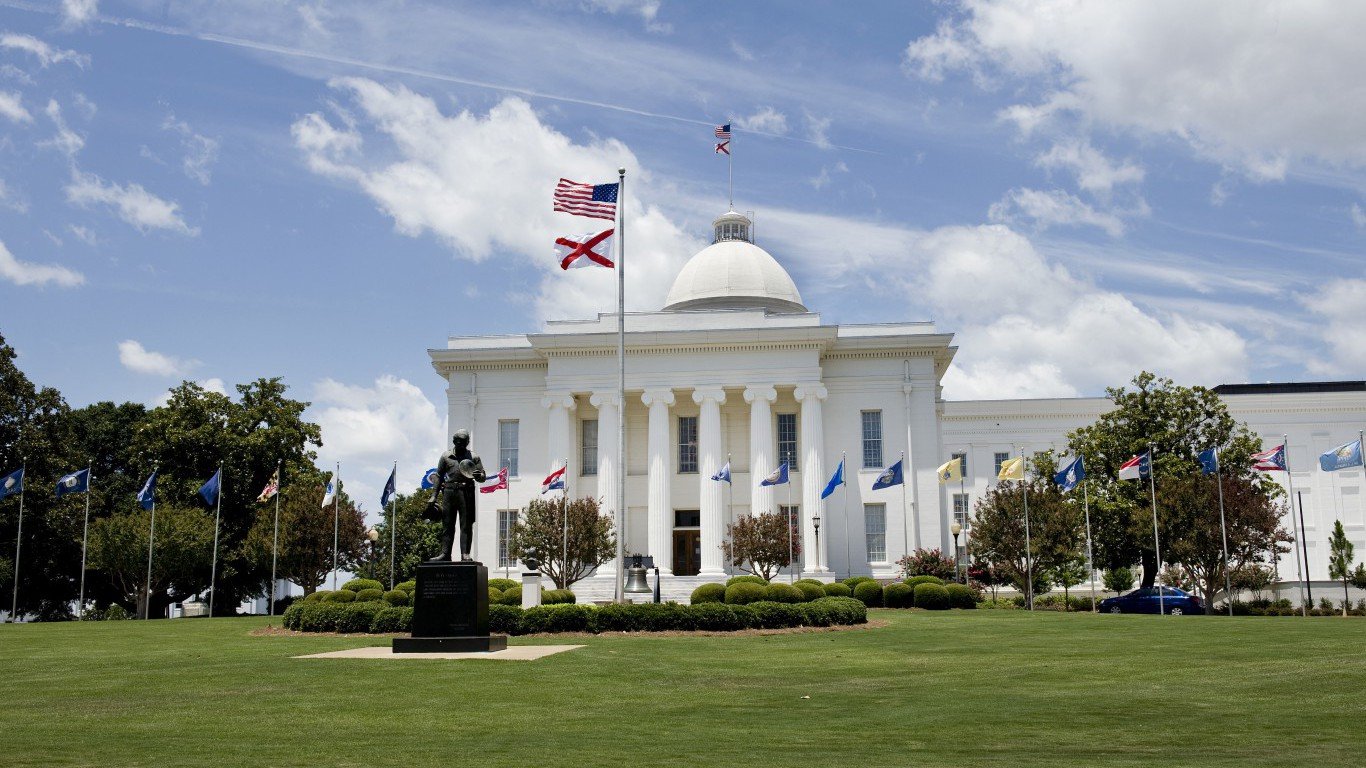
45. Alabama
> 10-yr. population change: +5.7% (17th smallest increase)
> Annual unemployment: 6.0% (tied — 4th highest)
> Poverty rate: 17.1% (7th highest)
> Life expectancy at birth: 75.4 years (2nd shortest)
As a whole, Alabama’s population is one of the least healthy in the United States. The average life expectancy at birth is only 75.4 years, the second lowest after Mississippi. More than 1 in 5 adults are smokers, and more than 1 in 3 are obese, each among the higher shares compared to all states. Adults in Alabama are also less likely to have physically active lifestyles than adults in other states. The tendency towards relatively sedentary lifestyles may partially be the result of a lack of opportunity. Only 62.8% of Alabama residents have adequate access to places for physical activity like parks, gyms, and recreation centers, a smaller share than in all but three other states.
Rent prices in the state are approximately 63% of what they are on average nationwide, less than in any other state. Low housing costs often reflect low demand. On the other hand, Alabama residents benefit from cheap rent.
[in-text-ad]
Source: Thinkstock
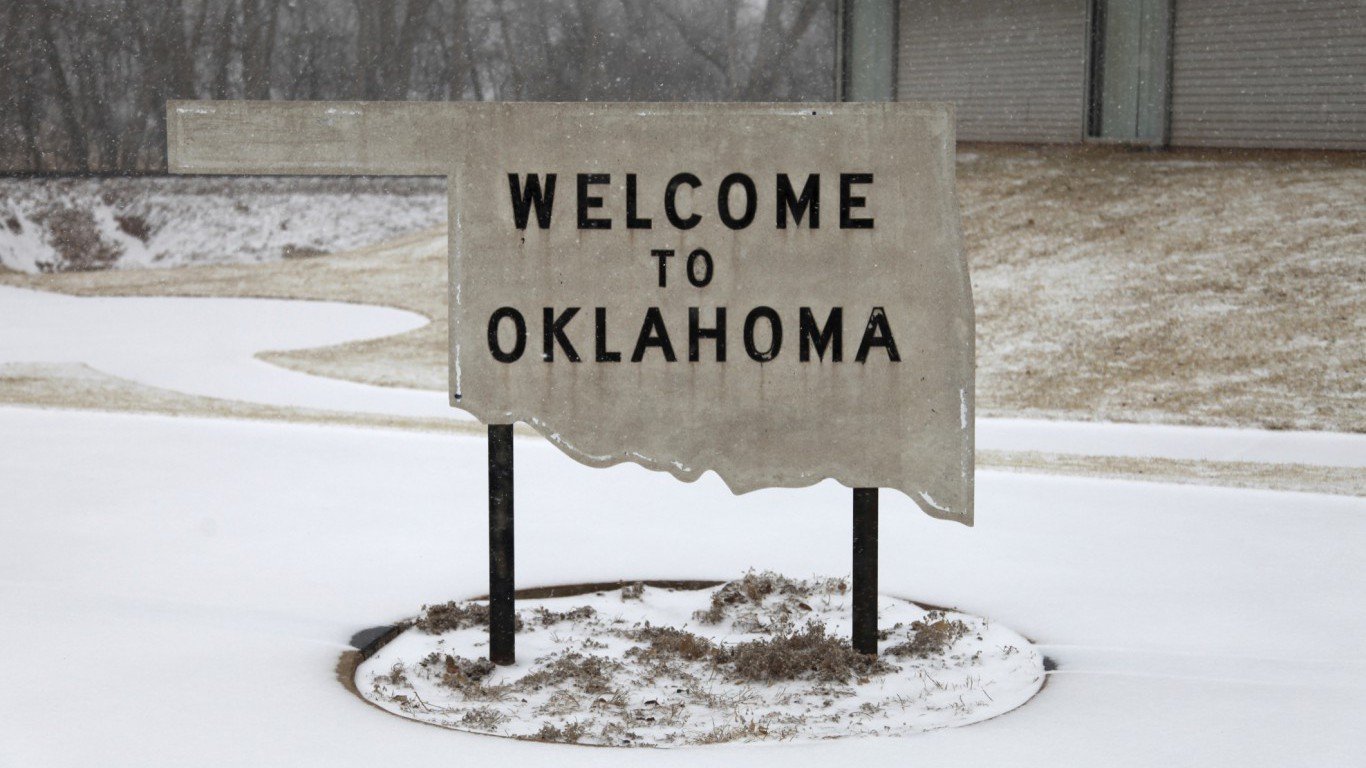
44. Oklahoma
> 10-yr. population change: +9.6% (25th largest increase)
> Annual unemployment: 4.9% (tied — 20th highest)
> Poverty rate: 16.3% (9th highest)
> Life expectancy at birth: 75.8 years (5th shortest)
The average life expectancy at birth is 75.8 years in Oklahoma, about three years less than the average life expectancy nationwide. The shorter life expectancy is partially due to unhealthy lifestyles. Among adults in the state, 22.2% are smokers, 32.7% are obese, and 29.1% get no exercise beyond getting up and going to work — each among the higher such shares in any state. A relatively large uninsured population exacerbates the problem. Oklahoma’s 13.5% uninsured rate is the third highest among states and well above the 8.5% uninsured rate nationwide.
Adults with a college education typically live longer, healthier lives than those without a college degree. In Oklahoma, only 25.2% of residents 25 and older have a bachelor’s degree, well below the comparable share of American adults of 31.3%.
 24/7 Wall St.
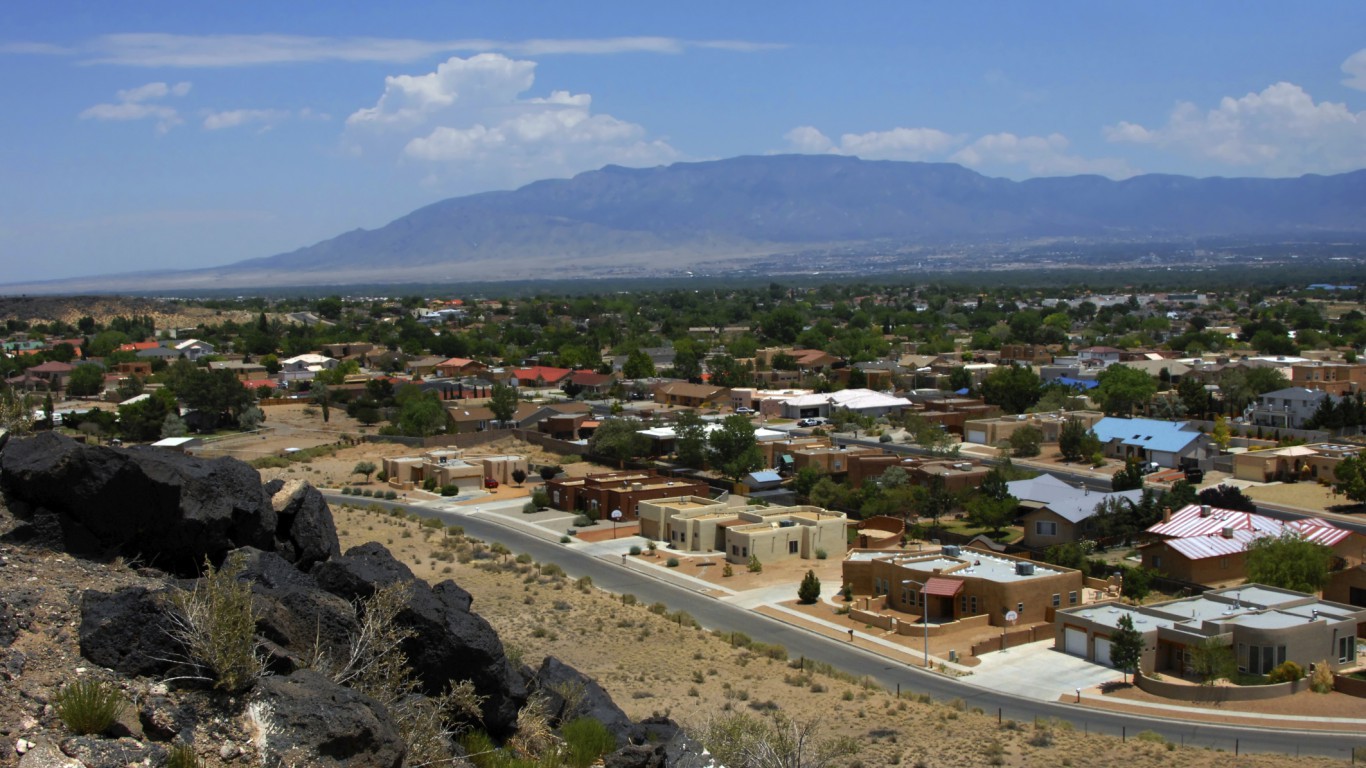
Source: Thinkstock
43. New Mexico
> 10-yr. population change: +6.5% (20th smallest increase)
> Annual unemployment: 6.7% (the highest)
> Poverty rate: 19.8% (3rd highest)
> Life expectancy at birth: 78.2 years (16th shortest)
New Mexico is grappling with a range of social and economic problems. For example, New Mexico has the second highest violent crime rate and the highest property crime rate of among states. And nearly 1 in every 5 state residents live below the poverty line, the largest share of any state after only Mississippi and Louisiana. Some of these issues can be traced to the prevalence of single-parent households. More than 1 in every 4 children in the state live in a single parent household, the third highest such share among states. Adults in single parent households are at greater risk of substance abuse and depression, and children raised by single parents are vulnerable to adverse health outcomes and have higher rates of mortality compared to children of parents living as couples.

Source: https://www.flickr.com/photos/chucksutherland/
42. Tennessee
> 10-yr. population change: +10.1% (19th largest increase)
> Annual unemployment: 4.8% (tied — 24th highest)
> Poverty rate: 15.8% (11th highest)
> Life expectancy at birth: 76.4 years (8th shortest)
Most of the worst states to live in are located in the South, as is Tennessee. Across broad populations, higher levels of educational attainment often lead to greater economic prosperity and better overall health outcomes. In Tennessee, only 26.1% of adults have earned a bachelor’s degree, versus the 31.3% of adults nationwide. In Tennessee, the lower educational attainment rates may partially explain the greater financial insecurity. Some 15.8% of the state’s population live in poverty compared to 14.0% of the total U.S. population.
Tennessee residents are also less healthy than the typical American. Adults in the state report feeling physically unhealthy an average of 4.8 days per month, the most of any state except West Virginia.
[in-text-ad-2]
Source: Thinkstock
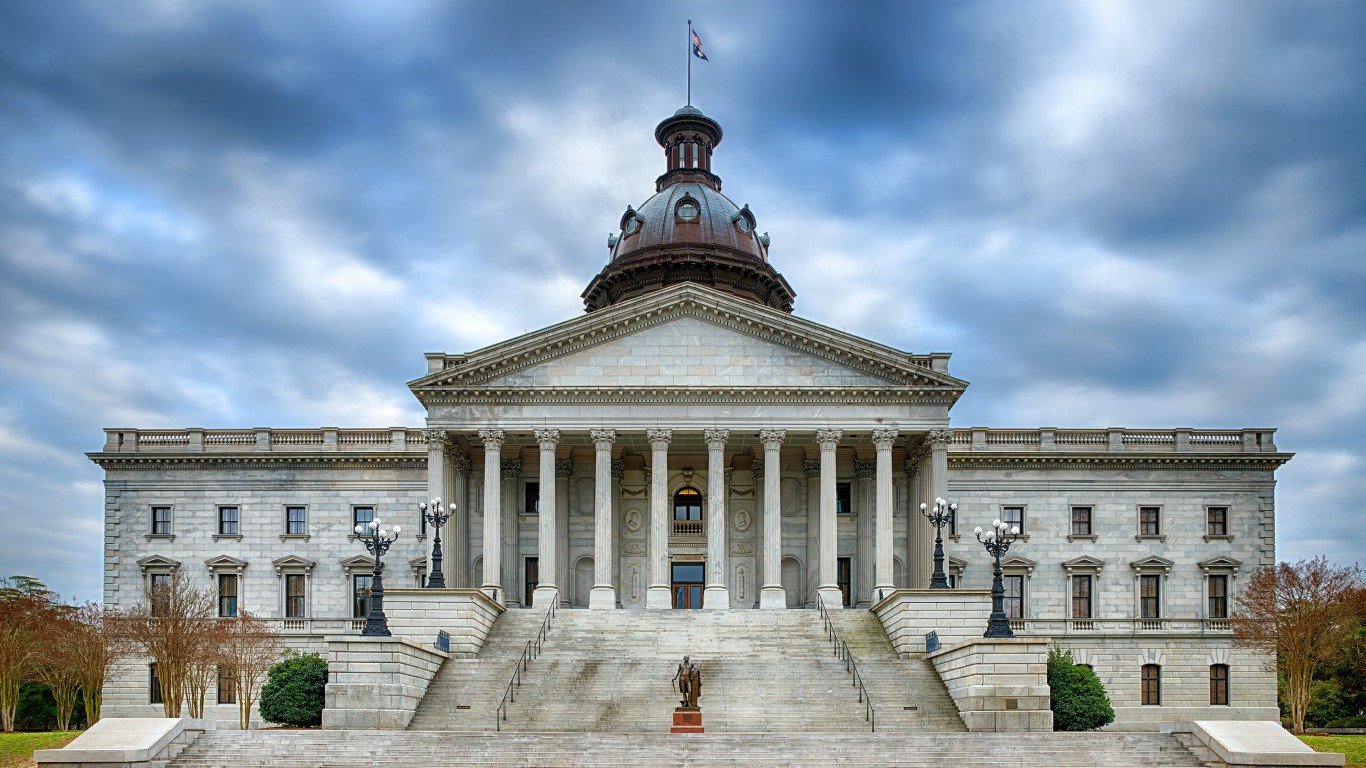
41. South Carolina
> 10-yr. population change: +14.8% (6th largest increase)
> Annual unemployment: 4.8% (tied — 24th highest)
> Poverty rate: 15.3% (14th highest)
> Life expectancy at birth: 76.9 years (9th shortest)
For many living in South Carolina, the high crime rates dramatically reduce their quality of life. There were 502 violent crimes and 3,244 property crimes for every 100,000 state residents in 2016, each among the 10 highest crime rates of any state. Incomes in the state are also relatively low. The typical household in South Carolina earns $49,501 a year, well below the median income nationwide of $57,617. Additionally, 15.3% of state residents live on poverty level incomes, slightly higher than the 14.0% U.S. poverty rate.
Despite some negative socioeconomic indicators, Americans appear to be flocking to South Carolina. The state’s population spiked by 14.8% in the last decade, nearly double the comparable U.S. population growth of 7.9%.
Source: Thinkstock
40. Indiana
> 10-yr. population change: +5.1% (13th smallest increase)
> Annual unemployment: 4.4% (tied — 20st lowest)
> Poverty rate: 14.1% (21st highest)
> Life expectancy at birth: 77.3 years (10th shortest)
Of all 12 midwestern states, Indiana ranks as the worst on this index. Among adults in the state, only 25.6% have a bachelor’s degree, and 88.4% a high school diploma, each the smallest such share in the region. Better health outcomes are often tied to better education, and by several measures, Indiana’s adult population is the least healthy in the Midwest. About 32% of adults in Indiana are obese, and 26% get no exercise beyond getting up and going to work, each the largest such share in the region and among the 10 worst of all states.
The unhealthy lifestyles of state residents partially explain the low life expectancy in the state. At 77.3 years, life expectancy at birth in Indiana is about a year and a half shy of the U.S. life expectancy.
[in-text-ad]

Source: Thinkstock
39. Nevada
> 10-yr. population change: +17.8% (4th largest increase)
> Annual unemployment: 5.7% (8th highest)
> Poverty rate: 13.8% (23rd highest)
> Life expectancy at birth: 78.2 years (17th shortest)
Adults with a college education are often more resilient to economic downturns than those with only a high school diploma. In Nevada, only 23.5% of adults have a bachelor’s degree, the sixth smallest share among states. Nevada’s 5.7% annual unemployment rate is higher than in all but seven other states and well above the comparable U.S. rate of 4.9%. In addition to a relatively limited number of college-educated adults, high crime may also deter employers from the state. There were 678 violent crimes in Nevada for every 100,000 residents in 2016, the third highest violent crime rate among states.
Despite some negative socioeconomic indicators, Nevada’s population is growing. In the last 10 years, the number of people living in the state spiked by 17.8%, faster than in all but three other states and more than double the U.S. population growth rate over that time of 7.9%.

Source: Thinkstock
38. Ohio
> 10-yr. population change: +1.2% (4th smallest increase)
> Annual unemployment: 4.9% (tied — 20th highest)
> Poverty rate: 14.6% (18th highest)
> Life expectancy at birth: 77.6 years (13th shortest)
Population growth is one indication of a state’s quality of life, as people tend to move to more desirable areas and avoid places where they do not expect high living standards. Ohio’s total population grew by only 1.2% in the last 10 years, well below the 7.9% U.S. population growth. Ohio’s slower than typical population growth has coincided with significant employment declines in the state’s once strong manufacturing sector. Further, economic conditions to do not appear to be improving. Some 5.3% of the state’s labor force is out of a job as of September, compared to the 2016 average unemployment rate of 4.9%.
Educational attainment rates in the state are indicative of the state’s past as a manufacturing powerhouse, a time when college degrees were not always required to obtain a high-paying job. Only 27.5% of state adults have a bachelor’s degree, compared to 31.3% of American adults.

Source: Thinkstock
37. Georgia
> 10-yr. population change: +10.1% (20th largest increase)
> Annual unemployment: 5.4% (tied — 9th highest)
> Poverty rate: 16.0% (10th highest)
> Life expectancy at birth: 77.5 years (11th shortest)
Though Georgia ranks better than most other southern states, it still ranks behind most states nationwide. Some 16.0% of Georgia residents live in poverty, the 10th highest poverty rate of any state. Relatively high unemployment partially explains the relatively widespread financial hardship. The state’s 2016 unemployment rate of 5.4% is higher than all but eight other states and well above the U.S. unemployment rate last year of 4.9%.
Despite some economic woes, Georgia’s population is growing faster than most other states. In the past decade, the Peach State’s population grew by 10.1%, faster than the U.S. population growth rate of only 7.9%.
[in-text-ad-2]
Source: Thinkstock
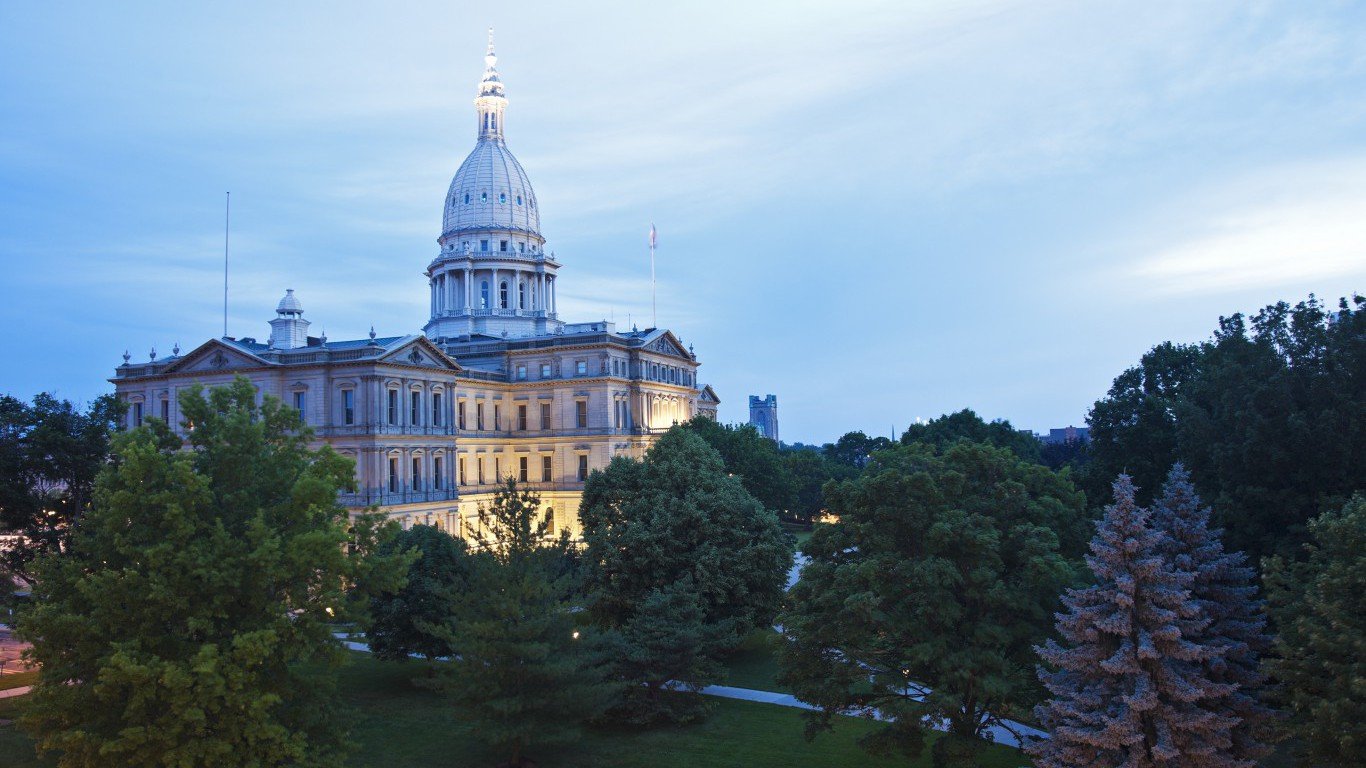
36. Michigan
> 10-yr. population change: -1.7% (the largest decline)
> Annual unemployment: 4.9% (tied — 20th highest)
> Poverty rate: 15.0% (15th highest)
> Life expectancy at birth: 78.1 years (15th shortest)
Michigan’s population shrank by 1.7% in the past decade, the steepest decline of any state. Population loss concentrated in the state’s largest city, Detroit, is partially to blame. The Motor City’s population fell from a high of 1.8 million in 1950 to 837,000 in 2005, to 680,000 in 2014.
Detroit’s decline mirrors the story of decline across the U.S. manufacturing industry, with losses concentrated in former manufacturing hubs. Educational attainment rates across Michigan still indicate the state’s past as a manufacturing powerhouse. The U.S. manufacturing sector used to provide high-paying jobs that did not require higher education. Today, some 90.4% of adults in Michigan have a high school diploma, more than the 87.5% share of adults nationwide. However, only 28.3% of adults in the state have a bachelor’s degree compared to 31.3% of American adults.

Source: Thinkstock
35. Missouri
> 10-yr. population change: +4.3% (12th smallest increase)
> Annual unemployment: 4.5% (22nd lowest)
> Poverty rate: 14.0% (22nd highest)
> Life expectancy at birth: 77.6 years (12th shortest)
Unhealthy behaviors in Missouri likely contribute to a high mortality rate and other negative health outcomes in the state. Some 22.3% of adults in the state smoke and 25.0% do not exercise regularly, each some of the largest shares in the country. Roughly 386 in every 100,000 Missouri residents die before the age of 75,the 11th highest premature mortality rate.
Crime is also relatively prevalent in Missouri. Largely concentrated in St. Louis, Missouri’s violent crime rate is one of the highest of any state. There were 519 violent crimes reported per 100,000 Missouri residents in 2016, far more than the national rate of 397 incidents per 100,000 Americans.
[in-text-ad]

Source: Thinkstock
34. North Carolina
> 10-yr. population change: +14.6% (8th largest increase)
> Annual unemployment: 5.1% (tied — 16th highest)
> Poverty rate: 15.4% (13th highest)
> Life expectancy at birth: 77.9 years (14th shortest)
North Carolina lags behind the nation as a whole in a few critical socioeconomic measures. For example, the median household income in North Carolina is only $50,584 a year, considerably lower than the $57,617 median income nationwide. Additionally, a larger than typical share of state residents face serious financial hardship. Some 15.4% of North Carolina’s population live in poverty compared to 14.0% of Americans. These could be the result of both slightly lower educational attainment rate — 30.4% of adults in the state have a bachelor’s degree compared 31.3% of adults nationwide — and a higher unemployment rate of 5.1% compared to 4.9% nationally.
Still, Americans appear to be flocking to the Tar Heel State. In the last decade, North Carolina’s population grew by 14.6% — nearly double the U.S. population growth of 7.9%.
 24/7 Wall St.
Source: https://www.facebook.com/starr.countytexas
33. Texas
> 10-yr. population change: +18.5% (3rd largest increase)
> Annual unemployment: 4.6% (23rd lowest)
> Poverty rate: 15.6% (12th highest)
> Life expectancy at birth: 78.6 years (20th shortest)
On an individual basis, a basic level of education is the foundation for a healthy, financially stable life. In Texas, only 82.9% of adults have earned a high school diploma, the second smallest share among states. Many state residents face further obstacles to a healthy life as some 16.3% of Lone Star State residents are without health insurance, the highest uninsured rate of any state. Currently, some 19.3% of adults in Texas report being in fair or poor health, a considerably higher share than the 15.0% of Americans who report being similar health.
While Texas lags behind most states in some measures of educational attainment and health, it is does not appear to be struggling to attract new residents. In the last decade, the population of Texas grew by 18.5%, third fastest after North Dakota and Utah.

Source: Thinkstock
32. Arizona
> 10-yr. population change: +12.4% (12th largest increase)
> Annual unemployment: 5.3% (tied — 13th highest)
> Poverty rate: 16.4% (8th highest)
> Life expectancy at birth: 79.6 years (16th longest)
Arizona struggles more than most states from economic and social instability. An estimated 16.4% of state residents live in poverty, a larger share than in all but seven states and well above the U.S. poverty rate of 14.0%. The incidence of violent crime can severely diminish quality of life for individuals exposed to it. In Arizona, there were 470 violent crimes and 2,978 property crimes for every 100,000 state residents in 2016, well above the respective nationwide crime rates of 397 and 2,451 for every 100,000 Americans.
High crime rates can stifle economic growth, and in Arizona joblessness is relatively common. Some 5.3% of the state’s labor force was out of a job in 2016 compared to 4.9% of the U.S. workforce.
[in-text-ad-2]
Source: Thinkstock
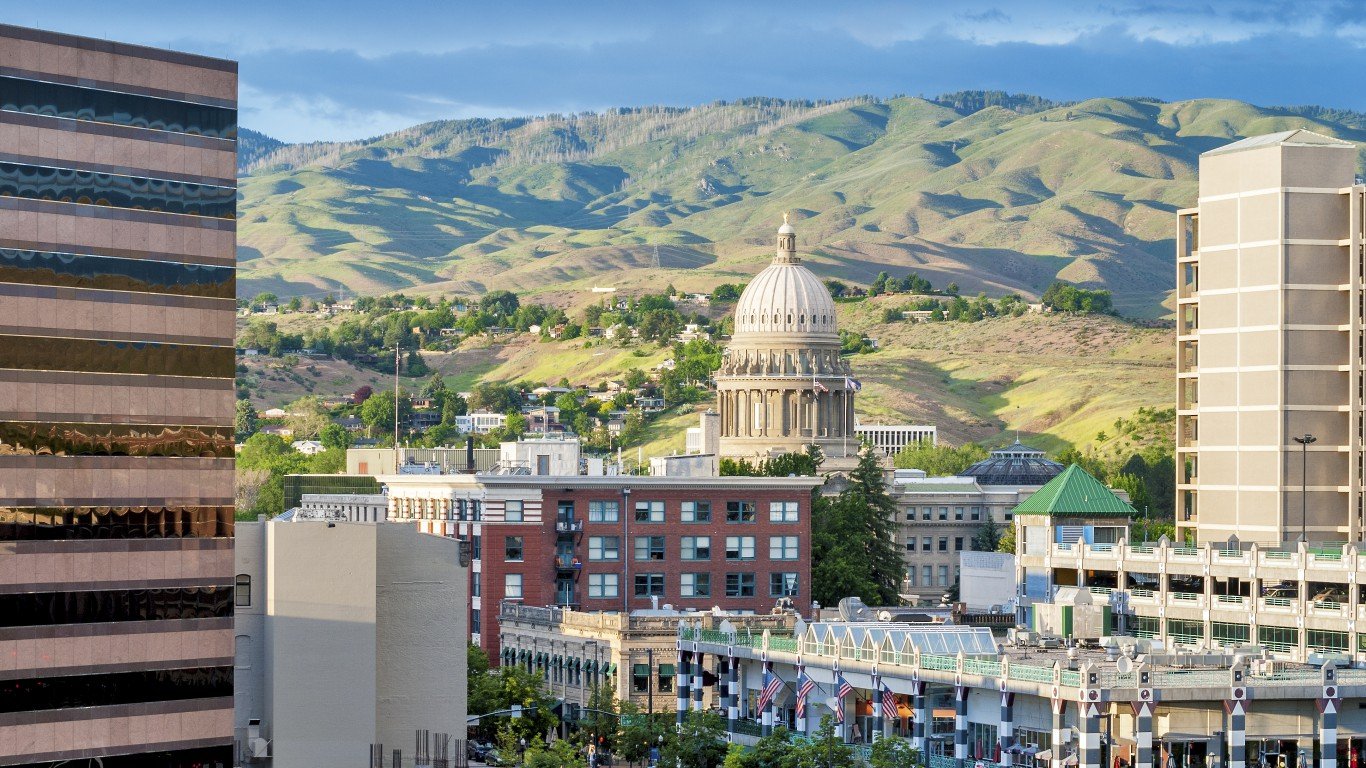
31. Idaho
> 10-yr. population change: +14.8% (7th largest increase)
> Annual unemployment: 3.8% (11th lowest)
> Poverty rate: 14.4% (19th highest)
> Life expectancy at birth: 79.2 years (23rd longest)
People with a college degree tend to live longer, healthier lives and are more likely to avoid serious financial hardship than people without a college degree. In Idaho, only 27.6% the adult population have earned a bachelor’s degree, a smaller share than the 31.3% of American adults. This might explain in part why poverty is slightly more common in Idaho than it is nationwide. Some 14.4% of state residents live in poverty compared to 14.0% of Americans. Still, despite the smaller than typical college educated population and slightly higher poverty, life expectancy in Idaho is 79.2 years, slightly longer than the average life expectancy nationwide of 78.9 years.

Source: flickr
30. Florida
> 10-yr. population change: +13.9% (10th largest increase)
> Annual unemployment: 4.9% (tied — 20th highest)
> Poverty rate: 14.7% (tied — 16th highest)
> Life expectancy at birth: 79.7 years (13th longest)
Florida has the highest life expectancy of any southern state. Life expectancy at birth in Florida is 79.7 years — nearly a year longer than life expectancy nationwide. While state residents tend to live longer and healthier lives, most of them do so on a tighter than average budget. While the cost of living in the state is comparable to that of the U.S. as a whole, the typical Florida household earns only $50,860 a year, or about $6,800 less than the typical American household. Additionally, 14.7% of Floridians live on poverty level incomes, slightly more than the 14.0% of Americans.
Like many states in the South, Florida is growing rapidly. In the last 10 years, the state’s population expanded by 13.9%, far faster than the U.S. population growth of 7.9%.
[in-text-ad]
Source: Thinkstock
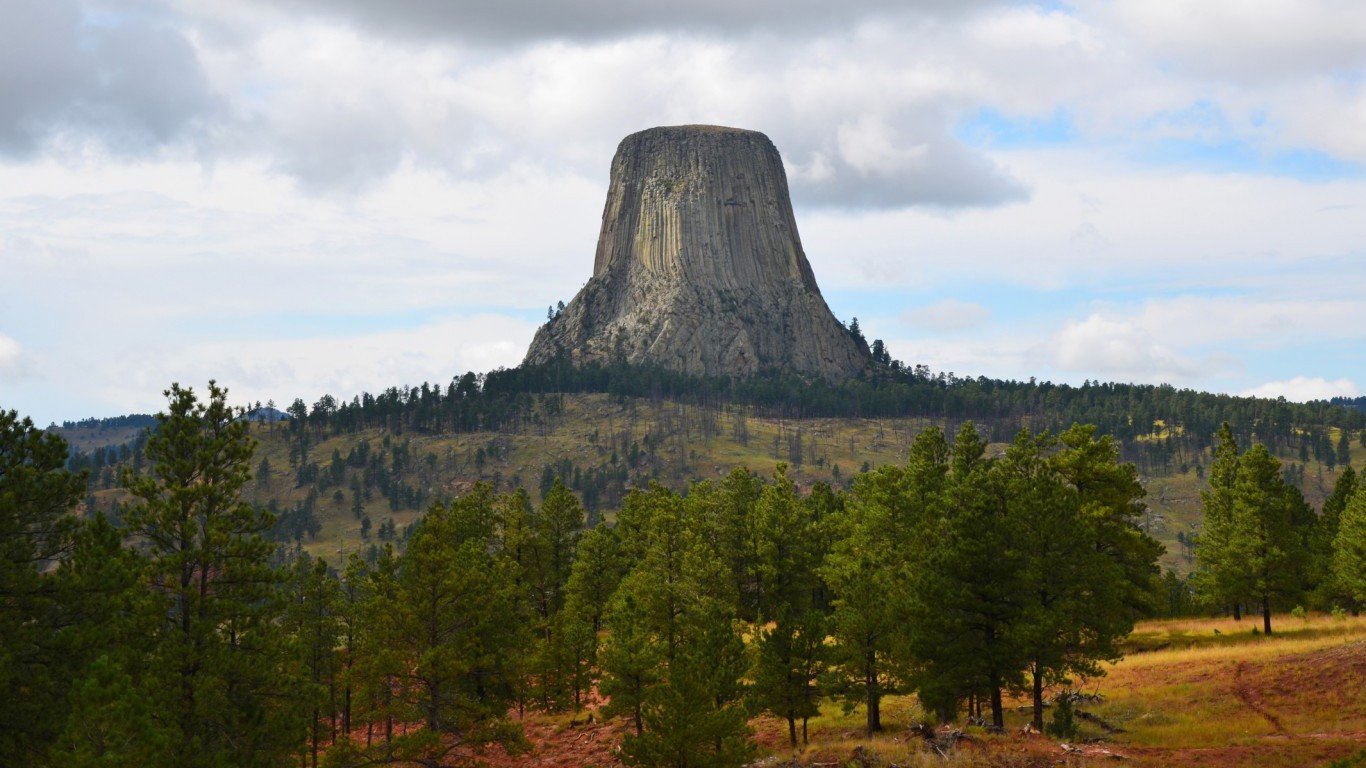
29. Wyoming
> 10-yr. population change: +13.7% (11th largest increase)
> Annual unemployment: 5.3% (tied — 13th highest)
> Poverty rate: 11.3% (tied — 14th lowest)
> Life expectancy at birth: 78.5 years (18th shortest)
On an individual level, education offers the opportunity of a long, healthy life. Across a population, high educational attainment rates often translate to greater economic prosperity. Only 27.1% of adults in Wyoming have at least a bachelor’s degree — a smaller share than in most states and well below the 31.3% share of American adults. However, the state also has the highest high school diploma attainment rate of any state, at 93.2%.
Other socioeconomic measures important to quality of life range widely in Wyoming. For example, both poverty and violent crime are less common in Wyoming than across the nation as a whole. The state’s unemployment rate of 5.3%, on the other hand, is slightly above the U.S. rate of 4.9%.
Source: Thinkstock
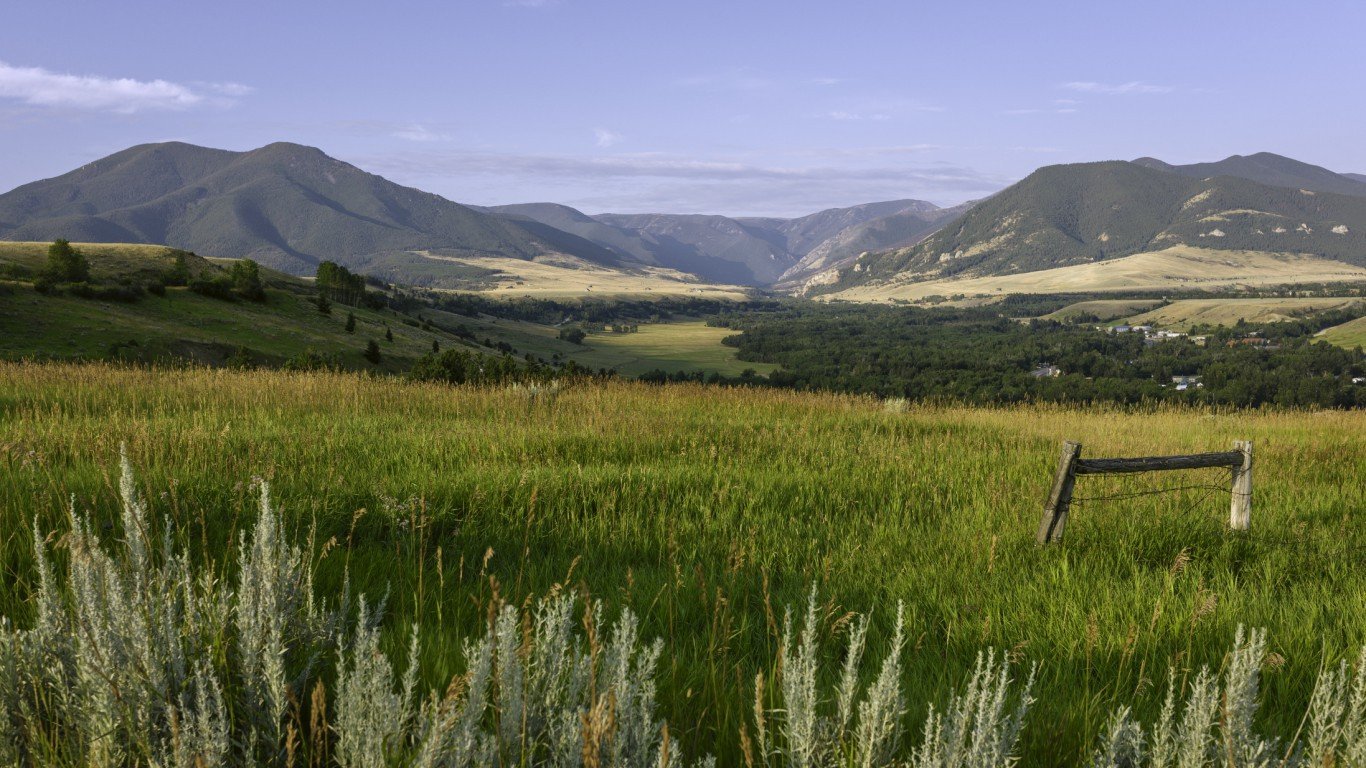
28. Montana
> 10-yr. population change: +10.4% (18th largest increase)
> Annual unemployment: 4.1% (tied — 16th lowest)
> Poverty rate: 13.3% (tied — 24th highest)
> Life expectancy at birth: 78.8 years (22nd shortest)
Adults with a college education are more likely to lead longer, healthier lives and avoid serious financial hardship. In Montana, 31.0% of adults have a bachelor’s degree or higher, roughly in line with the 31.3% share of adults nationwide. Additionally, at 78.8 years, life expectancy in the state is also nearly in line with average life expectancy at birth nationwide.
The typical household in Montana earns $50,027 a year, or about $7,600 less than the typical American household. Despite the lower incomes, only 13.3% of state residents live in poverty — a smaller share than the 14.0% of Americans.

Source: Thinkstock
27. Pennsylvania
> 10-yr. population change: +2.8% (10th smallest increase)
> Annual unemployment: 5.4% (tied — 9th highest)
> Poverty rate: 12.9% (23rd lowest)
> Life expectancy at birth: 78.6 years (21st shortest)
Like many states ranking in the middle of this list, Pennsylvania’s population is by some measures better off and by others worse off compared to the U.S. population as a whole. The state’s violent and property crime rates of 316 and 1,743 per 100,000 people, respectively, are both below the respective national crime rates of 397 and 2,450 per 100,000. The state population is also much more likely to have health insurance, an important indicator of financial stability. Just 5.5% of Pennsylvanians lack health insurance compared to 8.5% of Americans.
In other measures of quality of life, however, the state lags behind. For example, Pennsylvania’s annual unemployment rate of 5.4% is the ninth highest among states.
[in-text-ad-2]
Source: Thinkstock
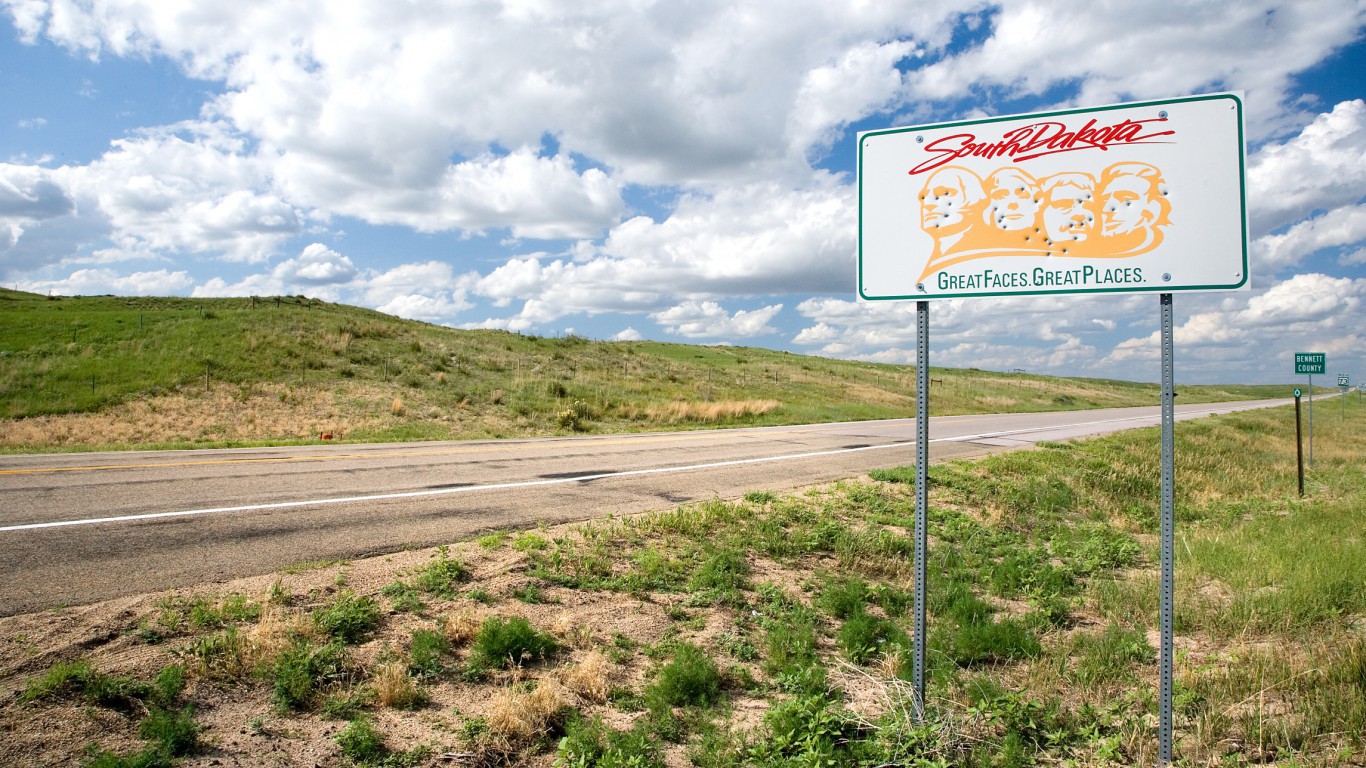
26. South Dakota
> 10-yr. population change: +10.7% (16th largest increase)
> Annual unemployment: 2.8% (tied — the lowest)
> Poverty rate: 13.3% (tied — 24th highest)
> Life expectancy at birth: 79.5 years (19th longest)
Across broad populations, some socioeconomic measures — such as poverty and life expectancy — tend to improve as educational attainment levels increase. In South Dakota, 28.9% of adults have a bachelor’s degree or higher compared to 31.3% of adults nationwide. Despite the lower educational attainment, the state’s poverty rate of 13.3% is lower than the national poverty rate of 14.0%. Further, life expectancy at birth in South Dakota is 79.5 years compared to 78.9 years nationwide.
South Dakota’s annual average unemployment rate of 2.8% last year was tied for the lowest in the country. The monthly rate ticked up to 3.4% in September, still one of the lowest jobless rates in the country.
Source: Thinkstock
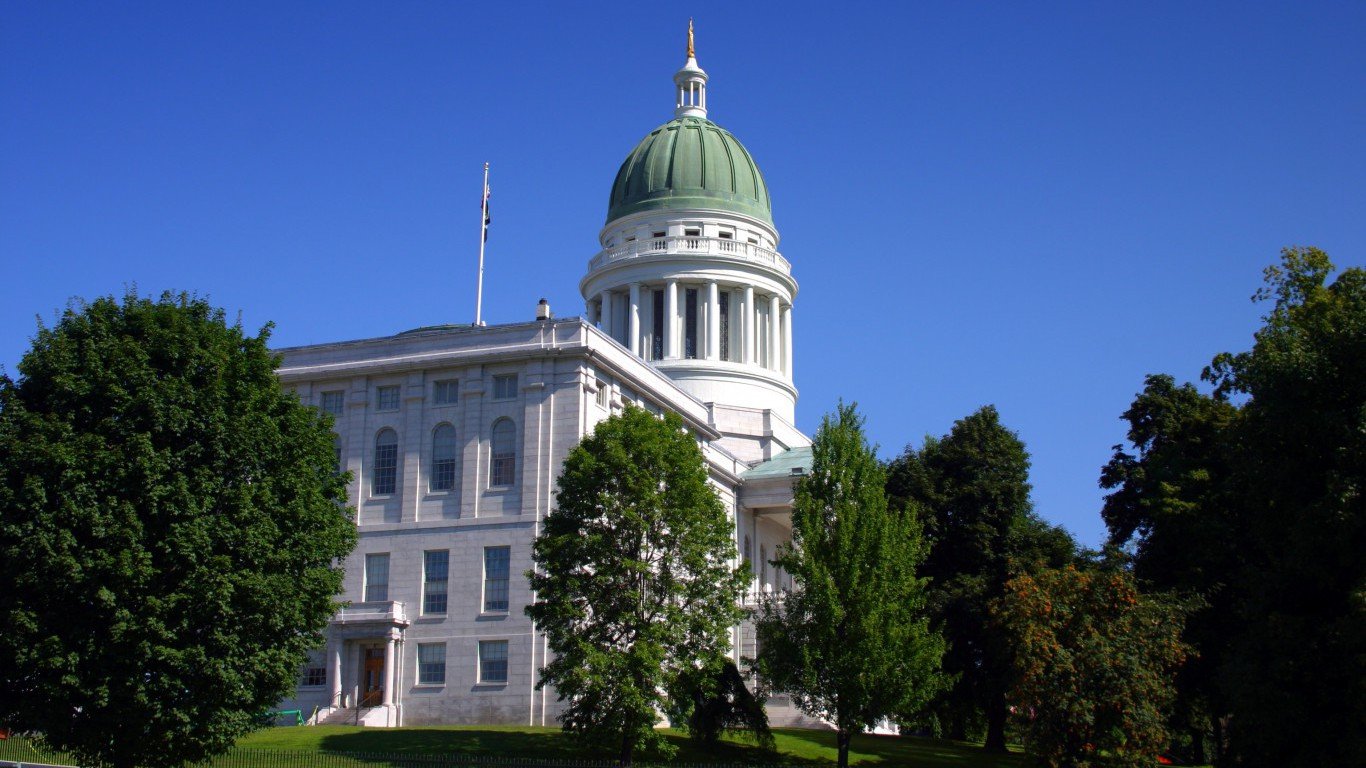
25. Maine
> 10-yr. population change: +0.7% (3rd smallest increase)
> Annual unemployment: 3.9% (tied — 12th lowest)
> Poverty rate: 12.5% (21st lowest)
> Life expectancy at birth: 79.1 years (25th longest)
Falling dead center in 24/7 Wall St.’s ranking of state liveability is Maine, with some measures of livability rating better than nationwide measures, while others rating worse. Residents tend to have good access to medical care as the state has a high concentration of both physicians and mental health providers. However, health outcomes tend to be average at best. The premature mortality rate in the state is only slightly below the national figure, while residents report feeling physically or mentally unhealthy more days in a given month than the average American.
On the other hand, Maine’s crime rate of 124 incidents for every 100,000 residents is the lowest of all states.
[in-text-ad]
Source: Thinkstock
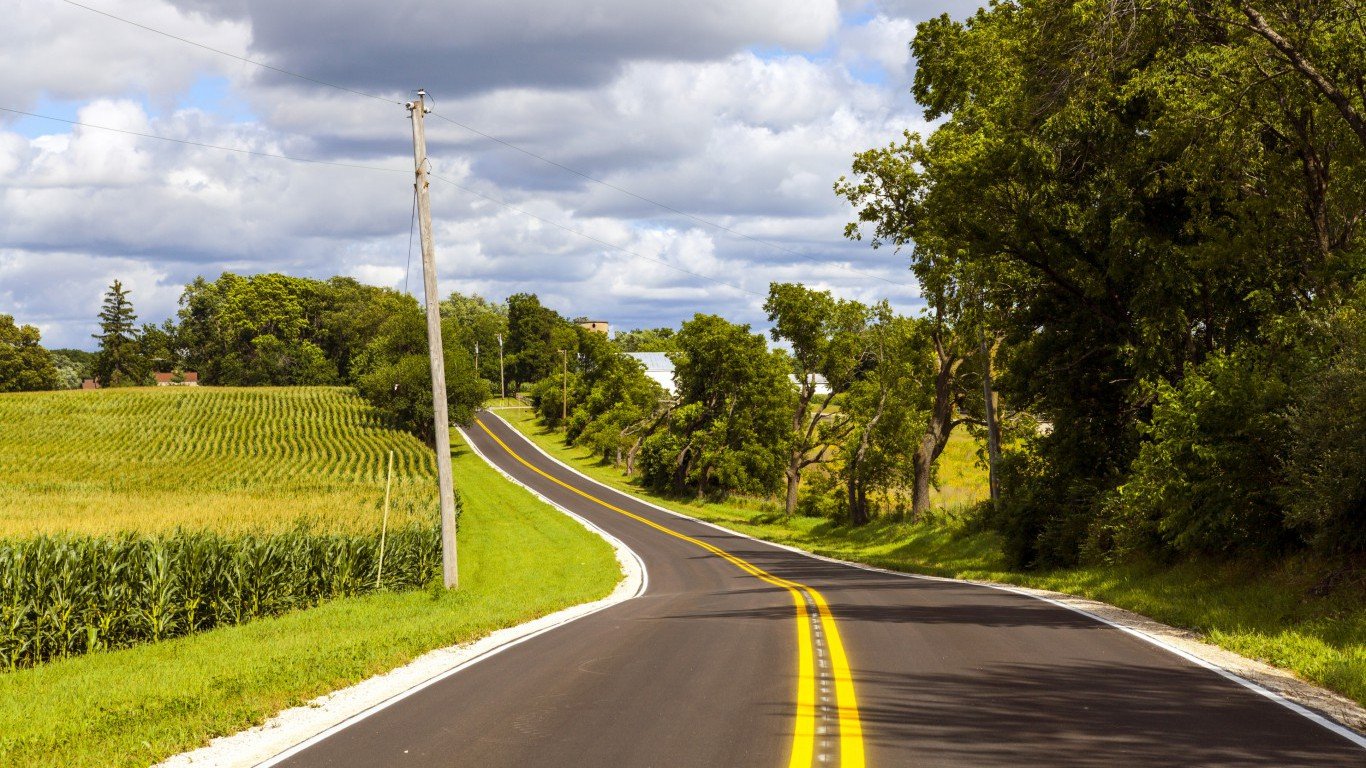
24. Iowa
> 10-yr. population change: +5.1% (14th smallest increase)
> Annual unemployment: 3.7% (tied — 9th lowest)
> Poverty rate: 11.8% (tied — 18th lowest)
> Life expectancy at birth: 79.3 years (21st longest)
Iowa’s economy is fairing better than most states’. An average of only 3.7% of the state’s labor force were unemployed in 2016, well below the U.S. unemployment rate of 4.9% last year. The strong jobs numbers help reduce the share of state residents struggling financially. Only 11.8% of Iowa’s population lives in poverty, far less than the share of Americans living in poverty of 14.0%.
Poverty can greatly limit families’ and individuals’ ability to lead healthy lives, and Iowa’s low poverty rate may partially explain some of the positive health outcomes among its population. Life expectancy at birth in Iowa is 79.3 years, slightly longer than the U.S. life expectancy of 78.9 years.

Source: Thinkstock
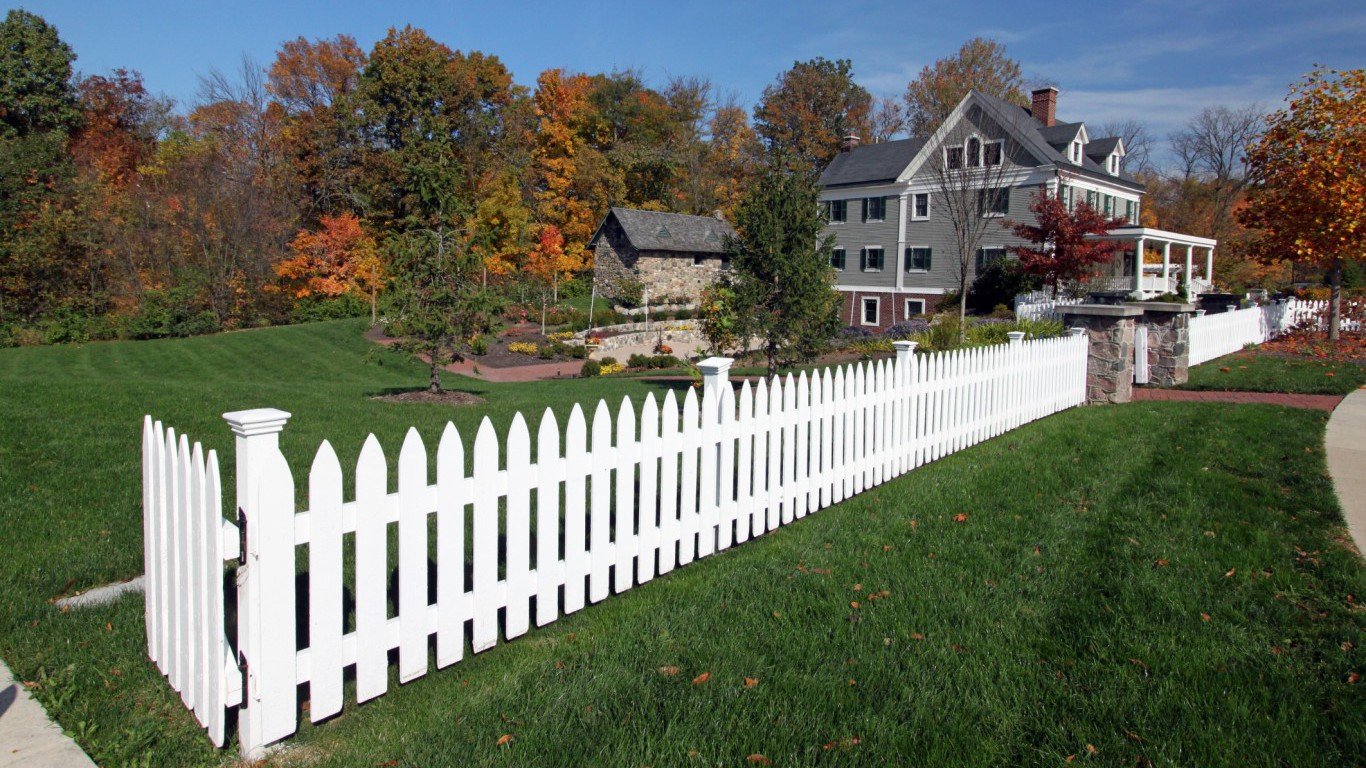
23. Delaware
> 10-yr. population change: +11.6% (13th largest increase)
> Annual unemployment: 4.4% (tied — 20st lowest)
> Poverty rate: 11.7% (16th lowest)
> Life expectancy at birth: 78.8 years (24th shortest)
Generally, a growing population is indicative of favorable conditions in a state. Delaware’s 11.6% population growth over the last 10 years outpaced the national population growth rate of 7.9%. A rapidly growing population is often indicative of high levels of prosperity, robust employment growth, or other factors that reflect a high quality of life. Delaware, however, tends to rank neither particularly strong nor unusually weak in many measures that tend to correlate with population growth. For example, Delaware’s unemployment rate of 4.4% is just slightly lower than the national rate of 4.9%.
Delaware is not middle of the road in every measure, however. Its median household income of $61,757 is over $4,100 higher than the national figure. The state’s issues with crime balance out its high income for this rank. The state’s violent crime rate of 509 incidents per 100,000 residents is ninth highest of all states.
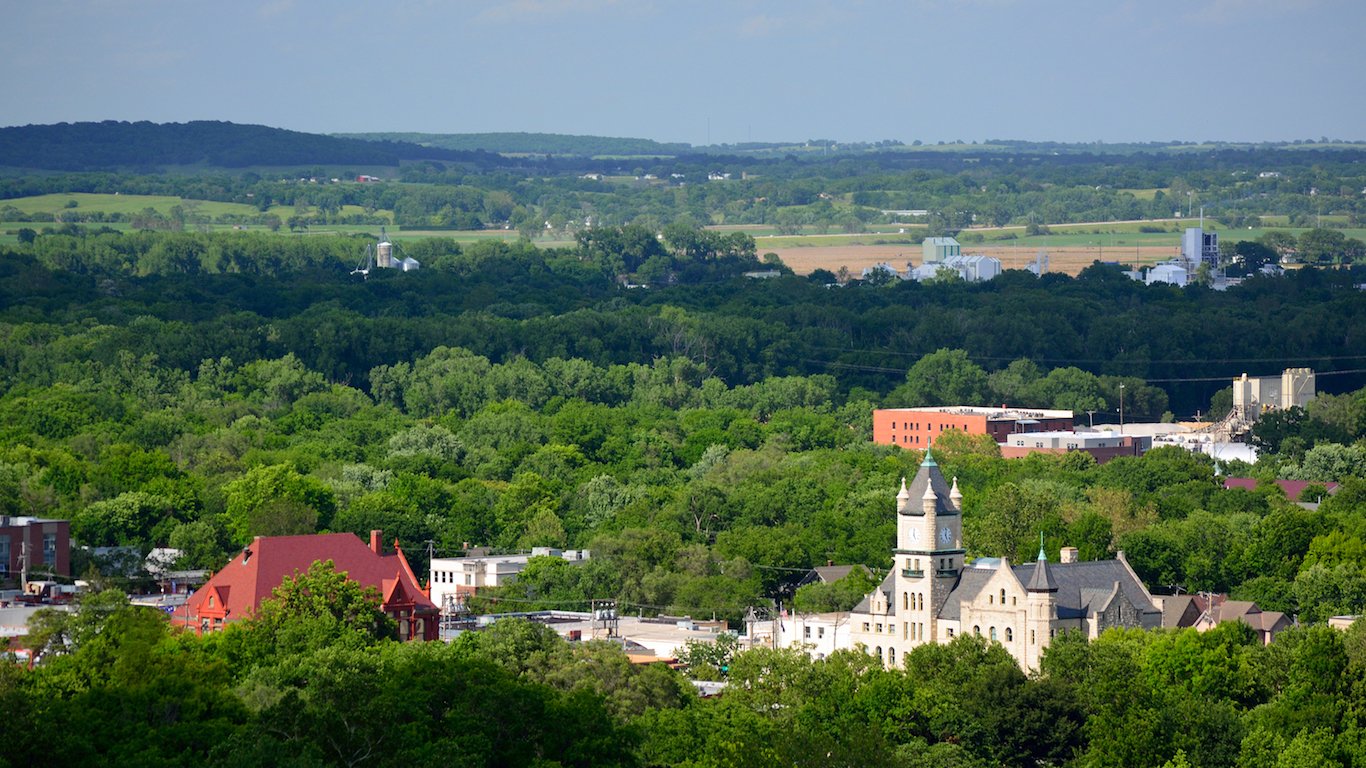
Source: Jeff Zehnder / Shutterstock.com
22. Kansas
> 10-yr. population change: +5.2% (15th smallest increase)
> Annual unemployment: 4.2% (18th lowest)
> Poverty rate: 12.1% (20th lowest)
> Life expectancy at birth: 78.6 years (19th shortest)
Some 32.8% of adults in Kansas have at least a bachelor’s degree, a higher share than the 31.3% of American adults and the third highest share of any Midwest state. Better-educated populations are often more resistant to financial hardship, and the Kansas population is no exception. Only 12.1% of the state’s population lives on poverty level incomes, versus the 14.0% share of Americans nationwide. Strong employment figures are a boon for state residents. Only 4.2% of workers in Kansas were out of a job in 2016. In comparison, the annual U.S. unemployment rate was 4.9%.
Higher incomes and low unemployment and poverty often correlate with better health outcomes, and all of these factors can affect how likely residents are to make healthy choices and to have access to quality care. In Kansas, however, the population appears to be slightly less healthy than the typical American. The state’s premature age-adjusted mortality and preventable hospitalization rates are each is slightly higher than that of the nation.
[in-text-ad-2]
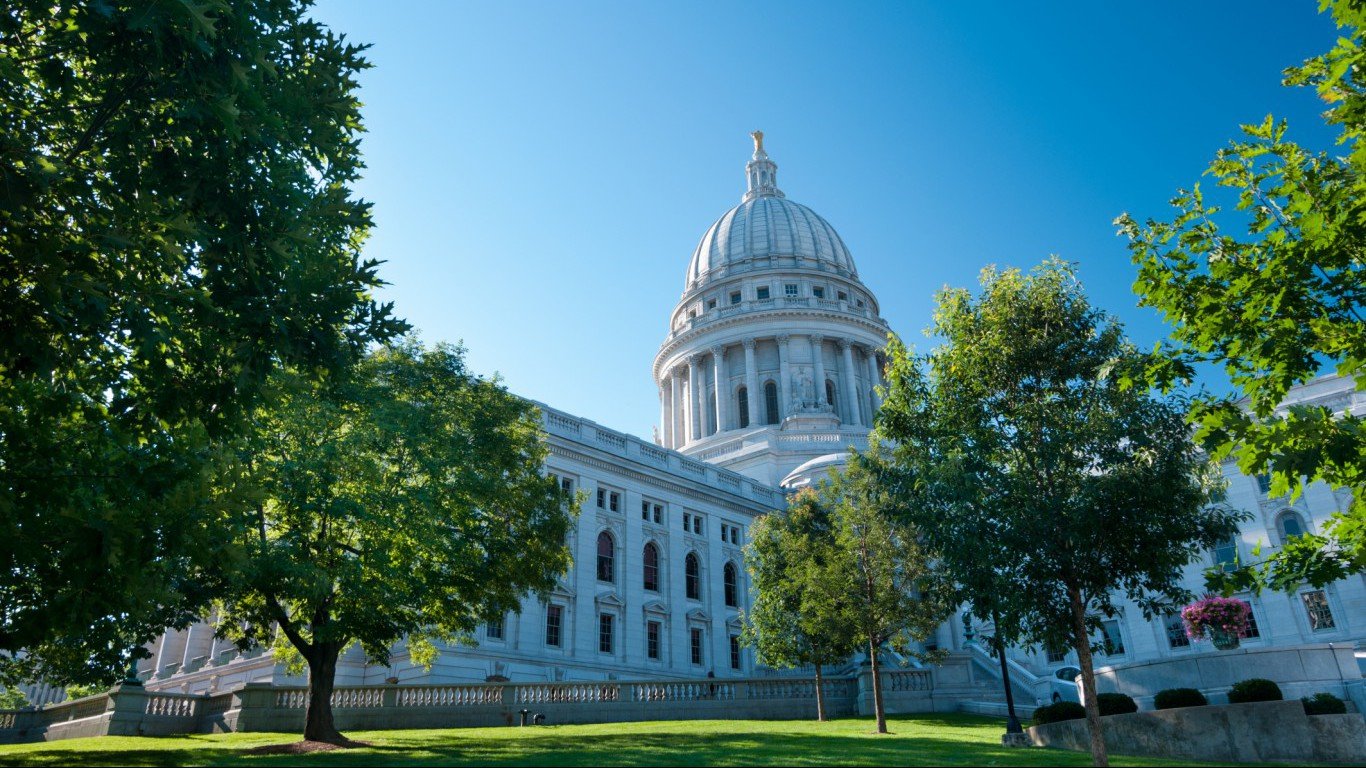
Source: Thinkstock
21. Wisconsin
> 10-yr. population change: +4.0% (11th smallest increase)
> Annual unemployment: 4.1% (tied — 16th lowest)
> Poverty rate: 11.8% (tied — 18th lowest)
> Life expectancy at birth: 79.6 years (15th longest)
Approximately 1 in every 4 adults in Wisconsin drink excessively, the second highest alcohol abuse rate of any state. However, drinking seems to be the main unhealthy habit, as adults in the state are less likely to smoke and more likely to get regular physical exercise than the typical American. Likely partly as a result, life expectancy in Wisconsin is 79.6 years at birth, higher than the U.S. average life expectancy of 78.9 years. State residents also benefit from lower than typical crime rates, poverty, and unemployment.
Despite a range of favorable socioeconomic measures, Wisconsin does not appear be attracting many new residents. Over the past decade, the state’s population expanded by only 4.0%, slower than the U.S. population growth of 7.9% over that time.
Source: Thinkstock
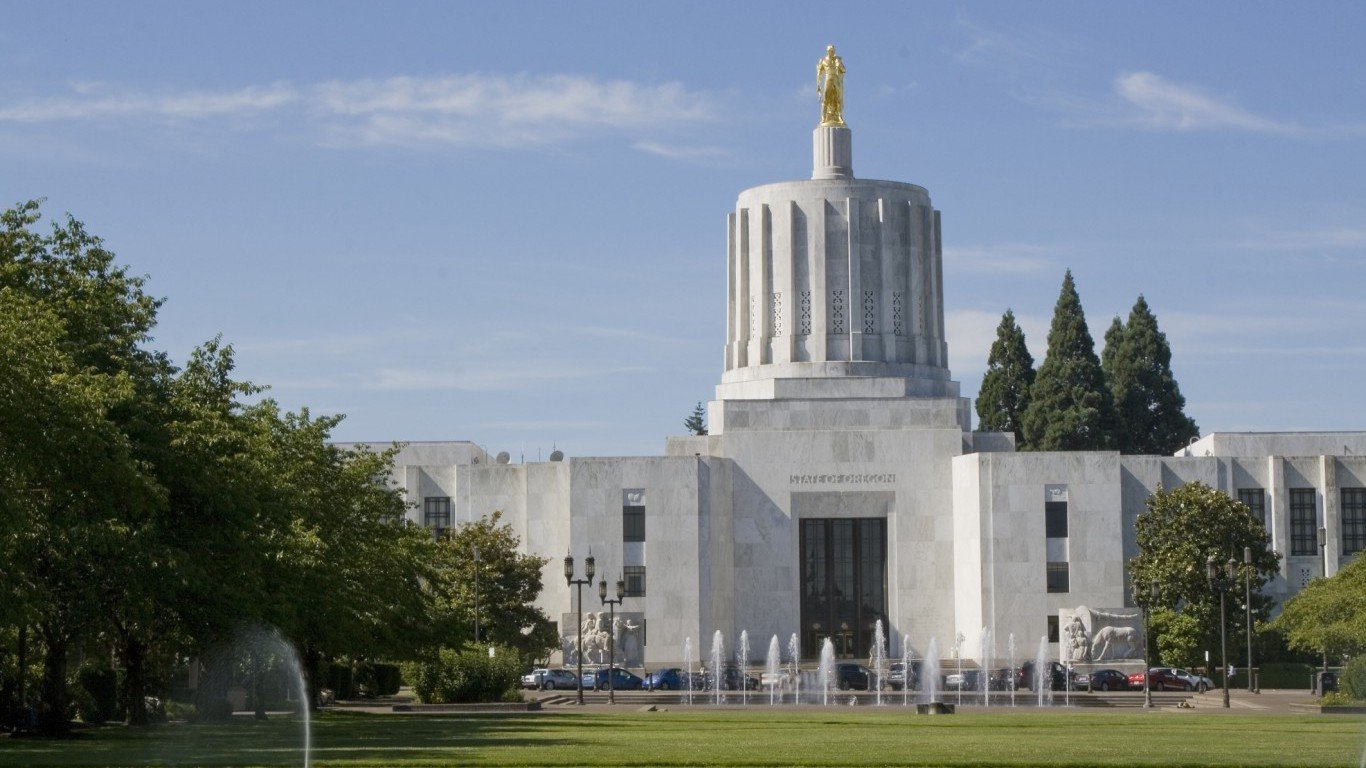
20. Oregon
> 10-yr. population change: +10.6% (17th largest increase)
> Annual unemployment: 4.9% (tied — 20th highest)
> Poverty rate: 13.3% (tied — 24th highest)
> Life expectancy at birth: 79.5 years (17th longest)
Oregon’s population is among the most likely in the country to feel unwell. State residents report feeling physically unwell an average of 4.4 days every month, and say they feel mentally unhealthy 4.6 days a month. These are the sixth and third most unhealthy days, respectively, in the country. Still, state residents have among the easiest access to care. The state has among the highest concentrations of primary care physicians, dentists, and mental health providers of any state.
Crime conditions in the state are somewhat uneven. The state’s violent crime rate of 264 incidents for every 100,000 residents is below average, while the property crime rate of nearly 3,000 cases per 100,000 people annually is well above the national average.
[in-text-ad]

Source: Thinkstock
19. Illinois
> 10-yr. population change: -0.2% (3rd largest decline)
> Annual unemployment: 5.9% (6th highest)
> Poverty rate: 13.0% (24th lowest)
> Life expectancy at birth: 79.2 years (24th longest)
Adults in Illinois are more likely to have a bachelor’s degree than the typical American adult. Additionally, state residents are less likely to live in poverty than Americans nationwide. Despite such favorable conditions, the state’s annual jobless rate of 5.9% in 2016 was well above the nationwide 4.9% unemployment rate. Additionally, crime in parts of Chicago is far higher than average, contributing to the state’s higher than average violent crime rate of 436 incidents per 100,000 residents.
The high crime and unemployment levels may be driving people out of the state. Over the past decade, the state’s population contracted by 0.2%, making Illinois one of only a handful of states to report a 10-year net population decline.

Source: Thinkstock
18. Alaska
> 10-yr. population change: +10.7% (15th largest increase)
> Annual unemployment: 6.6% (2nd highest)
> Poverty rate: 9.9% (tied — 6th lowest)
> Life expectancy at birth: 78.8 years (23rd shortest)
High household wealth can positively affect quality of life in an area, and Alaska is one of the most affluent states in the country. The typical household earns $76,440 a year, second in the country only to Maryland. Other factors also speak to high livability in the state, including a low poverty rate as well as high levels of physical activity among residents.
However, Alaska not only falls short in other measures on this list, but ranks among the worst. Of perhaps greatest concern are the state’s crime rates — Alaska has the third highest property crime rate and the highest violent crime rate, at 3,353 and 804 incidents per 100,000 residents, respectively. The premature death rate in the state is higher than that of the nation. Alaska also has the second highest annual unemployment rate in the country, at 6.6%.
Source: Thinkstock
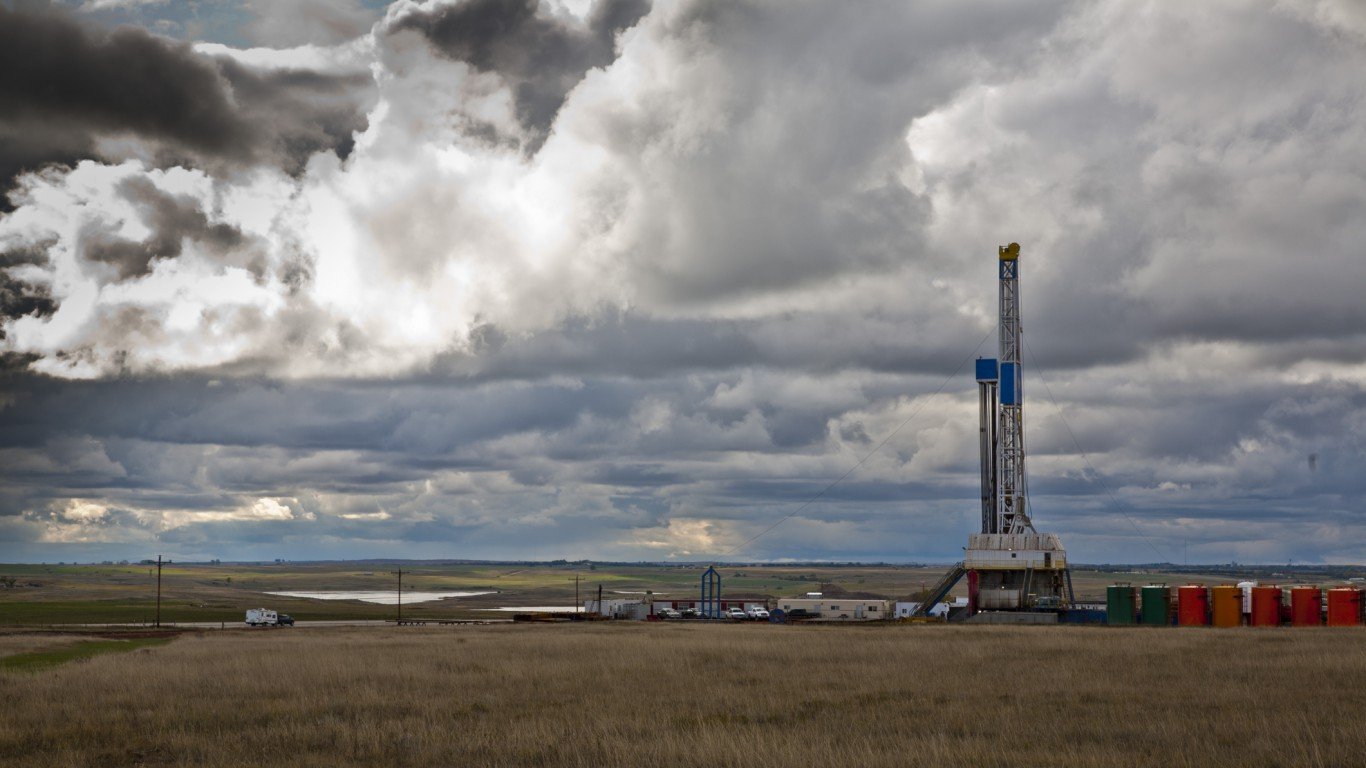
17. North Dakota
> 10-yr. population change: +19.2% (2nd largest increase)
> Annual unemployment: 3.2% (tied — 4th lowest)
> Poverty rate: 10.7% (10th lowest)
> Life expectancy at birth: 79.5 years (18th longest)
North Dakota is the fastest growing state in the country after only Utah. In the last decade, North Dakota’s population expanded by 19.2%, more than double the U.S. population growth of 7.9% over the same period. The state’s strong population growth can largely be ascribed to a strong job market, which has been boosted by the state’s recent energy boom. Only 2.4% of the state’s labor force were out of a job in September, the lowest unemployment rate of any state. Strong economic conditions in the state have led to widespread financial prosperity. The typical household in North Dakota earns $60,656 annually, for example, about $3,000 more than the typical American household.
On the other hand, the state may have an alcohol problem. Approximately 25% of adults report regular, excessive drinking, the highest percentage of all states.
[in-text-ad-2]
Source: Thinkstock
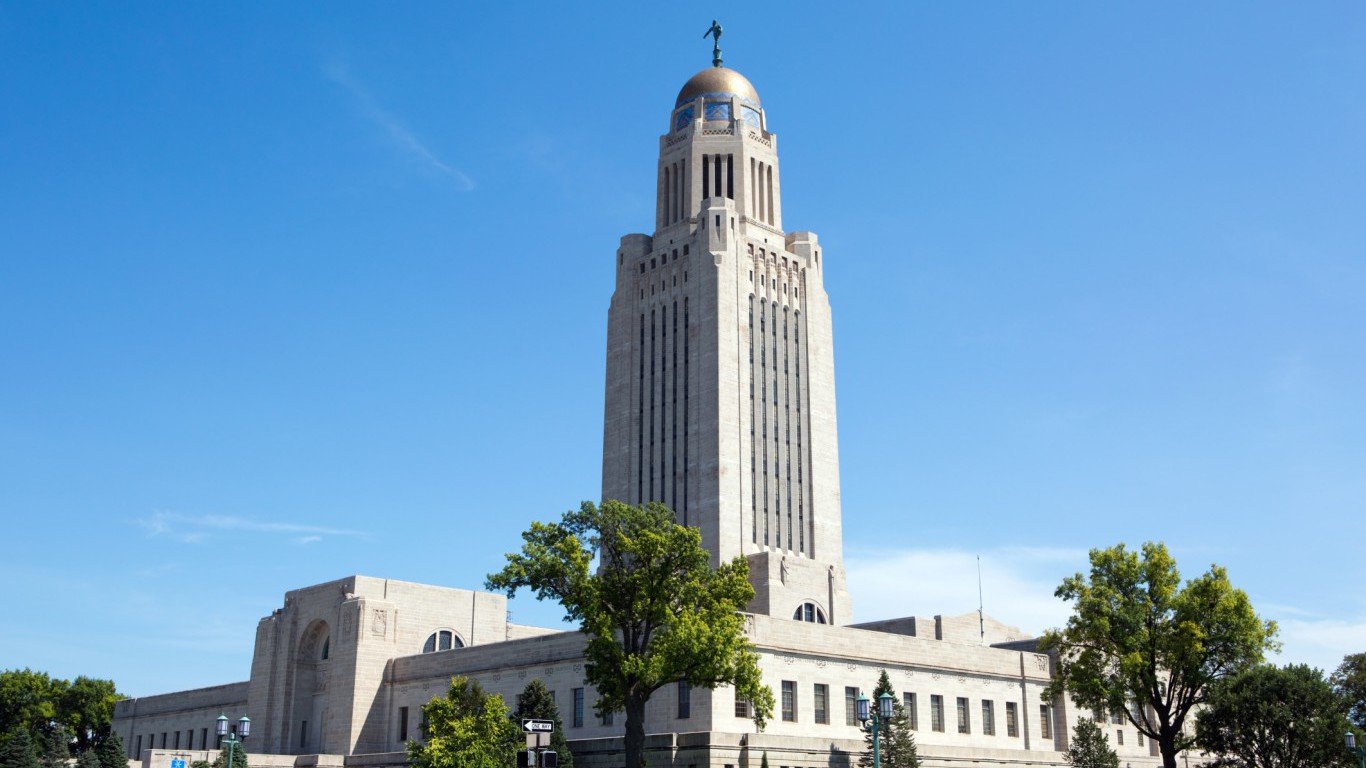
16. Nebraska
> 10-yr. population change: +7.8% (24th smallest increase)
> Annual unemployment: 3.2% (tied — 4th lowest)
> Poverty rate: 11.4% (15th lowest)
> Life expectancy at birth: 79.5 years (20th longest)
Steady employment is essential to maintaining a minimum standard quality of life. In 2016, just 3.2% of Nebraska’s labor force was looking for a job, tied for the fourth lowest annual jobless rate among states. Compared to most of the states that rank as better places to live, goods and services are also relatively inexpensive in the state, costing 91 cents on the dollar on average compared to prices nationwide.
Nebraskans also happen to feel healthier than residents of most states. On average, state residents report feeling physically unwell 3 days a month and feeling mentally unwell a similar amount, the fifth and third lowest periods nationwide, respectively. Other health metrics point to potential problems. More than 20% of adults drink excessively, for example, which could contribute to the relatively high alcohol-related driving fatality rate. More than 35% of driving deaths in the state involve alcohol, the ninth highest percentage of all states.
Source: Thinkstock
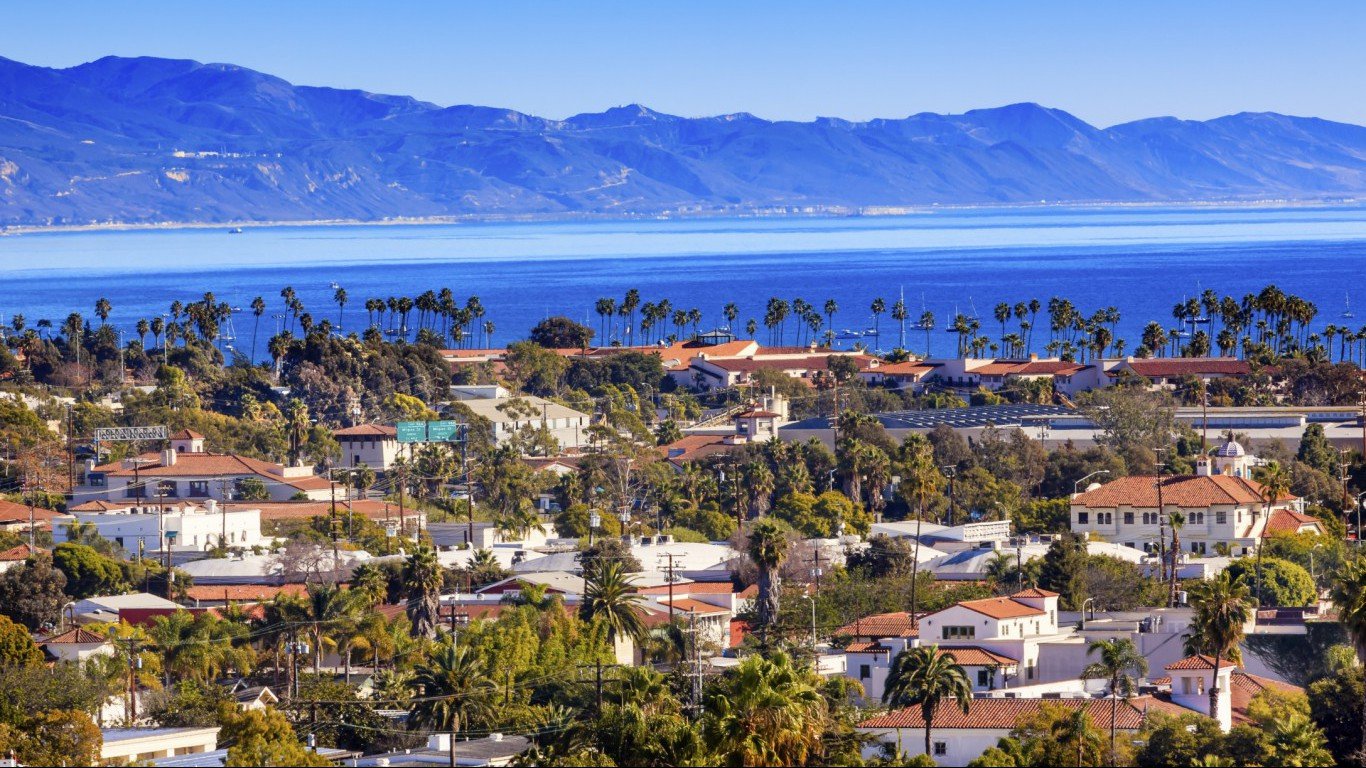
15. California
> 10-yr. population change: +7.7% (23rd smallest increase)
> Annual unemployment: 5.4% (tied — 9th highest)
> Poverty rate: 14.3% (20th highest)
> Life expectancy at birth: 80.9 years (2nd longest)
Life expectancy at birth is 80.9 years in California, the longest of any state with the exception of Hawaii. Long lives in the state are largely the product of healthy lifestyles. Adults in California are more likely to be physically active and less likely to be obese than the typical American adult. Amenities in the state support healthy lifestyles. Nearly 94% of the state’s population has easy access to venues for physical activity like parks and recreation centers — the fourth largest share among states.
The most populous state in the country, the social and economic picture in California is especially complex. Though a larger than typical share of adults in the state have at least a bachelor’s degree at 32.9%, only 82.4% of adults have a high school diploma, the smallest share of any state. California also struggles with higher than average unemployment and crime rates.
[in-text-ad]
Source: Thinkstock
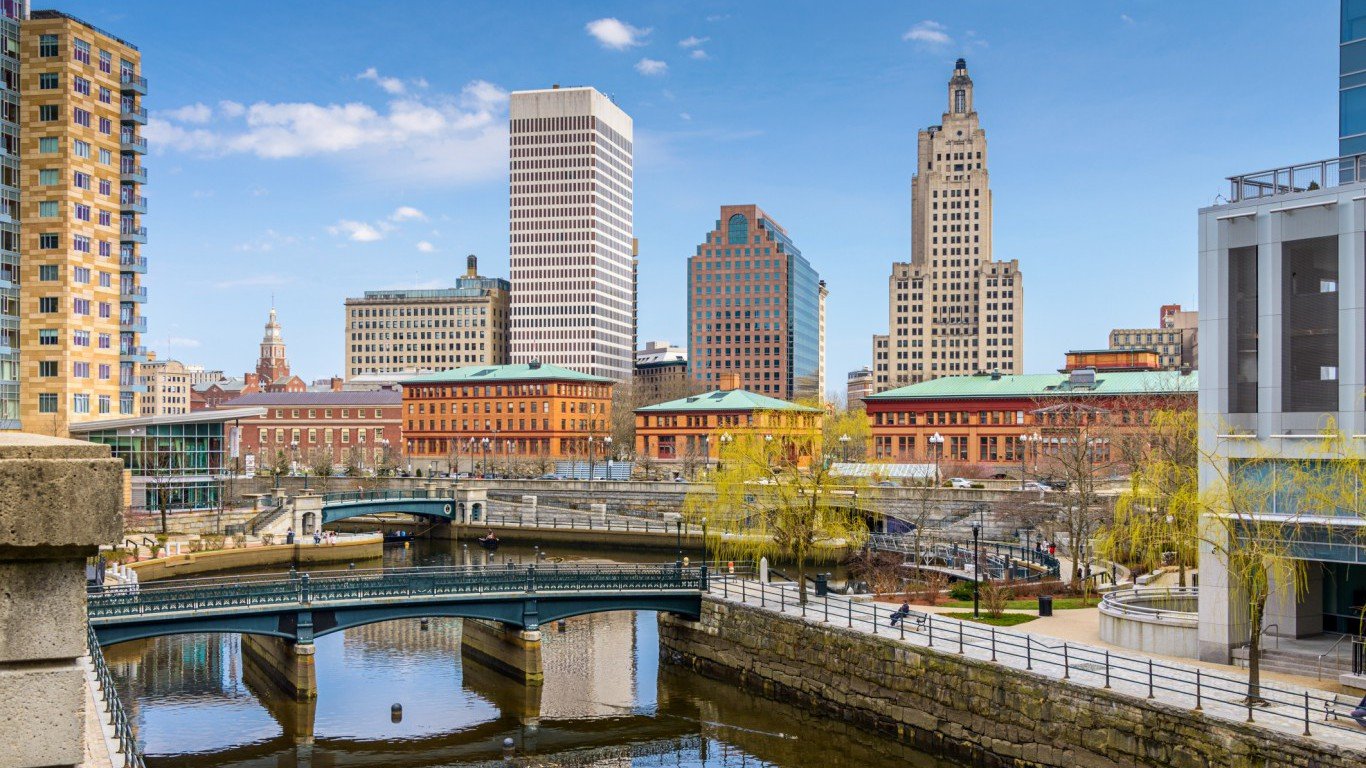
14. Rhode Island
> 10-yr. population change: -1.0% (2nd largest decline)
> Annual unemployment: 5.3% (tied — 13th highest)
> Poverty rate: 12.8% (22nd lowest)
> Life expectancy at birth: 79.7 years (14th longest)
While it ranks as one of the better states to live, Rhode Island is far from perfect. For example, it has the highest annual unemployment rate in New England at 5.3%, which is higher than the national unemployment rate of 4.9%. Also, the state’s population has actually declined by 1% over a 10-year period. Rhode Island is one of just two states to lose people over the past decade, even as the national population increased by 7.9%.
There are, however, aspects of the state’s quality of life that make up for its shortcomings. For example, Rhode Islanders are less likely to die prematurely and more likely to earn more than the typical American. Goods and services in the state are also less expensive than average prices nationwide.

Source: Thinkstock
13. New York
> 10-yr. population change: +2.3% (7th smallest increase)
> Annual unemployment: 4.8% (tied — 24th highest)
> Poverty rate: 14.7% (tied — 16th highest)
> Life expectancy at birth: 80.5 years (6th longest)
New York may be a great place to live for many, but the quality of life varies considerably in the state at least by one important measure — income. Those in the 80th percentile of income in the state earn 5.6 times the income those in the 20th percentile in the state earn. This is the second highest level of income inequality in the country. The state also has a poverty rate of 14.7%, the highest of any state on this half of the list.
For those who do not live in poverty, New York appears to offer a relatively high quality of life. The typical household earns about $5,000 more than the typical American household. New York also has a high bachelor’s degree attainment rate among adults and nearly the longest life expectancy of any state population.

Source: Thinkstock
12. Utah
> 10-yr. population change: +19.7% (the largest increase)
> Annual unemployment: 3.4% (8th lowest)
> Poverty rate: 10.2% (7th lowest)
> Life expectancy at birth: 79.9 years (11th longest)
Over the past decade, Utah’s population expanded by 19.7%, the largest growth of any state. Many Americans move to where they can find work, and Utah’s strong economy may help explain the influx of new residents. The state’s annual unemployment rate of 3.4% ranks among the lowest nationwide, and many of those working in the state are well compensated. The typical household in Utah earns $65,977 a year, about $8,400 more than the typical American household. Additionally, only 10.2% of Utah’s residents live in poverty, well below the 14.0% U.S. poverty rate.
Raising children as a single parent can increase the risk of a range of health problems of both parent and child. In Utah, only 12.8% of children live with only one parent, nearly the smallest share of any state.
[in-text-ad-2]

Source: https://www.flickr.com/photos/mar_ibert/
11. Vermont
> 10-yr. population change: +0.1% (the smallest increase)
> Annual unemployment: 3.3% (tied — 6th lowest)
> Poverty rate: 11.9% (19th lowest)
> Life expectancy at birth: 79.8 years (12th longest)
At $57,677 a year, the median household income in Vermont is roughly in line with the median income nationwide. Though incomes are comparable, Vermonters are far less likely than most Americans to face serious financial hardship. An estimated 11.9% of Vermont residents live in poverty, a smaller share than the 14.0% share of Americans.
Better-educated populations are less likely to struggle financially, and In Vermont, 36.4% of adults have earned a bachelor’s degree and 92.1% have completed college — each among the 10 highest comparable attainment rates of any state. Vermont residents also benefit from low unemployment and low crime rates.

Source: Gary Paulson / Flickr
10. Washington
> 10-yr. population change: +13.9% (9th largest increase)
> Annual unemployment: 5.4% (tied — 9th highest)
> Poverty rate: 11.3% (tied — 14th lowest)
> Life expectancy at birth: 80.2 years (9th longest)
An estimated 35.1% of adults in Washington state have a bachelor’s degree, well above the 31.3% share of American adults. Better-educated populations tend to work in higher-paying jobs, and the typical household in Washington earns $67,106 a year, nearly $10,000 more than the median income nationwide. Americans with higher incomes can afford healthier lifestyles and often live longer as a result. Life expectancy at birth in Washington is 80.2 years, over a year longer than life expectancy nationwide.
As is the case with most of the top ranking states, Washington residents have greater access to parks, recreation centers, and gyms than most Americans. An estimated 88.2% of Washington residents have easy access to venues for physical activity compared to only 84.0% of Americans.
[in-text-ad]
Source: Thinkstock
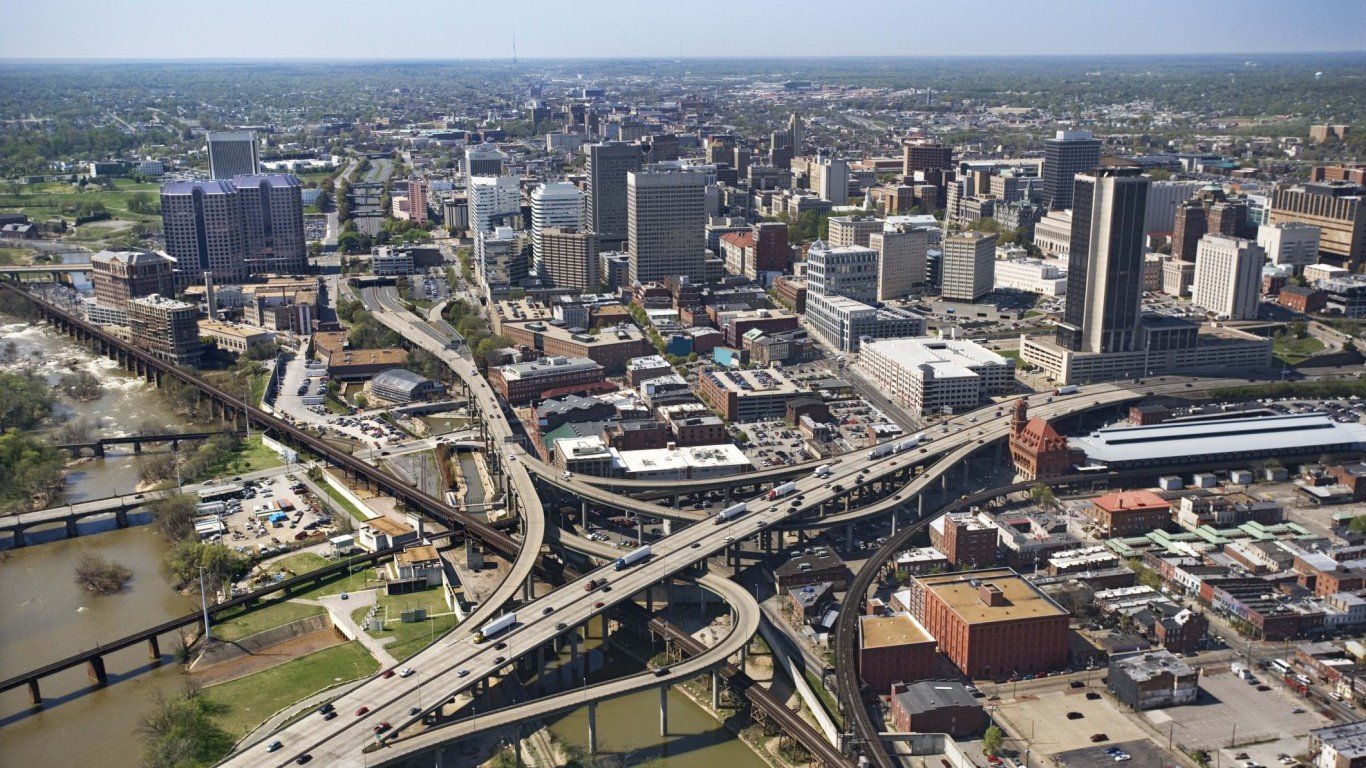
9. Virginia
> 10-yr. population change: +10.1% (21st largest increase)
> Annual unemployment: 4.0% (tied — 14th lowest)
> Poverty rate: 11.0% (tied — 12th lowest)
> Life expectancy at birth: 79.1 years (25th shortest)
Problems with crime tend to be local rather than statewide, but across Virginia crime tends to be low and the state is relatively crime free compared to most of the country. There were just 217 violent crimes reported in the state for every 100,000 residents, nearly half the national figure of 397 incidents per 100,000 people.
Virginians are also among the most likely to have a college degree, which often results in higher incomes and better quality of life across a population. Just over 38% of Virginia adults have a bachelor’s degree, compared to 31.3% of adults nationwide. This high educational attainment rate may help explain Virginia’s relatively low unemployment rate. Last year, average unemployment was 4.0%, well below the national average rate of 4.9%.

Source: https://www.flickr.com/photos/kenlund/
8. Hawaii
> 10-yr. population change: +11.1% (14th largest increase)
> Annual unemployment: 3.0% (3rd lowest)
> Poverty rate: 9.3% (2nd lowest)
> Life expectancy at birth: 81.2 years (the longest)
By many social and economic measures, Hawaii is one of the best places to live in the United States. The state’s poverty rate of just 9.3% is the second lowest in the country, and the median household income of $74,511 a year is about $16,900 higher than the national median. Of course, goods and services are also quite expensive in the state, but unlike other states with high costs of living, the state has relatively low income inequality. The state also has the second highest health insurance coverage rate of all states. Just 3.4% of Hawaiians are without health insurance, compared to 8.5% of Americans.
Beyond the measures considered here, many Hawaiian residents and visitors would likely contend that the state is a pleasant place to live due to its climate. The average monthly temperature is lowest in January, at 73 degrees.
Source: Thinkstock
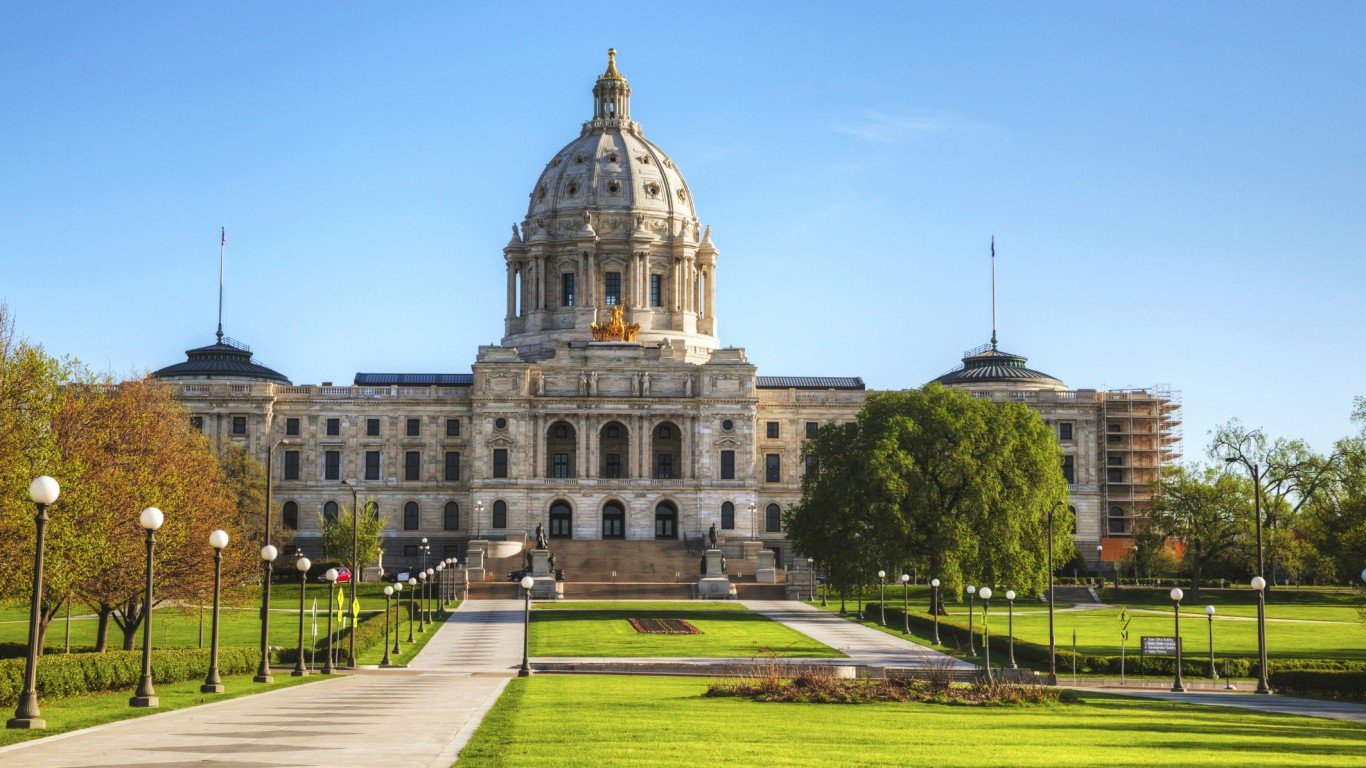
7. Minnesota
> 10-yr. population change: +6.8% (21st smallest increase)
> Annual unemployment: 3.9% (tied — 12th lowest)
> Poverty rate: 9.9% (tied — 6th lowest)
> Life expectancy at birth: 80.7 years (4th longest)
In measures of both behaviors and outcomes, Minnesota is one of the healthiest states in the country. Minnesota has the lowest premature death rate of any state and one of the most physically active populations. With generally healthy lifestyles and relatively uncommon premature death, Minnesota’s life expectancy at birth of 80.7 year is higher than in all but three other states and nearly two years longer than U.S. life expectancy.
Healthy lifestyles in the state are bolstered by relative financial security. The typical household in Minnesota earns $65,599 a year, about $8,000 more than the typical American household. Additionally, the state is one of only six in which fewer than 1 in 10 residents live in poverty.
[in-text-ad-2]

Source: Thinkstock
6. Maryland
> 10-yr. population change: +7.1% (22nd smallest increase)
> Annual unemployment: 4.3% (19th lowest)
> Poverty rate: 9.7% (3rd lowest)
> Life expectancy at birth: 79.3 years (22nd longest)
The typical Maryland household earns $78,945 a year, the highest median income of any state and about $21,300 more than the typical American household income. The higher incomes translate to a relative lack of serious financial hardship in the state — Maryland is one of only six states in which fewer than 1 in 10 residents live in poverty. The higher incomes also mean more Maryland residents can afford healthy diets and lifestyles, and the state’s life expectancy of 79.3 years at birth is nearly half a year longer than life expectancy across the country as a whole.
Maryland’s favorable socioeconomic outcomes are underpinned by a well-educated population. Some 39.3% of adults in the state have at least a bachelor’s degree, a larger share than in all but two other states.

Source: Thinkstock
5. New Jersey
> 10-yr. population change: +2.5% (8th smallest increase)
> Annual unemployment: 5.0% (tied — 18th highest)
> Poverty rate: 10.4% (tied — 9th lowest)
> Life expectancy at birth: 80.3 years (8th longest)
An estimated 94.5% of New Jersey residents have access to places for physical activity, the highest share of any state. There are also a relatively high number of doctors and dentists, relative to the population. In addition to being located within close proximity to health options, New Jersey residents are also more likely to be able to afford to take care of themselves. The typical state household has an income of $76,126 a year — the third highest median income among states. Such advantages partially explain why state residents tend to live long, healthy lives. Life expectancy at birth in New Jersey is 80.3 years, approximately 1.4 years longer than the country’s average life expectancy..
[in-text-ad]

Source: Thinkstock
4. Colorado
> 10-yr. population change: +16.6% (5th largest increase)
> Annual unemployment: 3.3% (tied — 6th lowest)
> Poverty rate: 11.0% (tied — 12th lowest)
> Life expectancy at birth: 80.3 years (7th longest)
Colorado ranks as the best state to live in the western United States and the fourth best nationwide. The state has a well-educated population, with a bachelor’s degree attainment rate of 39.9% is the highest in the country after only Massachusetts. Colorado’s economy is also a boon for residents. Only 2.5% of the state’s labor force was out of work in September, the second lowest unemployment rate of any state that month. The relatively low violent crime rate, in addition to a well-educated workforce, likely each have a positive effect on the state economy.
People appear to be flocking to Colorado. In the last decade, the state’s population expanded by 16.6%, one of the most significant increases of any state, and more than double the U.S. population growth of 7.9% over the same time.
Source: https://www.flickr.com/photos/dougtone/
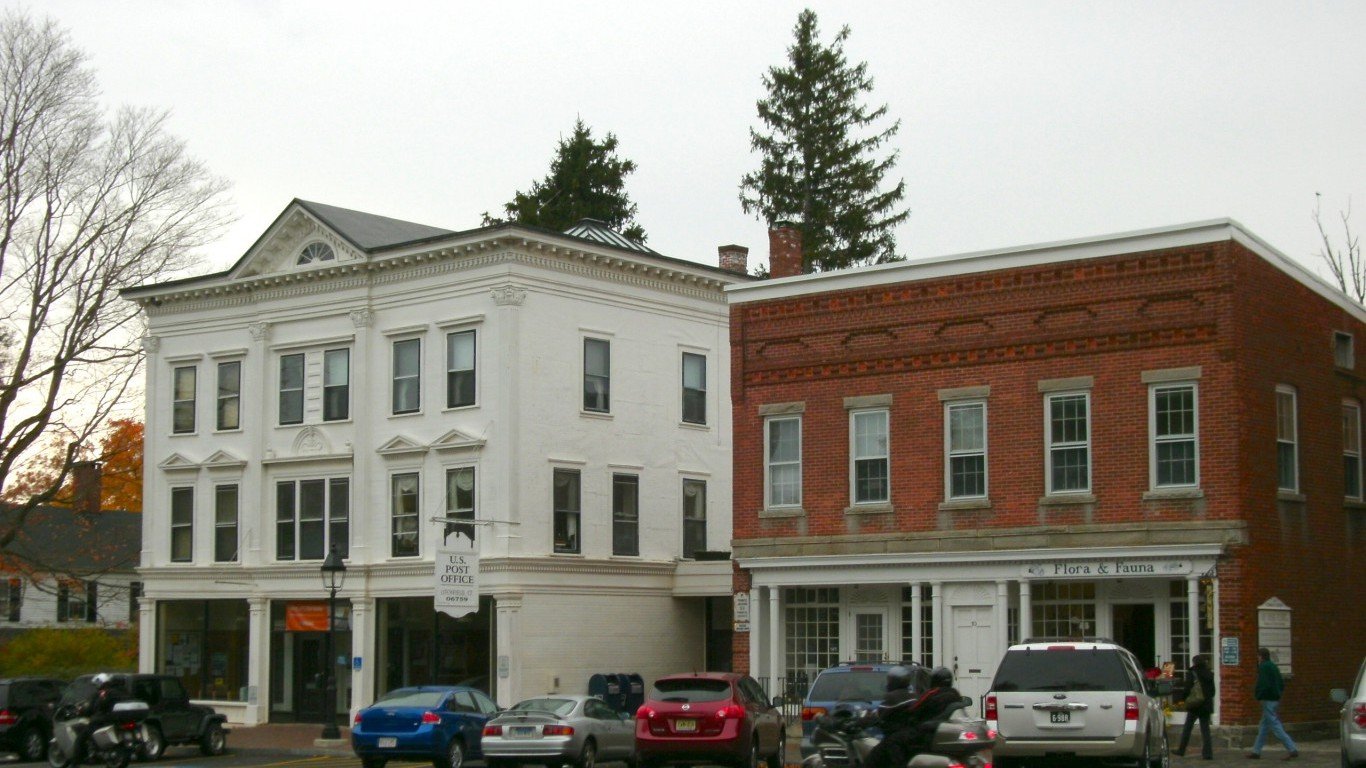
3. Connecticut
> 10-yr. population change: +2.0% (6th smallest increase)
> Annual unemployment: 5.1% (tied — 16th highest)
> Poverty rate: 9.8% (4th lowest)
> Life expectancy at birth: 80.8 years (3rd longest)
Longevity is determined by many factors, but it is a good sign for quality of life. Connecticut’s population can expect to live an average of 80.8 years, the third longest life expectancy after California and Hawaii. Residents with higher incomes are more likely to have access to healthy activities and food, and better health care. In Connecticut, the median household income of $73,433 a year the third highest of any state, which might help explain the state’s long-lived population.
Connecticut also has a relatively high rate of health insurance coverage, as well as the fifth lowest violent crime rate in the country.

Source: Thinkstock
2. New Hampshire
> 10-yr. population change: +1.5% (5th smallest increase)
> Annual unemployment: 2.8% (tied — the lowest)
> Poverty rate: 7.3% (the lowest)
> Life expectancy at birth: 80.1 years (10th longest)
New Hampshire is perhaps the most crime-free state. Nationwide, there were 397 violent crimes and 2,450 property crimes per 100,000 people. In New Hampshire, there were just 198 violent crimes and 1,513 property crimes per 100,000 people.
The state’s job market is also one of the healthiest in the country. New Hampshire’s annual unemployment rate of 2.8% in 2016 is tied with South Dakota for the lowest of all states. People who are out of work are among the most likely to earn below poverty level incomes, so New Hampshire’s healthy job market may help explain its nation-low poverty rate of 7.3%. That figure is nearly half the national poverty rate of 14.0%.
[in-text-ad-2]

Source: https://www.flickr.com/photos/masstravel/
1. Massachusetts
> 10-yr. population change: +5.8% (18th smallest increase)
> Annual unemployment: 3.7% (tied — 9th lowest)
> Poverty rate: 10.4% (tied — 9th lowest)
> Life expectancy at birth: 80.7 years (5th longest)
Having health insurance coverage has been shown to have a wide range of positive effects, including reducing stress, and in Massachusetts, thanks to the state’s groundbreaking health care system, a nation-leading 97.5% of state residents have health insurance compared to 91.5% of Americans. In addition to being more likely to be able to afford health care, state residents are more likely to be able to find the right kind of care near them. The state has the most primary care physicians, dentists, and mental health providers per capita in the country.
Massachusetts also leads the nation in another important measure of quality of life — college attainment. About 43% of state adults have a bachelor’s degree, more than 10 percentage points above the national attainment rate. A college degree has been shown to have many benefits, both on the likelihood of finding a good job and high wages, as well as in giving people a sense of control and purpose in their lives.
Detailed Findings & Methodology
While money does not buy happiness, it helps improve quality of life, up to a point. A steady income well above the poverty level helps buy healthier food, better housing, time for leisure activities, and more. Most of the states that rank higher in other measures of quality of life, including health outcomes, tend to have higher median incomes and lower poverty.
There are some exceptions, however. High-ranked states like New York and Connecticut have high median household incomes as well as good outcomes across a variety of measures, but also high poverty rates and income inequality. These states are good places to live — as long as you aren’t one of the many who live in poverty.
Education levels are another major indicator of a community’s living conditions. Individuals with a college education tend to live longer and earn higher incomes, which contributes to a more stable economy and overall improved quality of life. In general, areas with higher educational attainment rates tend to have higher incomes.
Some of the measures considered for this piece, such as health outcomes and obesity, they also reflect quality of life in a state of a state that relate to these outcomes. For example, many of the states with high life expectancy and good physical and mental well-being also tend to have high rates of health insurance coverage as well as many doctors, dentists, and mental health practitioners.
To identify the best and worst states in which to live, 24/7 Wall St. constructed an index composed of three socioeconomic measures for each state: poverty rate, the percentage of adults who have at least a bachelor’s degree, and life expectancy at birth. The selection of these three measures was inspired by the United Nations’ Human Development Index. Poverty rates and bachelor attainment rates data came from the U.S. Census Bureau’s 2016 American Community Survey. Life expectancies at birth are from the Centers for Disease Control and Prevention and are as of 2013, latest year for which data is available. Unemployment rates are from the Bureau of Labor Statistics and are for the year of 2016.
Sponsored: Find a Qualified Financial Advisor
Finding a qualified financial advisor doesn’t have to be hard. SmartAsset’s free tool matches you with up to 3 fiduciary financial advisors in your area in 5 minutes. Each advisor has been vetted by SmartAsset and is held to a fiduciary standard to act in your best interests. If you’re ready to be matched with local advisors that can help you achieve your financial goals, get started now.
Thank you for reading! Have some feedback for us?
Contact the 24/7 Wall St. editorial team.
Editors' Picks

