Special Report
Best States for a Healthy Retirement
Published:
Last Updated:

As baby boomers age, senior retirees will become an increasingly larger part of the U.S. population. But not every state is an equally healthy place for senior citizens. The Centers for Disease Control and Prevention’s report “The State of Aging and Health in America” breaks down the various factors that reflect health of senior citizens in the United States.
24/7 Wall St. reviewed the indicators considered in the CDC’s report. The indicators include behaviors that affect senior health such as smoking and healthy eating, preventative measures such as screening and vaccination, and health outcomes such as the prevalence of dementia and disability. We compared every U.S. state based on these key indicators of senior health to determine which states are the best, and which are the worst, for a healthy retirement.
Click here to see how all 50 states compare in the health of their retirees.
Click here to see detailed findings and methodology.

50. Arkansas
> Pct. 65+ with a disability: 42.4%
> Pct. 65+ obese: 29.8%
> Flu vaccine in the past year, 65+: 59.4%
> Life expectancy: 75.8 years
Arkansas seniors are likely to struggle with many significant health factors more than seniors in almost any other state. Some 42.4% of the 65 and older in the state lives with a disability, the third highest percentage among all states.
More than 40% of seniors do not get enough physical activity, and 15.5% of older adults suffer from from symptoms of dementia, such as increased confusion or memory loss, the fourth and second highest shares of all states, respectively.
[in-text-ad]
49. Mississippi
> Pct. 65+ with a disability: 41.4%
> Pct. 65+ obese: 30.8%
> Flu vaccine in the past year, 65+: 63.3%
> Life expectancy: 74.8 years
At 74.8 years, Mississippi has the lowest average life expectancy in the nation. The average life expectancy for men is just 71.8 years, also last. Less than half of Mississippi seniors have all their natural teeth, compared to the national average is 62.4%.
Unsurprisingly, seniors in the state are more likely to feel unwell compared to their contemporaries in other parts of the country. Some 37.2% of 65 and older residents rated their health between fair and poor, the highest percentage of all states.

48. Alaska
> Pct. 65+ with a disability: 41.3%
> Pct. 65+ obese: 34.7%
> Flu vaccine in the past year, 65+: 54.7%
> Life expectancy: 78.8 years
Though Alaska ranks as the third worst state for a healthy retirement, it actually has a lot of seniors still in the workforce. Nearly a quarter of Alaskans who are 65 and older are employed, compared to 17% of U.S. seniors overall.
While many Alaskan seniors continue to work and earn incomes, Alaska nevertheless has the highest percentage of seniors who use cash public assistance. Some 9.7% of 65 and older households use the program, more than five times the nationwide share of 1.8% and more than triple the nearest state’s participation rate.

47. Louisiana
> Pct. 65+ with a disability: 43.1%
> Pct. 65+ obese: 33.6%
> Flu vaccine in the past year, 65+: 59.1%
> Life expectancy: 75.8 years
Louisiana seniors face many significant health struggles. Some 10.4% of the state’s elderly population suffers frequent mental distress, the highest share of all states, The CDC defines frequent mental distress as 14 to 30 mentally unhealthy days in the past 30 days. Louisiana also leads the nation in the percentage of seniors who have had high blood pressure, and has the second highest senior obesity rate. Some 33.6% of Louisiana seniors are obese, compared to 27.5% of all U.S. seniors.
[in-text-ad-2]
46. Alabama
> Pct. 65+ with a disability: 43.6%
> Pct. 65+ obese: 30.2%
> Flu vaccine in the past year, 65+: 61.6%
> Life expectancy: 75.4 years
Alabama is ranked as the fifth worst state for a healthy retirement because of the physical and mental health issues its seniors face. Some 18.5% of seniors in the state have been diagnosed with depression, the second highest share nationwide. The state also has a greater share of its senior population living with a disability than any other state, at 43.6%. Some health problems Alabama seniors face may stem from dietary issues. The state’s seniors are some of the worst at eating the recommended amount of fruits and vegetables each day.

45. West Virginia
> Pct. 65+ with a disability: 41.7%
> Pct. 65+ obese: 30.3%
> Flu vaccine in the past year, 65+: 69.1%
> Life expectancy: 75.4 years
Getting sick is not pleasant for anyone, but illnesses such as the flu and pneumonia but illnesses such as the flu and pneumonia that are far less risky at a younger age can be life threatening for seniors. In West Virginia, the senior population gets sick more often than in any other state. State seniors average 6.8 unhealthy days per month, more than any other state.
Dental health becomes an especially great challenge as people age. Dry mouth and tooth loss can occur at a greater frequency for seniors, and West Virginia seniors also have the lowest tooth retention in the country. Only 36.6% of 65 and older residents have all their natural teeth, well below the U.S. average of 62.4% and nearly a dozen percentage points behind the next worst state, Mississippi.
[in-text-ad]

44. Indiana
> Pct. 65+ with a disability: 34.0%
> Pct. 65+ obese: 29.5%
> Flu vaccine in the past year, 65+: 61.3%
> Life expectancy: 77.3 years
People save for retirement in part so they can afford doctor visits and the best medical care. That could be a major factor in Indiana’s retiree struggles, as the state has the lowest average retirement income of any state at just $19,316 a year.
Even though it is is hugely harmful to a person’s health, smoking is more prevalent among Indiana seniors than in almost all other states. Some 10.9% of Indiana residents 65 and older smoke, compared to 8.7% of seniors nationwide.
43. Oklahoma
> Pct. 65+ with a disability: 42.3%
> Pct. 65+ obese: 28.1%
> Flu vaccine in the past year, 65+: 69.0%
> Life expectancy: 75.8 years
Of the issues facing Oklahoma’s senior citizens, mobility may be one of the most serious. Some 7.6% of the state’s 65 and older population had limited activity due to health issues in the past month, the third highest percentage in the United States.
That could be one of the reasons why 41.2% of Oklahoma seniors had no leisure time physical activity in the last month, one of the highest of all states. State seniors also struggled with mental health, as 18.5% of 65 and over residents had been diagnosed with depression, the second highest rate among states.

42. Wyoming
> Pct. 65+ with a disability: 37.5%
> Pct. 65+ obese: 27.3%
> Flu vaccine in the past year, 65+: 53.2%
> Life expectancy: 78.5 years
Preventative medicine is important for all age groups, but for the elderly, who are far more likely to become seriously ill, it is arguably even more important. Unfortunately, Wyoming’s senior population is among the least likely to receive screening deemed essential by the CDC. For example, roughly 1 of every 3 seniors in the state are not regularly screened for colorectal cancer, compared to the 1 in 4 nationwide. Also, just 69.1% of elderly women in the state had a mammogram in the past two years, one of the lowest shares of any state.
[in-text-ad-2]
41. Kentucky
> Pct. 65+ with a disability: 39.3%
> Pct. 65+ obese: 31.2%
> Flu vaccine in the past year, 65+: 67.3%
> Life expectancy: 75.8 years
Heart disease is the leading cause of death in the United States and the risk only increases as people age. Some 68.5% of Kentucky seniors have been diagnosed with high blood pressure, one of the highest rates in the country. High blood pressure increases the risk of heart attack and stroke.
One of the best ways to lower the risk of heart disease is through physical activity, though Kentucky seniors largely avoid working out. Some 42.3% of Kentuckians 65 and older did not get any leisure time physical activity in the last month, the second highest share in the nation.

40. Georgia
> Pct. 65+ with a disability: 36.8%
> Pct. 65+ obese: 29.7%
> Flu vaccine in the past year, 65+: 55.7%
> Life expectancy: 77.5 years
Benjamin Franklin once said, “An ounce of prevention is worth a pound of cure,” and the phrase still rings true, especially for seniors. But Georgia seniors are some of the least likely in the country to get their recommended preventive care. Just 36.8% of senior women and 38.4% of senior men are up-to-date with their vaccines and health care screenings. Both rates are among the lowest in the nation.
[in-text-ad]

39. Illinois
> Pct. 65+ with a disability: 34.6%
> Pct. 65+ obese: 31.3%
> Flu vaccine in the past year, 65+: 57.0%
> Life expectancy: 79.2 years
America faces a serious obesity epidemic. The condition is associated with many fatal and debilitating diseases. For the elderly, weight maintenance is important, particularly because seniors are more likely to live sedentary lifestyles, and because aging bodies naturally put on more fat. In Illinois, obesity among the elderly is an even greater problem than in most states. An estimated 31.3% of seniors in the state are obese, the fifth highest share in the nation.
State seniors, both men and women, are also among the least likely in the country to be up-to-date on CDC-recommended vaccines and screenings.
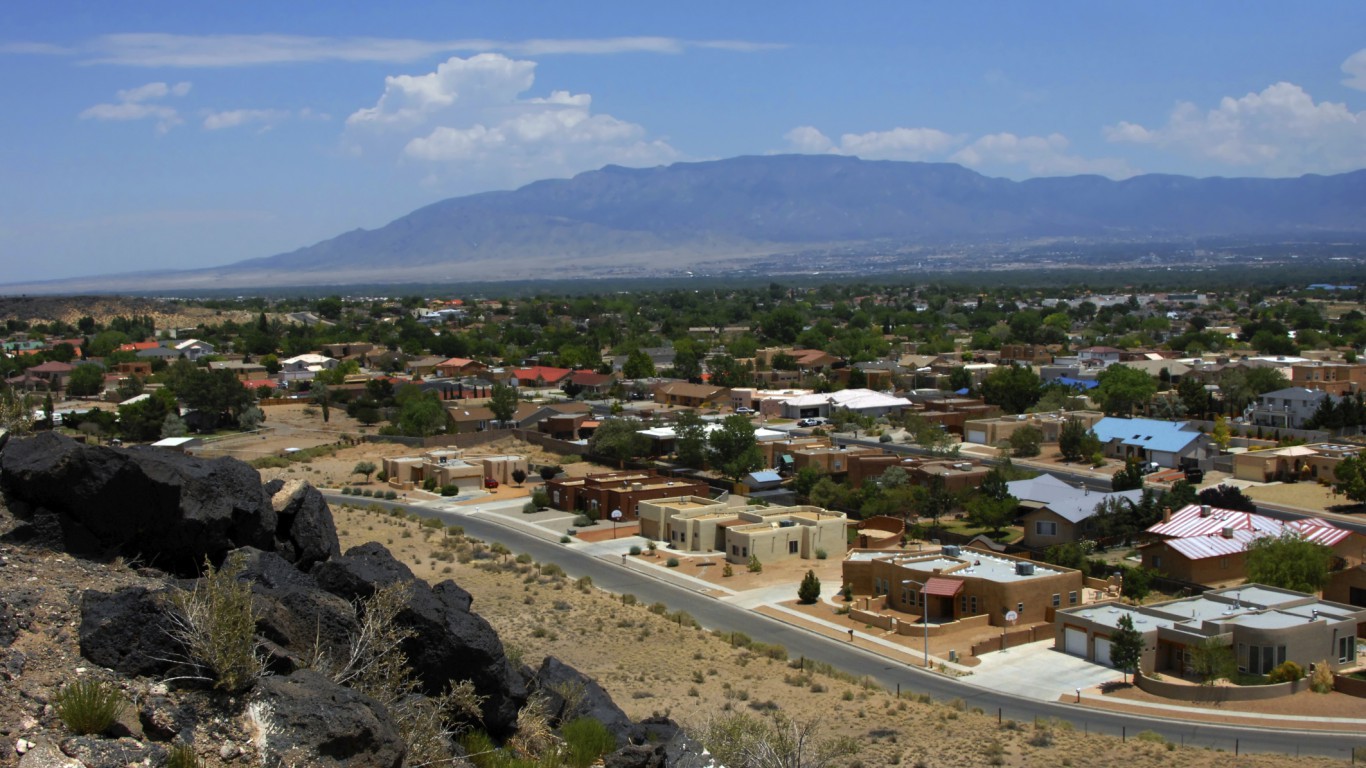
38. New Mexico
> Pct. 65+ with a disability: 40.0%
> Pct. 65+ obese: 22.3%
> Flu vaccine in the past year, 65+: 58.1%
> Life expectancy: 78.2 years
New Mexico seniors are much less likely to receive some key preventive screenings than seniors in almost every other state. Just 67.5% of senior New Mexico women had a mammogram within the past two years, a lower share than in any other state. Similarly, only 69.5% of New Mexico seniors were screened for colorectal cancer in the past two years, the second lowest share of all states and significantly lower than nationwide share across all U.S. seniors of 76%.

37. Tennessee
> Pct. 65+ with a disability: 37.1%
> Pct. 65+ obese: 27.7%
> Flu vaccine in the past year, 65+: 59.6%
> Life expectancy: 76.4 years
Some 31.0% of seniors in Tennessee said their health is between fair and poor, the seventh highest share among all states. Tennessee seniors also had some of the most unhealthy days on average among all states. The senior population was ill for an average of 6.3 days over the last month, a full day more than the national average.
[in-text-ad-2]

36. Ohio
> Pct. 65+ with a disability: 35.2%
> Pct. 65+ obese: 29.0%
> Flu vaccine in the past year, 65+: 57.7%
> Life expectancy: 77.6 years
Perhaps the most alarming health-related issue for Ohio seniors is obesity. The senior population is prone to being overweight, with 29.0% considered obese — slightly above the national obesity rate among seniors of 27.5%. One reason for the higher obesity rate could be poor eating habits. Ohio residents 65 years and over eat fewer fruits and vegetables than in most other states.
Only 36.2% of the elderly population eats at least two servings of fruit, and just 15.7% eats three servings of vegetables or more every day. Both of these figures are at least 2 percentage points below the national shares. Nutrition is a key component in maintaining a healthy weight and avoiding risk of chronic diseases such as cardiovascular disease, hypertension, and diabetes among others.

35. Nevada
> Pct. 65+ with a disability: 34.3%
> Pct. 65+ obese: 23.9%
> Flu vaccine in the past year, 65+: 54.3%
> Life expectancy: 78.2 years
Seniors in Nevada are more likely than the average U.S. senior to engage in some behaviors that can have severe health repercussions. More than 12% of Nevada seniors smoke, and 6.5% admitted to binge drinking within the last month. Both are in the top five highest shares among all states.
Making those behaviors potentially more dangerous, most Nevada seniors are not up-to-date on all of the recommended vaccines and screenings, which can lead to a variety of unwelcome health outcomes.
[in-text-ad]

34. Idaho
> Pct. 65+ with a disability: 36.5%
> Pct. 65+ obese: 27.3%
> Flu vaccine in the past year, 65+: 57.1%
> Life expectancy: 79.2 years
The 65 and older population in Idaho receives fewer preventive screenings that could help in early detection and save lives. For example, only 93.1% of seniors had their cholesterol levels checked in the past five years, the third lowest share of all states.
In addition, only 38.9% of senior women reported being up-to-date on their screenings and vaccines, well below the 42.1% nationwide. An even lower 35.3% of senior males are up-to-date on their screenings and vaccines, the second lowest share nationwide.

33. Missouri
> Pct. 65+ with a disability: 39.9%
> Pct. 65+ obese: 29.4%
> Flu vaccine in the past year, 65+: 68.5%
> Life expectancy: 77.6 years
Many seniors sustain serious injuries by falling each year. This happens more frequently in Missouri than in any other state. Some 12.9% of seniors in the state were injured due to a fall in the last year, compared to the 10.7% of seniors who were injured due to a fall nationwide.
Cigarettes are further jeopardizing the health of elderly Missourians. The state has the lowest cigarette taxes in the nation, which may help explain why 11.0% of Missouri seniors smoke, one of the highest rates nationwide.

32. New York
> Pct. 65+ with a disability: 37.1%
> Pct. 65+ obese: 24.9%
> Flu vaccine in the past year, 65+: 59.7%
> Life expectancy: 80.5 years
New Yorkers have an impressive average life expectancy of 80.5 years, the sixth highest among all the states. This may be due at least in part to the state’s relatively low obesity rate among seniors — just 24.9% of the state’s population 65 and older are considered obese, the ninth lowest share nationwide.
Still, 9.5% of this population reported feeling mentally distressed — defined by the CDC as spending 14 days or more a month in a poor mental state. Perhaps the lack of a partner is a factor in this mentally unhealthy state — only 38.9% of the 65 and older population in New York is married, the lowest percentage of all the states.
[in-text-ad-2]

31. Arizona
> Pct. 65+ with a disability: 34.0%
> Pct. 65+ obese: 24.2%
> Flu vaccine in the past year, 65+: 52.6%
> Life expectancy: 79.6 years
One of the biggest issues for Arizona seniors is preventive care. Only 52.6% of 65 and older state residents got a flu vaccine in the last year — well below the 60.5% of senior residents nationwide who received the vaccine and the second lowest share of all states.
Despite this, Arizona is one of the most popular states for retiring Americans. Some 85.3% of seniors in Arizona are out of the workforce compared to 82.4% of all U.S. seniors, possibly indicating a high share of retirees.

30. Florida
> Pct. 65+ with a disability: 33.6%
> Pct. 65+ obese: 25.8%
> Flu vaccine in the past year, 65+: 51.4%
> Life expectancy: 79.7 years
Senior residents in the Sunshine State have one of the lowest flu vaccination rates. Only 51.4% of the 65 and older population has received a flu shot within the past year, well below the national share of 60.5% and the lowest percentage of all the states. Getting the flu at a younger age is less risky than it is at an older age, when the disease can linger, be more symptomatic, and the risk of developing complications or death is greater.
[in-text-ad]
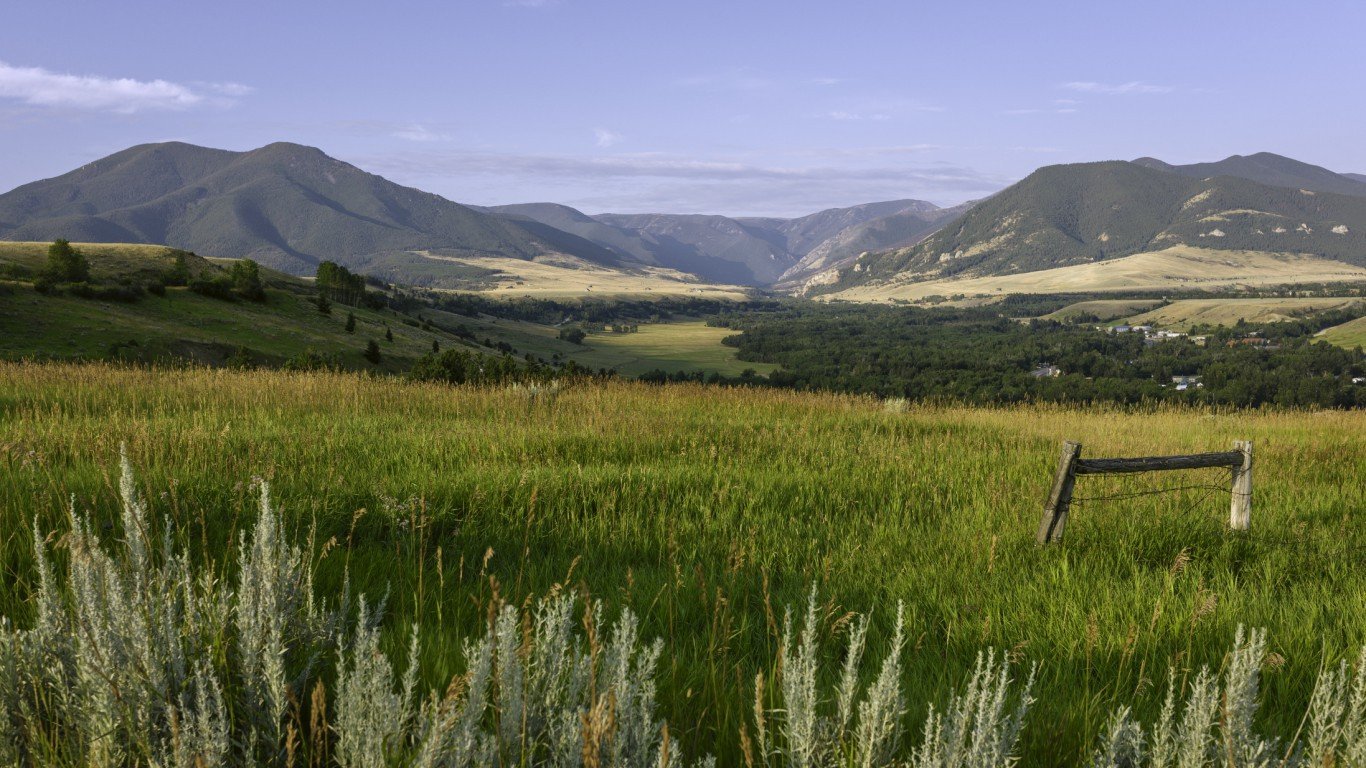
29. Montana
> Pct. 65+ with a disability: 39.5%
> Pct. 65+ obese: 23.2%
> Flu vaccine in the past year, 65+: 61.4%
> Life expectancy: 78.8 years
Montana seniors are more likely to be physically fit than those in almost all other states. Just 23.2% of Montana seniors are obese, and only 54.0% have had high blood pressure — both in the lowest five percentages among all states.
Despite ranking high in some measures of health, a greater share of Montana’s seniors have a disability, at 39.5% compared to 36.3% among all states. The state also has a below average share of seniors who eat the recommended amount of fruits and vegetables each day.

28. Oregon
> Pct. 65+ with a disability: 41.1%
> Pct. 65+ obese: 28.9%
> Flu vaccine in the past year, 65+: 56.9%
> Life expectancy: 79.5 years
Oregon has an alarmingly high share of 65 and older residents with a disability. Some 41.1% of the elderly population struggles with a disability, well above the national share of 36.3% — the eighth highest percentage of all states.
Another health issue that stands out is the percentage of elderly women that have received a pap test recently. Only 49.3% of women 65 years and older had the test in the past three years, about 8 percentage points below the national share of 57.3% and the sixth lowest share of all states.

27. New Jersey
> Pct. 65+ with a disability: 32.2%
> Pct. 65+ obese: 26.9%
> Flu vaccine in the past year, 65+: 60.7%
> Life expectancy: 80.3 years
New Jersey seniors are behind most other states when it comes to vaccination. Just 65.1% of seniors in the state have ever received a pneumococcal vaccine. That is well below the U.S. share of senior residents who received the vaccine of 71.3% and is also the second lowest share of all states.
Even though New Jersey ranks in the middle of all states as healthy for retirees, it has one of the longest life expectancies among all states at more than 80 years.
[in-text-ad-2]

26. South Carolina
> Pct. 65+ with a disability: 39.5%
> Pct. 65+ obese: 28.5%
> Flu vaccine in the past year, 65+: 62.7%
> Life expectancy: 76.9 years
In South Carolina, 28.5% of 65 and older residents are obese, only 1 percentage point above the national senior obesity rate. While the state’s senior population excels at taking measures of preventative care, including screenings and tests, nearly 40% of this age group face functional difficulties associated with the onset of dementia, including increased confusion and memory loss — the fourth highest percentage of any state.

25. Michigan
> Pct. 65+ with a disability: 38.1%
> Pct. 65+ obese: 30.0%
> Flu vaccine in the past year, 65+: 57.6%
> Life expectancy: 78.1 years
The elderly population in Michigan reports a mix of positive and negative health outcomes. On the one hand, the state’s elderly residents are among the most likely to have retirement income. Income security in retirement is important to be able to afford healthy choices and health care. The state also compares better than most in the proportion of seniors who have been screened for several life-threatening illnesses.
[in-text-ad]

24. Pennsylvania
> Pct. 65+ with a disability: 34.6%
> Pct. 65+ obese: 30.8%
> Flu vaccine in the past year, 65+: 63.9%
> Life expectancy: 78.6 years
Even though Pennsylvania is ranked in the top half of states for a healthy retirement, state seniors still face some major issues. For one, more than 30% of Pennsylvania seniors are obese, the ninth highest rate in the U.S. And just 35.0% of state seniors had some leisure time physical activity in the last month.
It appears that Pennsylvania seniors do not adhere to dietary guidelines. Just 13.5% get the recommended serving of three or more vegetables every day. That is more than 5 percentage points below the U.S. average.
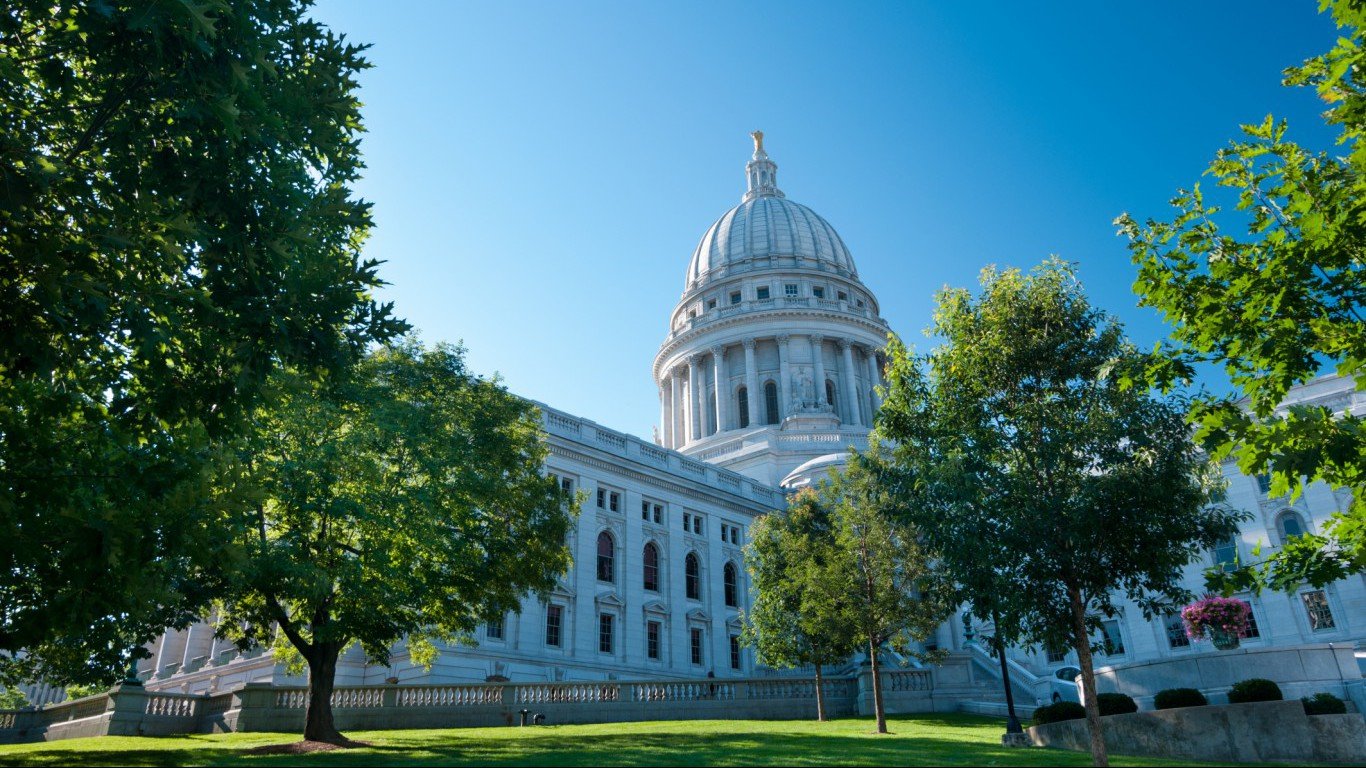
23. Wisconsin
> Pct. 65+ with a disability: 34.6%
> Pct. 65+ obese: 31.8%
> Flu vaccine in the past year, 65+: 52.9%
> Life expectancy: 79.6 years
Senior residents in Wisconsin check their cholesterol levels less than seniors nationwide. Just 94.7% of the 65 and older population got their cholesterol levels checked at least once in the past five years, below the national share of 95.3%.
Wisconsin’s elderly residents could also improve their vaccination rates. Just 52.9% of seniors received their flu shot in the past year, nearly 9 percentage points lower than the national share of 60.5% and the third lowest percentage of all states.

22. Utah
> Pct. 65+ with a disability: 37.1%
> Pct. 65+ obese: 26.2%
> Flu vaccine in the past year, 65+: 59.0%
> Life expectancy: 79.9 years
Utah’s status as a good place to retire is bolstered by its seniors’ healthy habits and lifestyle. The state has the lowest percentage of senior smokers and the fourth lowest share of seniors who admitted to binge drinking in the past month.
More than 73% of Utah seniors reported getting some physical activity in the past month, ranking in the top 10 among all states. The state also has the fifth lowest rate of high blood pressure among seniors.
[in-text-ad-2]

21. Kansas
> Pct. 65+ with a disability: 37.4%
> Pct. 65+ obese: 30.5%
> Flu vaccine in the past year, 65+: 61.7%
> Life expectancy: 78.6 years
Physical and mental health are two crucial components for seniors to enjoy their retirement, and seniors in Kansas have one important advantage over seniors in many other states. Only 5.4% of Kansas seniors had frequent mental distress, defined as more than 13 mentally unhealthy days in the last 30 days. That is one of the smallest shares in the nation and 2 percentage points below the national average.
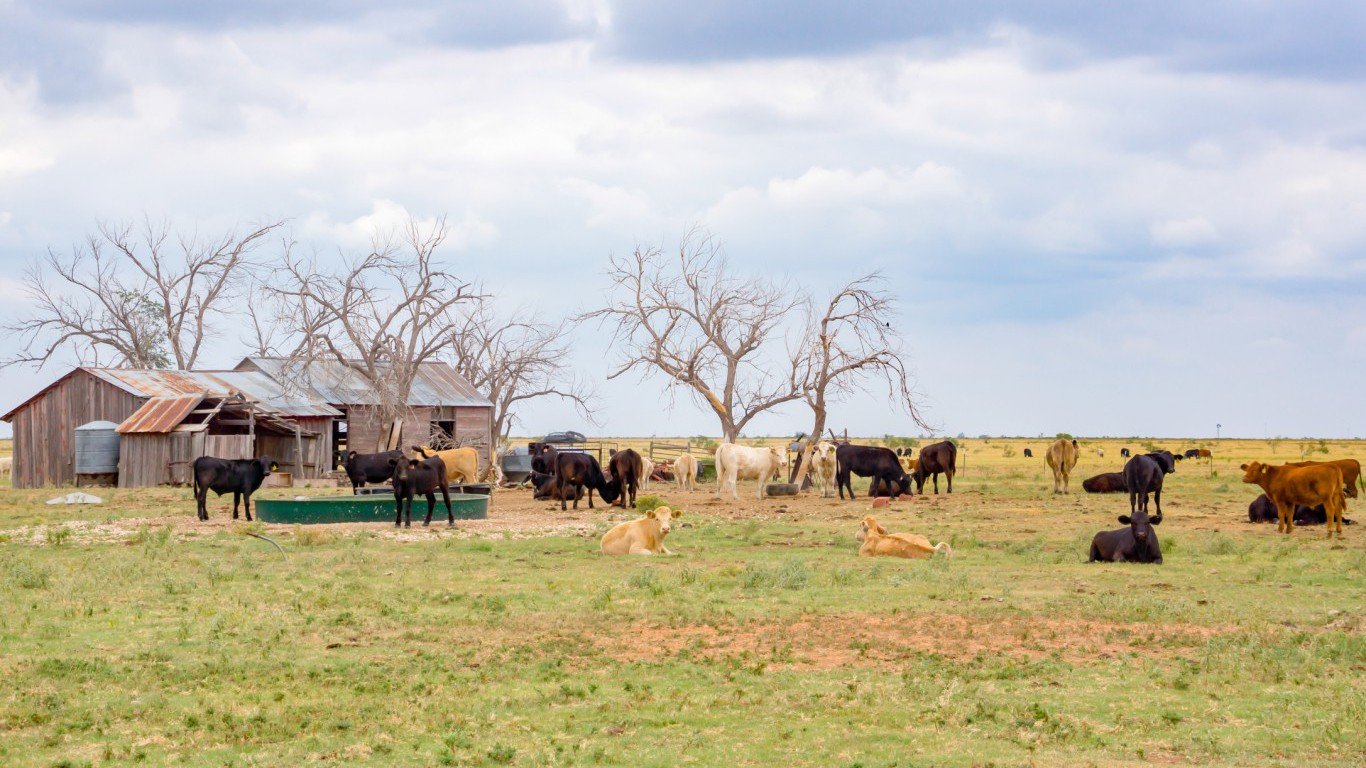
20. Texas
> Pct. 65+ with a disability: 36.4%
> Pct. 65+ obese: 29.7%
> Flu vaccine in the past year, 65+: 66.3%
> Life expectancy: 78.6 years
Living alone is a serious concern for senior citizens as it can lead to depression and make illnesses potentially life threatening. In Texas, 39.4% of seniors live alone, the sixth lowest share among states. Nationwide, 42.6% of seniors live alone. On the other hand, Texas struggles the most with a health problem most commonly found in the elderly — dementia. A nation-worst 45.9% of the state’s elderly population reports having functional difficulties associated with confusion or memory loss.
[in-text-ad]

19. North Dakota
> Pct. 65+ with a disability: 35.9%
> Pct. 65+ obese: 30.9%
> Flu vaccine in the past year, 65+: 58.8%
> Life expectancy: 79.5 years
One major issue plaguing seniors is restricted mobility. As people slow down, many lose the ability to drive their own cars, get around the house or even walk without some assistance. But people over the age of 65 in North Dakota have largely avoided mobility issues. Just 4.4% of North Dakota seniors had their activity limited within the last month, the lowest share of any state.
Seniors in the state also had an average of just 4.5 unhealthy days a month, one of the lowest averages among states.
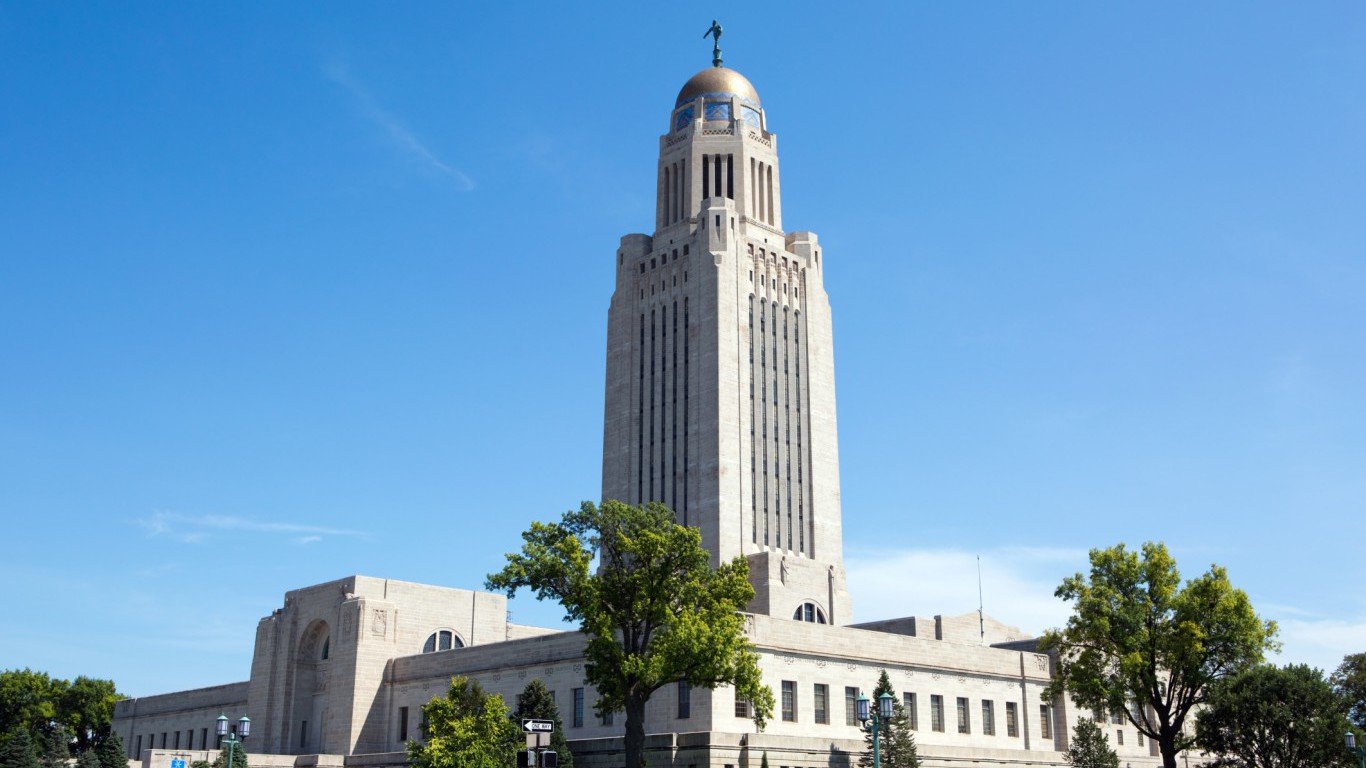
18. Nebraska
> Pct. 65+ with a disability: 36.6%
> Pct. 65+ obese: 32.0%
> Flu vaccine in the past year, 65+: 65.2%
> Life expectancy: 79.5 years
One of the unfortunate realities for many of our nation’s elderly residents is the prospect of living alone. This can be dangerous in case of a medical emergency, and the isolation can lead to depression, particularly since seniors are less likely to engage in social activities outside of the home. Across the country, 42.6% of heads of household 65 and older live by themselves. In Nebraska, 46.8% senior heads of household live alone.
Despite the higher likelihood of living in isolation, seniors in the state are actually among the least likely to feel mentally unwell. Just 5.3% of seniors suffer from frequent mental distress, which the CDC defines as 14 or more days of poor mental health each month.

17. North Carolina
> Pct. 65+ with a disability: 40.2%
> Pct. 65+ obese: 26.7%
> Flu vaccine in the past year, 65+: 70.4%
> Life expectancy: 77.9 years
In North Carolina, 70.4% of people 65 years and older received a flu shot within the past year. For perspective, this is nearly 10 percentage points above the national share of 60.5% and the second highest percentage of all the states. In addition, the elderly population also has excelled at seeking preventive care, particularly getting cholesterol levels checked. A whopping 97.2% of senior state residents got their levels checked in the past five years, the second highest percentage of all the states. Nationwide, 95.3% of senior residents had their cholesterol checked.
[in-text-ad-2]

16. Virginia
> Pct. 65+ with a disability: 32.5%
> Pct. 65+ obese: 29.3%
> Flu vaccine in the past year, 65+: 61.5%
> Life expectancy: 79.1 years
Virginia is ranked as 16th best state for seniors. Seniors in Virginia have been very fortunate to avoid disabilities. Just 32.5% of the senior population lives with a disability, below the national share of 36.3% and one of the lowest shares of all states.
The state’s seniors are also less likely to be diagnosed with depression than all but a handful of other states.

15. California
> Pct. 65+ with a disability: 36.2%
> Pct. 65+ obese: 22.8%
> Flu vaccine in the past year, 65+: 61.6%
> Life expectancy: 80.9 years
Senior California residents tend to eat the recommended amount of fruit and vegetables. However, they are not as proactive on taking preventive care measures. For example, 41.6% of women are up-to-date on their vaccines and screenings specific to their health, just a bit below the national average of 42.1%. The same goes for elderly men — only 38.5% are up-to-date with their screenings and vaccinations, more than 2 percentage points below the national average of 40.8%.
Also high is the share of elderly people who were injured by a fall in the past year. An estimated 12.4% of 65 and older residents got an injury due to falling, the second most of any state and above national average of 10.7%.
[in-text-ad]

14. Washington
> Pct. 65+ with a disability: 40.2%
> Pct. 65+ obese: 27.2%
> Flu vaccine in the past year, 65+: 61.4%
> Life expectancy: 80.2 years
Washington ranks 14th best state to retire based on a wide range of factors. One measure likely contributing significantly to the high rank is the state’s senior residents physical health. Some 79.8% of the state’s seniors rate their health between good and excellent — the seventh highest share of seniors who feel that positively about their health.
That makes sense with all the exercise Washington’s seniors get. Some 78.0% got some leisure time physical activity within the last month, the second highest share nationwide.
13. Delaware
> Pct. 65+ with a disability: 32.5%
> Pct. 65+ obese: 27.9%
> Flu vaccine in the past year, 65+: 65.3%
> Life expectancy: 78.8 years
Seniors in Delaware are ahead of seniors in most other states when it comes to recommended screenings and vaccines. Over 46% of the state’s seniors — both men and women — have had all their recommended preventive care, well over the national average of 42.1% of women and 40.8% of men.
Specifically, 81.1% of senior women have had a mammogram in the past two years, and 81.1% of all seniors were screened for colorectal cancer — respectively the second and third highest shares of all states.

12. Massachusetts
> Pct. 65+ with a disability: 34.9%
> Pct. 65+ obese: 25.2%
> Flu vaccine in the past year, 65+: 61.0%
> Life expectancy: 80.7 years
Eating healthy is one of the best ways a person can help maintain a healthy lifestyle, and seniors in Massachusetts are some of the best nationwide at getting the recommended amount of fruits and vegetables. Some 49.0% of Massachusetts seniors eat two or more fruits daily, the highest share of all states. State senior residents are also more likely than seniors in most states to eat enough vegetables.
At 80.7 years, the state reports the fifth highest life expectancy, one of just 10 states where people are projected to live over 80 years on average.
[in-text-ad-2]
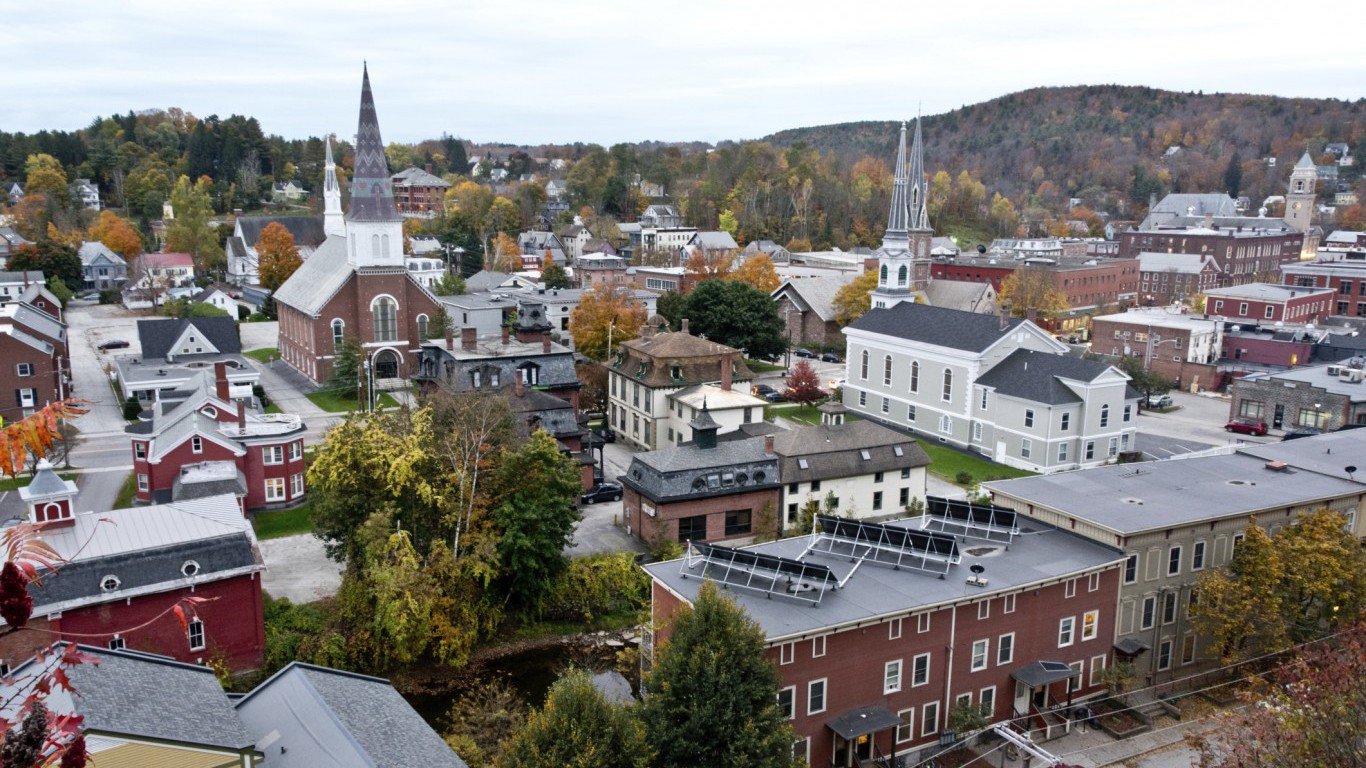
11. Vermont
> Pct. 65+ with a disability: 34.5%
> Pct. 65+ obese: 26.9%
> Flu vaccine in the past year, 65+: 60.9%
> Life expectancy: 79.8 years
Vermont seniors are ahead of average senior Americans in terms of staying on top of their health. People 65 and over in Vermont are among the most likely to have gotten the flu vaccine within the last year. Also, 76.3% of seniors in the state have gotten a pneumococcal vaccine, 5 percentage points higher than the national average.
Taking care of oneself is essential for good health, and people 65 and older in Vermont are sick less often than most Americans. Vermont seniors are physically unhealthy an average of 4.9 days per month, compared to a national average of 5.3 monthly unhealthy days.
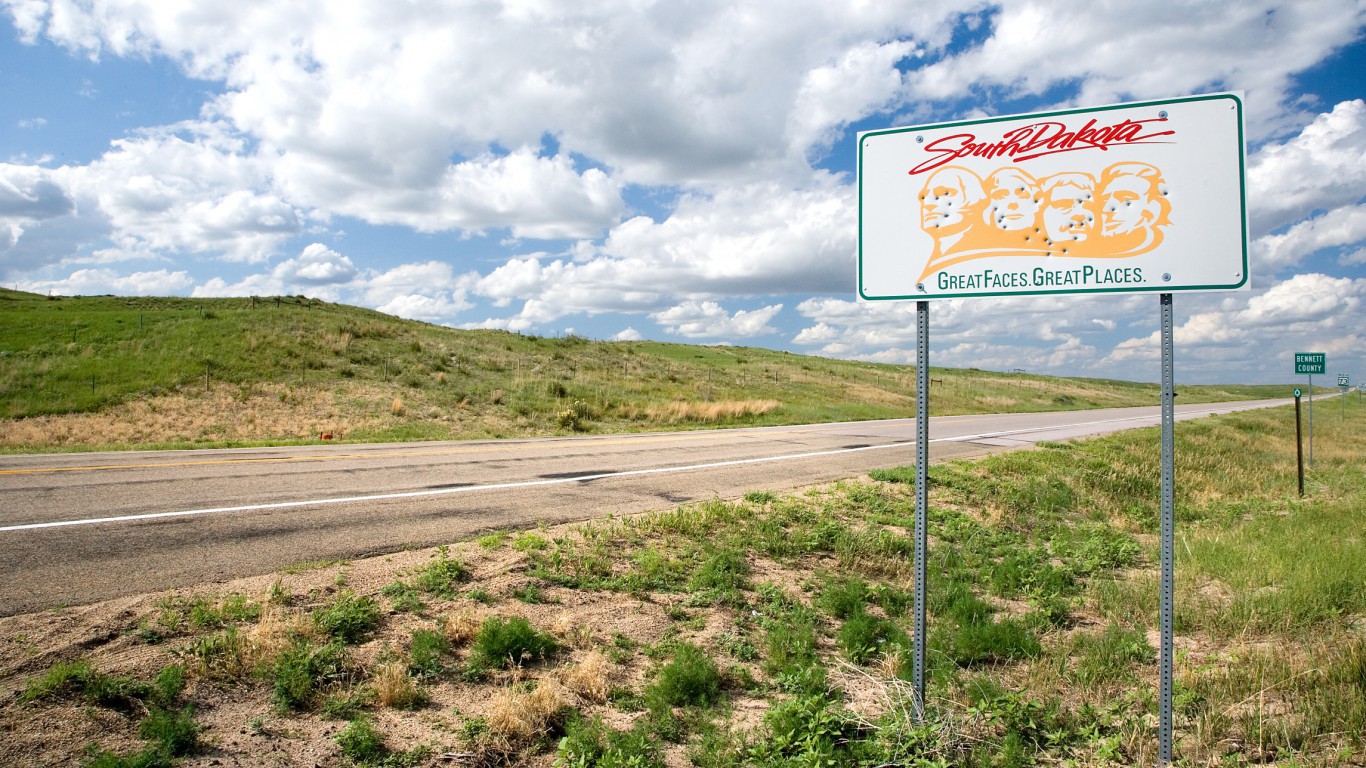
10. South Dakota
> Pct. 65+ with a disability: 39.4%
> Pct. 65+ obese: 26.5%
> Flu vaccine in the past year, 65+: 70.6%
> Life expectancy: 79.5 years
Those who are 65 and older in South Dakota are quite proactive when it comes to preventive care. For example, 70.6% received their flu shot within the past year — that’s 10.1 percentage points above the national average. Nearly half of both men and women in this age group said they were up-to-date with screenings and vaccinations, at 49.0% and 48.8%, respectively. Both figures exceed the national average by at least 6 percentage points and fall within the top five highest percentages of all states.
Additionally, South Dakota seniors report feeling physically unhealthy for only an average of 4.5 days out of the last month, below the nationwide average of 5.3.
[in-text-ad]

9. Rhode Island
> Pct. 65+ with a disability: 34.7%
> Pct. 65+ obese: 24.4%
> Flu vaccine in the past year, 65+: 62.9%
> Life expectancy: 79.7 years
Heart disease is the leading cause of death in America, but Rhode Island seniors are taking some key steps to keep their hearts healthy. Smoking can increase the risk of heart disease, but only 7.5% of Rhode Island seniors smoke cigarettes, one of the lowest senior smoking rates in the nation.
High cholesterol can also increase the risk of cardiovascular disease. More than 96% of Rhode Islanders over 65 had their cholesterol checked in the past five years.

8. Maryland
> Pct. 65+ with a disability: 34.6%
> Pct. 65+ obese: 29.4%
> Flu vaccine in the past year, 65+: 61.0%
> Life expectancy: 79.3 years
Maryland has the highest share of senior residents who check their cholesterol level — a known risk factor for cardiovascular disease. An impressive 97.5% of the state’s 65 year and older population have gotten their cholesterol levels tested in the past five years — 2.2 percentage points above the national proportion at 95.3%.
The shares of seniors who have undergone colorectal cancer screenings and mammograms in the past several years are in the top five highest percentages of all the states.
7. Iowa
> Pct. 65+ with a disability: 34.5%
> Pct. 65+ obese: 31.1%
> Flu vaccine in the past year, 65+: 70.1%
> Life expectancy: 79.3 years
Iowa seniors are among the most mentally healthy in the nation. Just 4.6% of Iowans 65 and over suffered from frequent mental distress, the lowest share in the nation and well below the U.S. share of 7.4%. The state’s seniors are also less susceptible to depression. Some 12.9% of senior state residents have ever been diagnosed with depression, fifth lowest share of all states. Nationwide, 15.0% of elderly Americans were diagnosed with depression.
Perhaps most encouraging is the low share of seniors struggling with dementia symptoms. Only 17.3% of Iowa seniors experienced functional difficulties associated with increased confusion or memory loss. To compare, 31.2% of seniors nationwide struggle with such difficulties.
[in-text-ad-2]

6. Connecticut
> Pct. 65+ with a disability: 36.5%
> Pct. 65+ obese: 25.5%
> Flu vaccine in the past year, 65+: 65.6%
> Life expectancy: 80.8 years
Obesity is associated with a number of life-threatening illnesses. For the elderly, maintaining a healthy body weight is important, because seniors are more likely to live sedentary lifestyles, and because aging bodies naturally put on more fat.
Only 25.5% of seniors in Connecticut are obese, 2 percentage points below the national senior obesity rate of 27.5%. Their slimmer physique may be due to their dietary habits. Seniors in Connecticut include an adequate amount of vegetables in their diet, with 19.7% of the senior population eating at least three servings of veggies per day, above the national average of 18.8%.

5. Minnesota
> Pct. 65+ with a disability: 32.5%
> Pct. 65+ obese: 28.5%
> Flu vaccine in the past year, 65+: 64.8%
> Life expectancy: 80.7 years
More than 80% of people in the state 65 and over said their health is somewhere between good and excellent, one of the highest shares in the nation. It is easy to see why when seniors in Minnesota average just 4.4 unhealthy days per month, the fourth lowest rate in the country.
Only 56.3% of the senior population has ever been diagnosed with high blood pressure, more than 5 percentage points below the national average.
[in-text-ad]

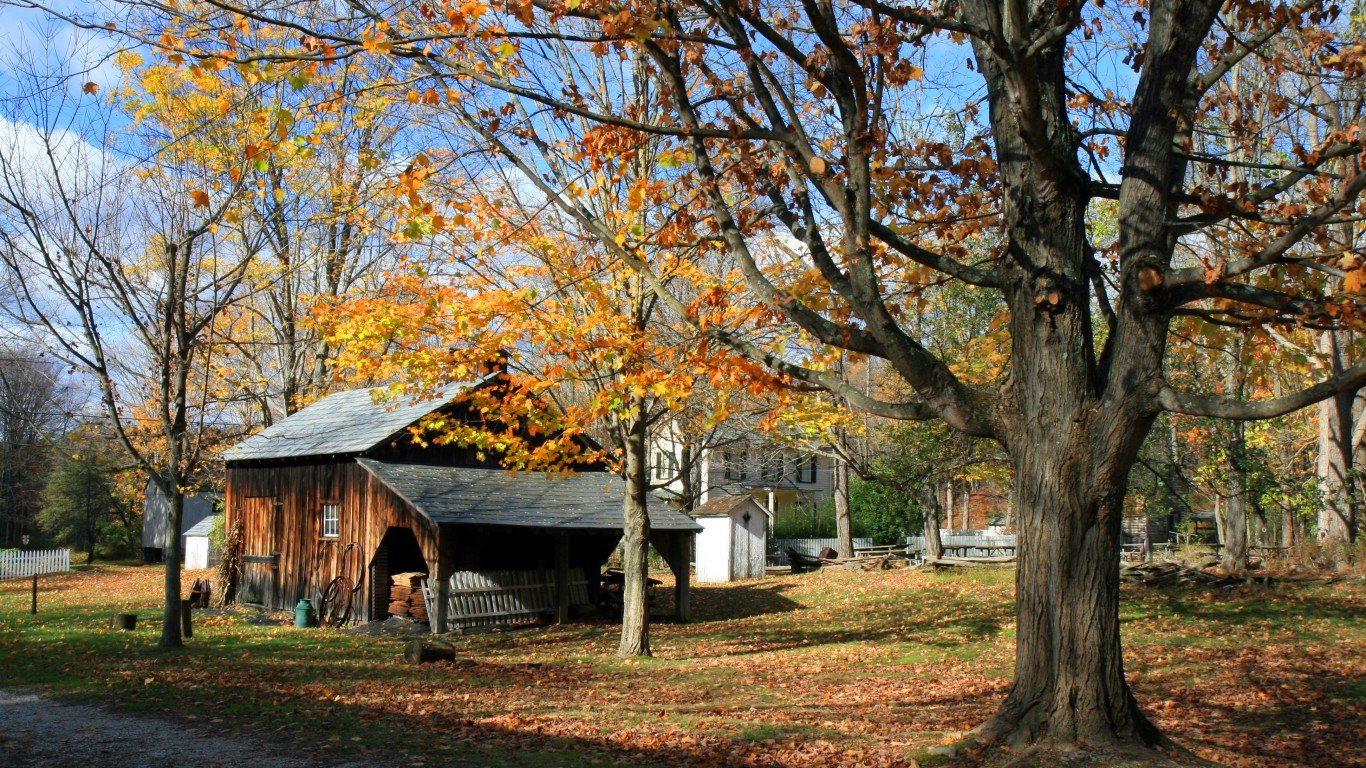
4. Maine
> Pct. 65+ with a disability: 35.7%
> Pct. 65+ obese: 29.0%
> Flu vaccine in the past year, 65+: 62.8%
> Life expectancy: 79.1 years
Seniors in Maine are among the most mobile in the country. Only 5.0% of people 65 and over in Maine were limited in their activity due to an illness or condition in the past month, lower than in all but two other states and a full percentage point below national average.
Maine seniors do a good job of lowering the risk of potential problems. They are more likely to maintain a good diet that includes getting enough fruits and vegetables more often than the average U.S. senior. Also, some 81.8% of senior women have gotten a mammogram in the past two years, the highest share of any state.

3. New Hampshire
> Pct. 65+ with a disability: 31.4%
> Pct. 65+ obese: 27.8%
> Flu vaccine in the past year, 65+: 62.9%
> Life expectancy: 80.1 years
New Hampshire may not be ranked as the best state for healthy retirement, but the state’s senior residents report feeling healthier than those in any other state. Some 82.6% of seniors in New Hampshire ranked their health between good and excellent, the highest percentage of any state.
New Hampshire seniors also have the second fewest sick days per month, at just 4.1, more than a full day below the U.S. average. Likely contributing to state seniors healthy feelings is the low share of seniors with a disability. Some 31.4% of New Hampshire seniors have a disability, also the second lowest rate nationwide.

2. Hawaii
> Pct. 65+ with a disability: 26.3%
> Pct. 65+ obese: 17.9%
> Flu vaccine in the past year, 65+: 61.2%
> Life expectancy: 81.2 years
Hawaii is not only a great place for vacation, but is also a great place for seniors to live permanently. Seniors in Hawaii are sick less often than those in any other state. The average Hawaii senior reports 3.9 unhealthy days per month, compared to the 5.3 day average reported by seniors across the country.
Hawaii seniors also have the lowest obesity rate in the country. Just 17.9% of Hawaii seniors are obese, compared to 27.5% nationwide. Also, just 7.6% of Hawaii’s 65 and older residents have ever been diagnosed with depression, just over half the nationwide share of 15.0% seniors diagnosed with depression.
[in-text-ad-2]

1. Colorado
> Pct. 65+ with a disability: 36.4%
> Pct. 65+ obese: 20.0%
> Flu vaccine in the past year, 65+: 67.3%
> Life expectancy: 80.3 years
Colorado is the best place in the country for a healthy retirement. The state beat all 49 other states in a number of key measures of health for people 65 and over. Just 53.0% of Colorado seniors have ever been diagnosed with high blood pressure, the lowest share in the nation and more than 8 percentage points below the national average.
Some 50.1% of Colorado’s senior men are up-to-date on all recommended vaccines and screenings, the only senior male population mostly caught up on preventive care. Some 47.1% of women are also up-to-date on their screenings. While not the top share, this is still 5 percentage points ahead of the national average.
Detailed Findings & Methodology
As is the case among the population as a whole, there is a strong relationship between the health of a state’s senior population and the income of the senior population. States with high senior incomes like Hawaii and Colorado generally have healthier senior populations, while low-income states like Arkansas and Mississippi rank among the worst.
However, there are a great many outliers. Alaska, which ranks third worst for senior health, has one of the highest mean earnings for residents 65 and older. States like Maine, which has generally low incomes for seniors, has among the healthiest elderly residents. This may be due to the fact that seniors often do not rely on income, but rather accumulated savings.
While many factors can affect longevity, there is a strong strong correlation between a state’s ranking as a place for healthy retirement and the state’s average life expectancy. People in Colorado, the best ranked state, live on average nearly 4.5 years longer than people in Arkansas, the worst ranked state.
Preventive care is crucial because it can save seniors from communicable diseases and help catch other diseases at early stages. Procedures like mammograms and colorectal cancer screenings can catch potentially life-threatening diseases before they get too serious to treat. Other preventive care strategies include vaccines, which can prevent people, especially older people with weakened immune systems, from ever getting sick in the first place.
Behavioral indicators, such as not smoking, eating healthy, and exercising, can help seniors lower the risk of different types of illness like lung problems and heart disease — the leading cause of death in the United States.
Health outcome factors are also important because they provide a snapshot of seniors current health in a state. Outcomes include the frequency of mental and physical illness, the percentage of seniors who are disabled, and the rate of seniors who were injured in falls.
In order to determine the best states for a healthy retirement, 24/7 Wall St. used 17 health indicators for Americans 65 and older from the Centers for Disease Control and Prevention’s “Healthy Aging Program.” We averaged all 17 measures to determine how healthy are senior citizens in each state. Those 17 selected measures closely mirror the CDC’s 15 key indicators of older adult health. The health indicators were grouped into three categories: preventive care, behaviors, and health outcomes.
Preventive care includes data on whether seniors are up-to-date on their influenza and pneumococcal vaccines, screenings like mammograms and colorectal cancer test. Behavioral indicators include senior got leisure time physical activity, eating the recommended amount of fruits and vegetables, cigarette smoking rate, taking blood pressure medication, and the senior obesity rate. Health outcomes include the number of unhealthy days per month, how prone seniors are to frequent mental distress, whether they retained their natural teeth, the percentage of seniors who are disabled and the percentage of those injured by falling.
A financial advisor can help you understand the advantages and disadvantages of investment properties. Finding a qualified financial advisor doesn’t have to be hard. SmartAsset’s free tool matches you with up to three financial advisors who serve your area, and you can interview your advisor matches at no cost to decide which one is right for you. If you’re ready to find an advisor who can help you achieve your financial goals, get started now.
Investing in real estate can diversify your portfolio. But expanding your horizons may add additional costs. If you’re an investor looking to minimize expenses, consider checking out online brokerages. They often offer low investment fees, helping you maximize your profit.
Thank you for reading! Have some feedback for us?
Contact the 24/7 Wall St. editorial team.


 24/7 Wall St.
 24/7 Wall St.
 24/7 Wall St.
 24/7 Wall St.
 24/7 Wall St.
 24/7 Wall St.
 24/7 Wall St.
 24/7 Wall St.