Special Report
25 Cities Adding (and Losing) the Most Jobs in 2017

Published:
Last Updated:
2017 may stand out for many events and developments, and among them is the exceptional year turned in by the labor market. For one, U.S. unemployment dropped to 4.1% in October, the lowest since December 2000.
Barring a massive exodus of workers from the labor force, falling unemployment almost always reflects increased hiring, which in turn bodes well for the economy. But while national conditions are favorable, trends vary substantially across the country, and not all local economies have been doing as well.
24/7 Wall St. reviewed monthly metro area employment figures in 2017 from the Bureau of Labor Statistics. From January through October, employment — the number of Americans currently employed — rose by 1.2%. Employment rose faster over that period in 187 of the nation’s 388 metro areas. It declined in 78 metro areas.
Most of the cities adding the most jobs in 2017 reported uninterrupted employment increases over the course of the year, but this was not always the case. Both Yuma, Arizona and Corvallis, Oregon reported among the largest employment increases this year, yet had some fairly dramatic employment fluctuations. In Yuma, for example, seasonally adjusted employment levels dropped for four consecutive months in the summer before rising again in September and October.
Similarly, while the trend in most cities losing the most jobs was one of steady decline, in several job changes were somewhat erratic. Employment in the St. Joseph metro area, on the border of Montana and Kansas, for example, surged in July before dropping in October.
Click here to see the cities adding the most jobs.
Click here to see the cities losing the most jobs.
Click here to see our detailed findings and methodology.
Cities Adding the Most Jobs

25. Janesville-Beloit, WI
> Employment change: 2,826 (+3.5%)
> Jan. 2017 employment: 80,978
> Oct. 2017 employment: 83,804
> Unemployment, Oct. 2017: 3.4%
> Strongest sector: Mining, logging, and construction (+11.5% employment chg.)
[in-text-ad]

24. Corvallis, OR
> Employment change: 1,627 (+3.6%)
> Jan. 2017 employment: 45,537
> Oct. 2017 employment: 47,164
> Unemployment, Oct. 2017: 3.3% (lowest 25%)
> Strongest sector: Mining, logging, and construction (+8.3% employment chg.)

23. Yuma, AZ
> Employment change: 2,883 (+3.6%)
> Jan. 2017 employment: 79,504
> Oct. 2017 employment: 82,387
> Unemployment, Oct. 2017: 17.4% (highest 10%)
> Strongest sector: Mining, logging, and construction (+4.5% employment chg.)
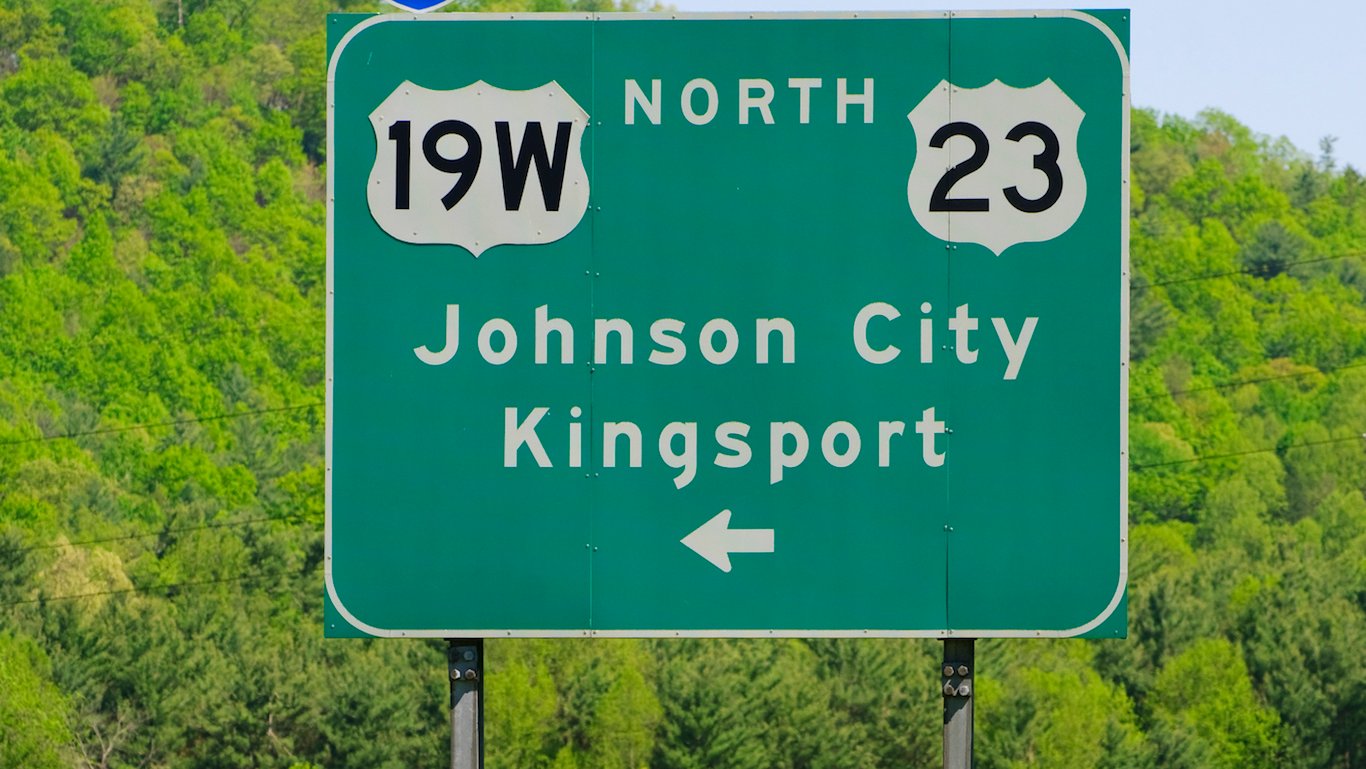
22. Johnson City, TN
> Employment change: 3,147 (+3.7%)
> Jan. 2017 employment: 84,679
> Oct. 2017 employment: 87,826
> Unemployment, Oct. 2017: 3.6%
> Strongest sector: Government (+11.1% employment chg.)
[in-text-ad-2]

21. Chattanooga, TN-GA
> Employment change: 9,377 (+3.8%)
> Jan. 2017 employment: 249,982
> Oct. 2017 employment: 259,359
> Unemployment, Oct. 2017: 3.5%
> Strongest sector: Mining, logging, and construction (+8.2% employment chg.)

20. Eugene, OR
> Employment change: 6,475 (+3.8%)
> Jan. 2017 employment: 172,152
> Oct. 2017 employment: 178,627
> Unemployment, Oct. 2017: 4.6%
> Strongest sector: Mining, logging, and construction (+13.7% employment chg.)
[in-text-ad]

19. Portland-Vancouver-Hillsboro, OR-WA
> Employment change: 46,621 (+3.8%)
> Jan. 2017 employment: 1,230,028
> Oct. 2017 employment: 1,276,649
> Unemployment, Oct. 2017: 4.2%
> Strongest sector: Mining, logging, and construction (+19.4% employment chg.)

18. Bremerton-Silverdale, WA
> Employment change: 4,366 (+3.9%)
> Jan. 2017 employment: 111,618
> Oct. 2017 employment: 115,984
> Unemployment, Oct. 2017: 4.6%
> Strongest sector: Mining, logging, and construction (+7.1% employment chg.)

17. Naples-Immokalee-Marco Island, FL
> Employment change: 6,466 (+4.1%)
> Jan. 2017 employment: 158,952
> Oct. 2017 employment: 165,418
> Unemployment, Oct. 2017: 3.4%
> Strongest sector: Mining, logging, and construction (+9.1% employment chg.)
[in-text-ad-2]

16. Auburn-Opelika, AL
> Employment change: 2,938 (+4.2%)
> Jan. 2017 employment: 70,002
> Oct. 2017 employment: 72,940
> Unemployment, Oct. 2017: 3.1% (lowest 25%)
> Strongest sector: Government (+10.9% employment chg.)

15. Bend-Redmond, OR
> Employment change: 3,684 (+4.2%)
> Jan. 2017 employment: 87,205
> Oct. 2017 employment: 90,889
> Unemployment, Oct. 2017: 4.2%
> Strongest sector: Mining, logging, and construction (+22.8% employment chg.)
[in-text-ad]

14. Morristown, TN
> Employment change: 2,043 (+4.2%)
> Jan. 2017 employment: 48,359
> Oct. 2017 employment: 50,402
> Unemployment, Oct. 2017: 3.6%
> Strongest sector: Education and health services (+14.5% employment chg.)

13. Olympia-Tumwater, WA
> Employment change: 5,548 (+4.4%)
> Jan. 2017 employment: 125,170
> Oct. 2017 employment: 130,718
> Unemployment, Oct. 2017: 4.7%
> Strongest sector: Mining, logging, and construction (+18.8% employment chg.)
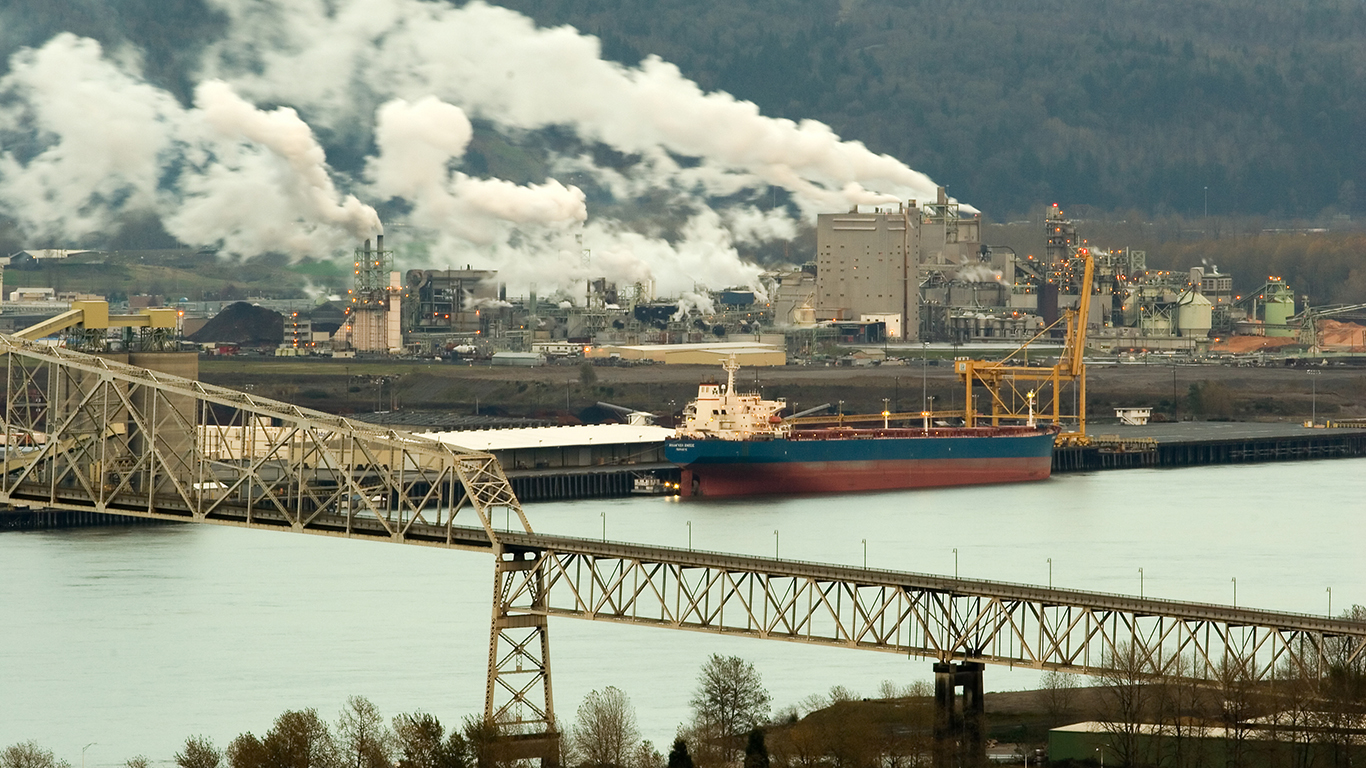
12. Longview, WA
> Employment change: 1,885 (+4.5%)
> Jan. 2017 employment: 41,617
> Oct. 2017 employment: 43,502
> Unemployment, Oct. 2017: 5.6% (highest 25%)
> Strongest sector: Mining, logging, and construction (+6.5% employment chg.)
[in-text-ad-2]

11. Nashville-Davidson-Murfreesboro-Franklin, TN
> Employment change: 43,392 (+4.6%)
> Jan. 2017 employment: 949,989
> Oct. 2017 employment: 993,381
> Unemployment, Oct. 2017: 2.4% (lowest 10%)
> Strongest sector: Mining, logging, and construction (+7.2% employment chg.)

10. Spokane-Spokane Valley, WA
> Employment change: 11,114 (+4.6%)
> Jan. 2017 employment: 242,457
> Oct. 2017 employment: 253,571
> Unemployment, Oct. 2017: 5.0% (highest 25%)
> Strongest sector: Mining, logging, and construction (+20.3% employment chg.)
[in-text-ad]

9. Greeley, CO
> Employment change: 6,953 (+4.7%)
> Jan. 2017 employment: 147,003
> Oct. 2017 employment: 153,956
> Unemployment, Oct. 2017: 2.7% (lowest 10%)
> Strongest sector: Mining, logging, and construction (+10.1% employment chg.)

8. Sebring, FL
> Employment change: 1,635 (+4.8%)
> Jan. 2017 employment: 34,407
> Oct. 2017 employment: 36,042
> Unemployment, Oct. 2017: 4.4%
> Strongest sector: Professional and business services (+5.0% employment chg.)

7. Daphne-Fairhope-Foley, AL
> Employment change: 4,208 (+4.9%)
> Jan. 2017 employment: 85,678
> Oct. 2017 employment: 89,886
> Unemployment, Oct. 2017: 3.2% (lowest 25%)
> Strongest sector: Other services (+10.4% employment chg.)
[in-text-ad-2]

6. Athens-Clarke County, GA
> Employment change: 4,632 (+5.0%)
> Jan. 2017 employment: 92,496
> Oct. 2017 employment: 97,128
> Unemployment, Oct. 2017: 4.1%
> Strongest sector: Government (+8.1% employment chg.)

5. St. George, UT
> Employment change: 3,330 (+5.0%)
> Jan. 2017 employment: 66,477
> Oct. 2017 employment: 69,807
> Unemployment, Oct. 2017: 3.3% (lowest 25%)
> Strongest sector: Mining, logging, and construction (+15.0% employment chg.)
[in-text-ad]

4. Mount Vernon-Anacortes, WA
> Employment change: 2,752 (+5.0%)
> Jan. 2017 employment: 54,870
> Oct. 2017 employment: 57,622
> Unemployment, Oct. 2017: 5.0% (highest 25%)
> Strongest sector: Mining, logging, and construction (+10.8% employment chg.)

3. Fort Collins, CO
> Employment change: 9,330 (+5.0%)
> Jan. 2017 employment: 185,803
> Oct. 2017 employment: 195,133
> Unemployment, Oct. 2017: 2.4% (lowest 10%)
> Strongest sector: Mining, logging, and construction (+10.9% employment chg.)

2. Fayetteville-Springdale-Rogers, AR-MO
> Employment change: 13,385 (+5.2%)
> Jan. 2017 employment: 258,191
> Oct. 2017 employment: 271,576
> Unemployment, Oct. 2017: 2.6% (lowest 10%)
> Strongest sector: Government (+9.2% employment chg.)
[in-text-ad-2]

1. Bellingham, WA
> Employment change: 5,609 (+5.5%)
> Jan. 2017 employment: 102,069
> Oct. 2017 employment: 107,678
> Unemployment, Oct. 2017: 4.5%
> Strongest sector: Mining, logging, and construction (+16.9% employment chg.)
Cities Losing the Most Jobs

25. Great Falls, MT
> Employment change: -436 (-1.2%)
> Jan. 2017 employment: 36,971
> Oct. 2017 employment: 36,535
> Unemployment, Oct. 2017: 3.7%
> Weakest sector (employment chg.): Trade, transportation, and utilities (0.0%)
[in-text-ad]

24. Shreveport-Bossier City, LA
> Employment change: -2,159 (-1.2%)
> Jan. 2017 employment: 177,180
> Oct. 2017 employment: 175,021
> Unemployment, Oct. 2017: 5.2% (highest 25%)
> Weakest sector (employment chg.): Mining, logging, and construction (-3.4%)

23. Muskegon, MI
> Employment change: -902 (-1.2%)
> Jan. 2017 employment: 73,617
> Oct. 2017 employment: 72,715
> Unemployment, Oct. 2017: 5.7% (highest 10%)
> Weakest sector (employment chg.): Trade, transportation, and utilities (-0.7%)

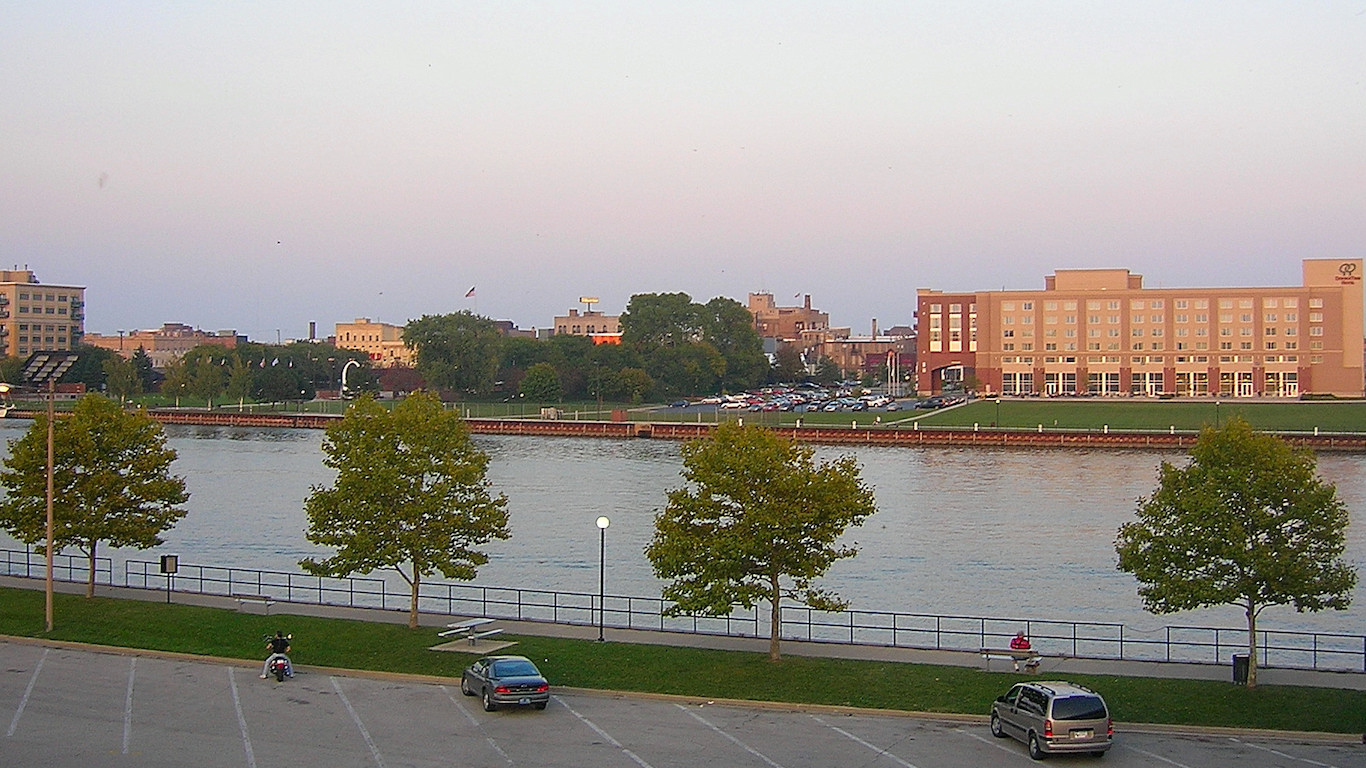
22. Davenport-Moline-Rock Island, IA-IL
> Employment change: -2,357 (-1.3%)
> Jan. 2017 employment: 181,756
> Oct. 2017 employment: 179,399
> Unemployment, Oct. 2017: 4.3%
> Weakest sector (employment chg.): Trade, transportation, and utilities (-0.3%)
[in-text-ad-2]

21. St. Joseph, MO-KS
> Employment change: -885 (-1.4%)
> Jan. 2017 employment: 63,050
> Oct. 2017 employment: 62,165
> Unemployment, Oct. 2017: 3.0% (lowest 25%)
> Weakest sector (employment chg.): Trade, transportation, and utilities (-3.6%)

20. Beckley, WV
> Employment change: -600 (-1.4%)
> Jan. 2017 employment: 42,224
> Oct. 2017 employment: 41,624
> Unemployment, Oct. 2017: 5.6% (highest 25%)
> Weakest sector (employment chg.): Government (-2.2%)
[in-text-ad]

19. Williamsport, PA
> Employment change: -787 (-1.4%)
> Jan. 2017 employment: 54,456
> Oct. 2017 employment: 53,669
> Unemployment, Oct. 2017: 5.4% (highest 25%)
> Weakest sector (employment chg.): Trade, transportation, and utilities (-2.8%)

18. Parkersburg-Vienna, WV
> Employment change: -559 (-1.5%)
> Jan. 2017 employment: 36,615
> Oct. 2017 employment: 36,056
> Unemployment, Oct. 2017: 5.3% (highest 25%)
> Weakest sector (employment chg.): Other services (-0.7%)

17. Champaign-Urbana, IL
> Employment change: -1,742 (-1.5%)
> Jan. 2017 employment: 114,026
> Oct. 2017 employment: 112,284
> Unemployment, Oct. 2017: 4.2%
> Weakest sector (employment chg.): Manufacturing (0.0%)
[in-text-ad-2]

16. Lansing-East Lansing, MI
> Employment change: -3,781 (-1.6%)
> Jan. 2017 employment: 240,368
> Oct. 2017 employment: 236,587
> Unemployment, Oct. 2017: 4.6%
> Weakest sector (employment chg.): Manufacturing (-1.9%)

15. Pocatello, ID
> Employment change: -656 (-1.6%)
> Jan. 2017 employment: 40,390
> Oct. 2017 employment: 39,734
> Unemployment, Oct. 2017: 2.8% (lowest 25%)
> Weakest sector (employment chg.): Manufacturing (0.0%)
[in-text-ad]

14. Casper, WY
> Employment change: -615 (-1.6%)
> Jan. 2017 employment: 37,419
> Oct. 2017 employment: 36,804
> Unemployment, Oct. 2017: 5.2% (highest 25%)
> Weakest sector (employment chg.): Government (-3.4%)

13. Niles-Benton Harbor, MI
> Employment change: -1,173 (-1.7%)
> Jan. 2017 employment: 70,864
> Oct. 2017 employment: 69,691
> Unemployment, Oct. 2017: 5.0% (highest 25%)
> Weakest sector (employment chg.): Trade, transportation, and utilities (-0.9%)

12. Altoona, PA
> Employment change: -993 (-1.7%)
> Jan. 2017 employment: 57,178
> Oct. 2017 employment: 56,185
> Unemployment, Oct. 2017: 4.6%
> Weakest sector (employment chg.): Financial activities (-6.3%)
[in-text-ad-2]

11. Midland, MI
> Employment change: -734 (-1.9%)
> Jan. 2017 employment: 39,169
> Oct. 2017 employment: 38,435
> Unemployment, Oct. 2017: 4.7%
> Weakest sector (employment chg.): Professional and business services (-1.2%)

10. Dubuque, IA
> Employment change: -1,051 (-2.0%)
> Jan. 2017 employment: 53,463
> Oct. 2017 employment: 52,412
> Unemployment, Oct. 2017: 2.9% (lowest 25%)
> Weakest sector (employment chg.): Trade, transportation, and utilities (-2.4%)
[in-text-ad]

9. Decatur, IL
> Employment change: -1,032 (-2.2%)
> Jan. 2017 employment: 46,897
> Oct. 2017 employment: 45,865
> Unemployment, Oct. 2017: 5.4% (highest 25%)
> Weakest sector (employment chg.): Trade, transportation, and utilities (-0.9%)

8. Grand Forks, ND-MN
> Employment change: -1,243 (-2.2%)
> Jan. 2017 employment: 56,231
> Oct. 2017 employment: 54,988
> Unemployment, Oct. 2017: 2.7% (lowest 10%)
> Weakest sector (employment chg.): Mining, logging, and construction (-5.3%)
7. Bay City, MI
> Employment change: -1,112 (-2.2%)
> Jan. 2017 employment: 49,591
> Oct. 2017 employment: 48,479
> Unemployment, Oct. 2017: 5.6% (highest 25%)
> Weakest sector (employment chg.): Trade, transportation, and utilities (-5.2%)
[in-text-ad-2]

6. Springfield, IL
> Employment change: -2,518 (-2.3%)
> Jan. 2017 employment: 108,353
> Oct. 2017 employment: 105,835
> Unemployment, Oct. 2017: 4.2%
> Weakest sector (employment chg.): Trade, transportation, and utilities (-3.3%)

5. Portsmouth, NH-ME
> Employment change: -1,768 (-2.4%)
> Jan. 2017 employment: 74,624
> Oct. 2017 employment: 72,856
> Unemployment, Oct. 2017: 2.6% (lowest 10%)
> Weakest sector (employment chg.): Trade, transportation, and utilities (-1.1%)
[in-text-ad]

4. Michigan City-La Porte, IN
> Employment change: -1,223 (-2.7%)
> Jan. 2017 employment: 45,178
> Oct. 2017 employment: 43,955
> Unemployment, Oct. 2017: 4.9%
> Weakest sector (employment chg.): Government (-3.1%)

3. Danville, IL
> Employment change: -890 (-2.8%)
> Jan. 2017 employment: 32,311
> Oct. 2017 employment: 31,421
> Unemployment, Oct. 2017: 6.3% (highest 10%)
> Weakest sector (employment chg.): Financial activities (-9.1%)

2. Cheyenne, WY
> Employment change: -1,731 (-3.6%)
> Jan. 2017 employment: 48,028
> Oct. 2017 employment: 46,297
> Unemployment, Oct. 2017: 3.8%
> Weakest sector (employment chg.): Other services (+1.5%)
[in-text-ad-2]

1. Cape Girardeau, MO-IL
> Employment change: -2,708 (-5.8%)
> Jan. 2017 employment: 46,357
> Oct. 2017 employment: 43,649
> Unemployment, Oct. 2017: 3.2% (lowest 25%)
> Weakest sector (employment chg.): Government (-34.9%)
Detailed Findings & Methodology
According to the latest BLS job report, the national employment decline in September was largely because of the impact of hurricanes Irma and Harvey. According to the BLS, the drop was temporary. Metro area employment levels recovered in both states, and no metro areas in Texas and Florida are present on our list of largest employment declines this year.
The steady uptick in employment throughout the year was driven by hiring in the professional and business services industry. Employment in that sector rose 5.2% through October from the start of the year, the largest growth of any industry. In 18 of the 25 metro areas adding the most jobs, however, the mining, logging, and construction sectors drove employment growth. In metro regions with falling employment, the trade, transportation, and utilities sector was most often the industry driving employment declines.
The fastest-growing industries in cities with fast-growing (or shrinking) employment levels are not necessarily the largest industry by employment in those areas. In fact, either the leisure and hospitality or information sector is the largest employer in every metro on these lists, regardless of whether metro employment levels grew or declined.
Despite the healthy demand for workers that the rising employment levels suggest, wage growth has been comparatively weak. Average hourly wages for private employees rose by 2.0% this year through October, by 2.4% compared with October 2016, and was unchanged from September. The 2.0% wage growth from January to October is in line with that period historically, but the 2.9% year-over-year in September was considerably better than October’s 2.4% growth. Further, wages have remained unchanged over the previous month this time of year only once in the last decade.
To identify the cities adding (and losing) the most jobs in 2017, 24/7 Wall st. reviewed monthly metro area employment figures from the Bureau of Labor Statistics. We calculated the percentage change from January 2017 through October 2017, the latest month for which employment data at the metro area level is available. All figures are seasonally adjusted. January and October unemployment rates came from the BLS. We identified the industry contributing the most to job growth using employment break downs by sector (NAICS level 2), also from the BLS.
Are you ready for retirement? Planning for retirement can be overwhelming, that’s why it could be a good idea to speak to a fiduciary financial advisor about your goals today.
Start by taking this retirement quiz right here from SmartAsset that will match you with up to 3 financial advisors that serve your area and beyond in 5 minutes. Smart Asset is now matching over 50,000 people a month.
Click here now to get started.
Thank you for reading! Have some feedback for us?
Contact the 24/7 Wall St. editorial team.


 24/7 Wall St.
 24/7 Wall St.
 24/7 Wall St.
 24/7 Wall St.
 24/7 Wall St.