
There are hundreds of major, publicly traded companies in the United States with annual revenues of $1 billion or more. At the helm of each of these corporations is a well-compensated chief executive. The typical CEO of such a company earns $11 million a year — nearly 200 times the $57,617 the typical American household earns a year.
The stark difference in compensation only appears to be growing wider. CEO pay increased by 6% in 2016, compared to a 3% increase in earnings for the typical American household. While many working Americans might receive an annual cost of living salary bump, CEOs are used to far bigger raises. Even some of those that rank among the highest paid more than doubled their earnings in 2016 compared to the previous year.
24/7 Wall St. reviewed CEO compensation for the 200 largest publicly traded U.S. companies by revenue to identify the highest paid chief executive officers. Compensation figures, which include salaries, bonuses, incentives, and stock options, came from Equilar, an executive compensation data firm.
Few would disagree that CEOs — particularly those at the helm of large publicly traded companies that employ thousands of Americans — shoulder more responsibility and face greater pressures than the average worker. Accountable to their employees, shareholders, and customers, CEOs could be held culpable for low worker morale, falling returns on Wall Street, and poor customer experiences — among countless other issues.
Whether or not such pressures warrant eight-figure paychecks is a matter for debate. Still, for many of those with the top job at some of America’s largest companies, $11 million is a pittance. Dozens of large U.S. companies compensate their chief executives well in excess of $20 million per year.
Click here to see the highest paid CEOs.
Click here to see our detailed findings and methodology.
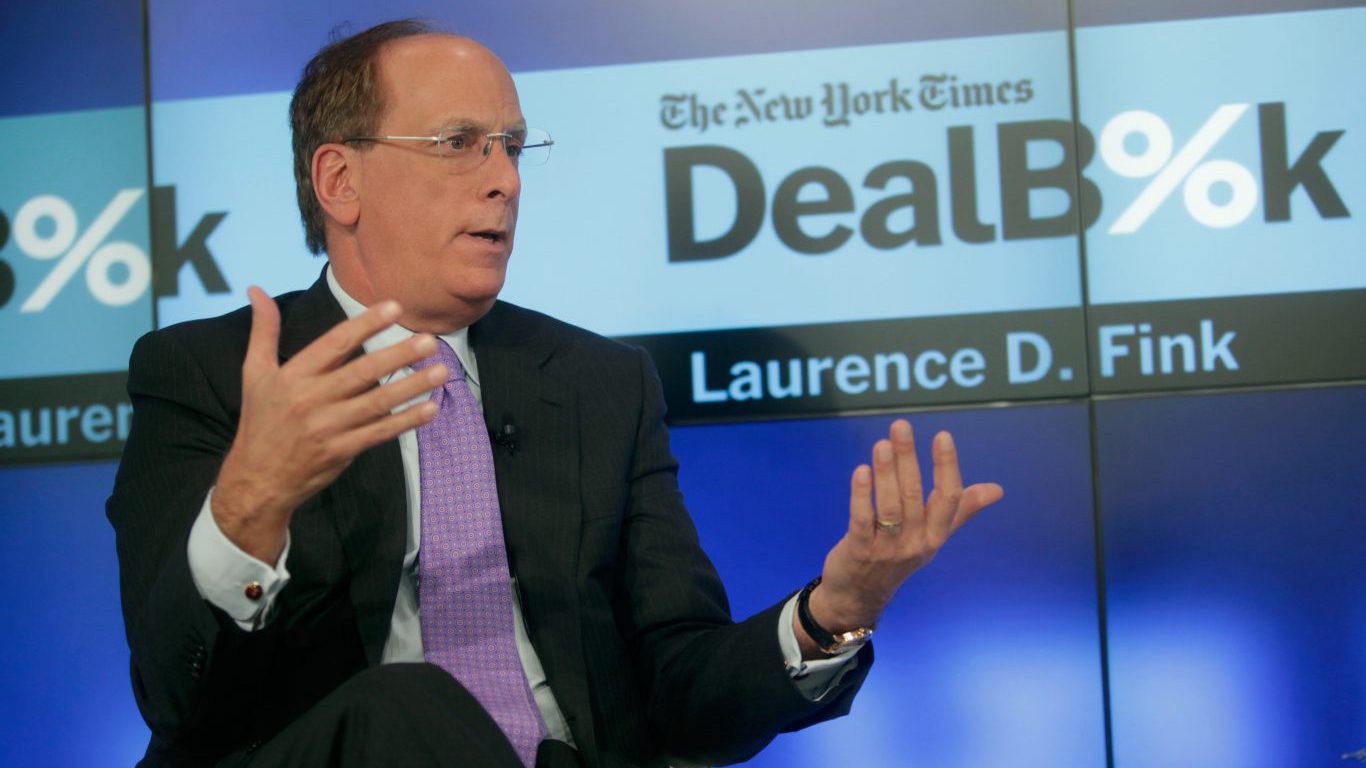
Source: Thos Robinson / Getty Images
25. Laurence D. Fink
> Company: BlackRock (BLK)
> Annual compensation: $25.5 million
> Year-over-year compensation change: -1%
> Revenue: $11.0 billion
[in-text-ad]

Source: Spencer Platt / Getty Images
24. John D. Wren
> Company: Omnicom Group (OMC)
> Annual compensation: $26.0 million
> Year-over-year compensation change: +10%
> Revenue: $15.4 billion

Source: Courtesy of Roper Technologies
23. Brian D. Jellison
> Company: Roper Technologies (ROP)
> Annual compensation: $26.3 million
> Year-over-year compensation change: +13%
> Revenue: $3.8 billion

Source: Larry Busacca / Getty Images
22. Kenneth W. Lowe
> Company: Scripps Networks Interactive (SNI)
> Annual compensation: $26.8 million
> Year-over-year compensation change: +234%
> Revenue: $3.4 billion
[in-text-ad-2]

Source: Scott Olson / Getty Images
21. James Dimon
> Company: JPMorgan Chase (JPM)
> Annual compensation: $27.2 million
> Year-over-year compensation change: +49%
> Revenue: $90.3 billion

Source: uci.edu
20. James J. Peterson
> Company: Microsemi (MSCC)
> Annual compensation: $28.0 million
> Year-over-year compensation change: +277%
> Revenue: $1.8 billion
[in-text-ad]

Source: Ethan Miller / Getty Images
19. Dion J. Weisler
> Company: HP (HPQ)
> Annual compensation: $28.2 million
> Year-over-year compensation change: N/A
> Revenue: $52.1 billion
 24/7 Wall St.
Source: Joe Corrigan / Getty Images
18. Stephen A. Wynn
> Company: Wynn Resorts (WYNN)
> Annual compensation: $28.2 million
> Year-over-year compensation change: +36%
> Revenue: $4.5 billion

Source: willistowerswatson.com
17. John J. Haley
> Company: Willis Towers Watson (WLTW)
> Annual compensation: $28.2 million
> Year-over-year compensation change: N/A
> Revenue: $7.9 billion
[in-text-ad-2]

Source: regeneron.com
16. Leonard S. Schleifer
> Company: Regeneron Pharmaceuticals (REGN)
> Annual compensation: $28.3 million
> Year-over-year compensation change: -40%
> Revenue: $4.9 billion

Source: Flickr via The Cable Show
15. Brian L. Roberts
> Company: Comcast (CMCSA)
> Annual compensation: $28.6 million
> Year-over-year compensation change: +4%
> Revenue: $80.4 billion
[in-text-ad]

Source: Drew Angerer / Getty Images
14. Gregory B. Maffei
> Company: Liberty Media & Liberty Interactive (LMCA & QVCA)
> Annual compensation: $29.8 million
> Year-over-year compensation change: +11%
> Revenue: $5.3 billion
 24/7 Wall St.
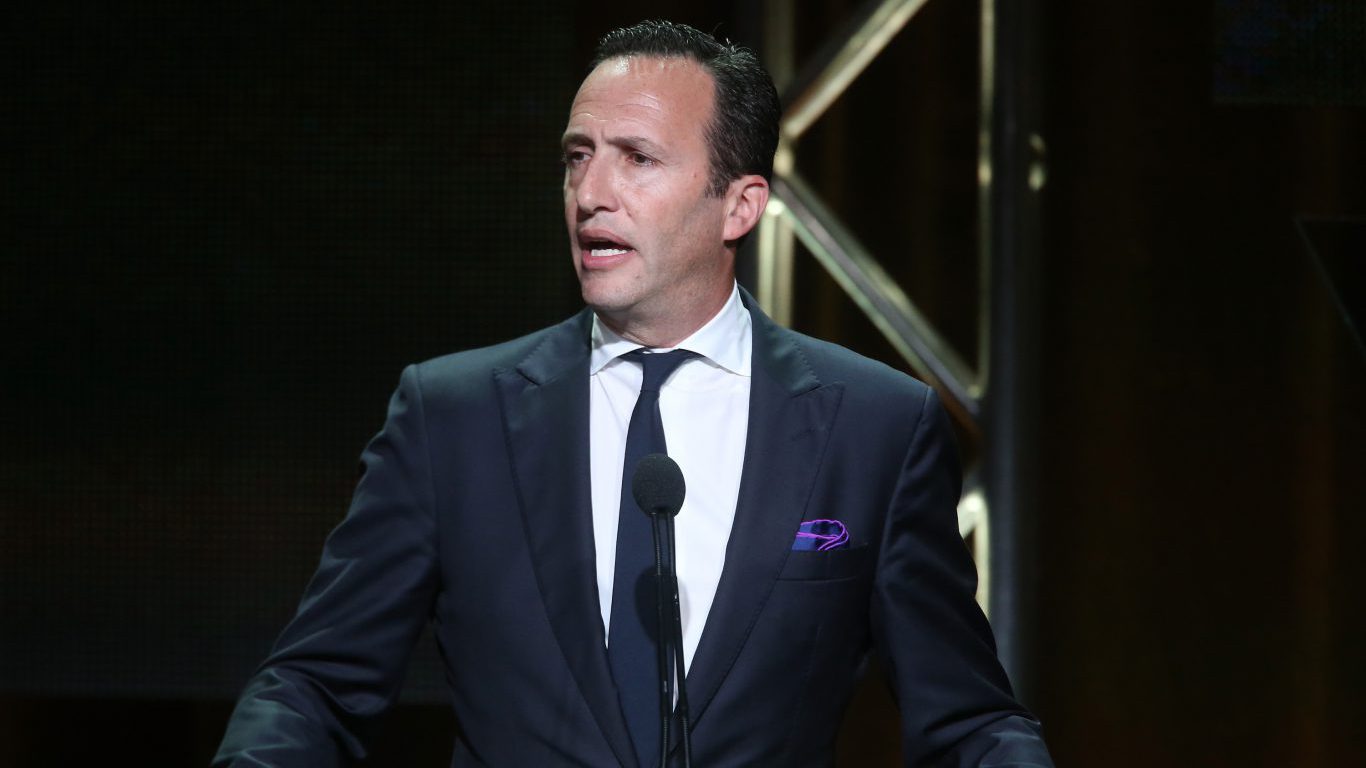
Source: Frederick M. Brown / Getty Images
13. Joshua W. Sapan
> Company: AMC Networks (AMCX)
> Annual compensation: $30.5 million
> Year-over-year compensation change: +72%
> Revenue: $2.8 billion

Source: Ethan Miller / Getty Images
12. Virginia M. Rometty
> Company: International Business Machines (IBM)
> Annual compensation: $32.3 million
> Year-over-year compensation change: +63%
> Revenue: $79.9 billion
[in-text-ad-2]

Source: Drew Angerer / Getty Images
11. Jeffrey L. Bewkes
> Company: Time Warner (TWX)
> Annual compensation: $32.6 million
> Year-over-year compensation change: +3%
> Revenue: $29.3 billion

Source: Max Morse / Wikimedia Commons
10. Margaret C. Whitman
> Company: Hewlett Packard Enterprise (HPE)
> Annual compensation: $32.9 million
> Year-over-year compensation change: +93%
> Revenue: $28.9 billion
[in-text-ad]

Source: Mike Windle / Getty Images
9. Robert A. Kotick
> Company: Activision Blizzard (ATVI)
> Annual compensation: $33.1 million
> Year-over-year compensation change: +358%
> Revenue: $6.6 billion

Source: Roy Rochlin / Getty Images
8. David M. Zaslav
> Company: Discovery Communications (DISCA)
> Annual compensation: $37.2 million
> Year-over-year compensation change: +15%
> Revenue: $6.5 billion

Source: https://www.flickr.com/photos/oracle_images/
7. Safra A. Catz
> Company: Oracle (ORCL)
> Annual compensation: $40.9 million
> Year-over-year compensation change: N/A
> Revenue: $37.7 billion
[in-text-ad-2]

Source: Angela George / Wikimedia Commons
6. Robert A. Iger
> Company: Walt Disney (DIS)
> Annual compensation: $41.0 million
> Year-over-year compensation change: -6%
> Revenue: $55.1 billion
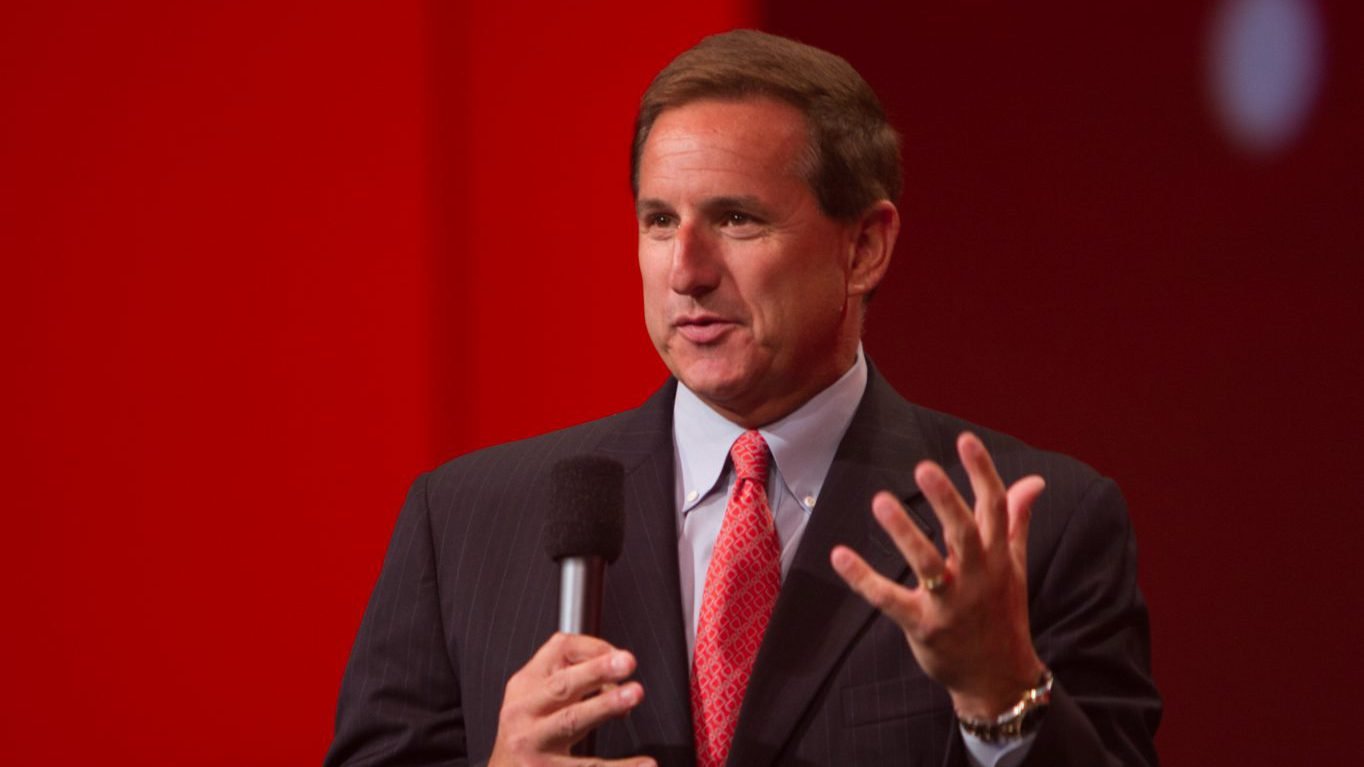
Source: Oracle PR from Redwood Shores, Calif., USA / Wikimedia Commons
5. Mark V. Hurd
> Company: Oracle (ORCL)
> Annual compensation: $41.1 million
> Year-over-year compensation change: N/A
> Revenue: $37.7 billion
[in-text-ad]

Source: World Economic Forum / Wikimedia Commons
4. Mark G. Parker
> Company: Nike (NKE)
> Annual compensation: $47.6 million
> Year-over-year compensation change: +183%
> Revenue: $34.4 billion
 24/7 Wall St.
Source: Theo Wargo / Getty Images
3. Fabrizio Freda
> Company: Estee Lauder (EL)
> Annual compensation: $47.7 million
> Year-over-year compensation change: +196%
> Revenue: $11.8 billion

Source: Neilson Barnard / Getty Images
2. Leslie Moonves
> Company: CBS (CBS)
> Annual compensation: $68.6 million
> Year-over-year compensation change: +22%
> Revenue: $13.2 billion
[in-text-ad-2]

Source: newsroom.charter.com
1. Thomas M. Rutledge
> Company: Charter Communications (CHTR)
> Annual compensation: $98.0 million
> Year-over-year compensation change: +499%
> Revenue: $29.0 billion
Detailed findings & methodology
For most working Americans, wages and salaries account for the vast majority of total income in a given year. For CEOs, base salary typically comprises only a small fraction of annual compensation. For example, Thomas Rutledge, chairman and CEO of Charter Communications, earned a $2 million salary in 2016 and nearly $90 million in stocks and options. All told, Rutledge’s base salary accounted for only about 2% of his total annual compensation.
While Rutledge earned more in 2016 than any other public CEO in the United States, he is not an outlier. Base salary accounted for a small fraction of total compensation for every chief executive on this list.
It is no accident that such a small share of total compensation comes from salary. According to analysis provided by Equilar, CEO compensation is increasingly designed to be performance based — rising and falling with certain metrics such as revenue. For example, Charter Communications’ revenue climbed by nearly 200% in 2016 — the largest gain among the 200 largest publicly traded U.S. companies. Likely heavily tied to corporate performance, Rutledge’s compensation soared by about 500% over the same period.
To identify the highest paid CEOs, 24/7 Wall St. reviewed total compensation packages for CEOs at the 200 largest public companies by revenue in the United States that filed proxy statements covering 2016 before May 1, 2017 from executive-level data collector Equilar. Year-over-year changes in compensation also came from Equilar.
Total compensation is defined as salary, bonus, stock and options valued at grant date, and other compensation as disclosed in the summary compensation table of company proxy statements and excludes pension and deferred compensation values. Annual revenue figures are for the latest available fiscal year and come from financial reports filed with the Securities and Exchange Commission.
Essential Tips for Investing: Sponsored
A financial advisor can help you understand the advantages and disadvantages of investment properties. Finding a qualified financial advisor doesn’t have to be hard. SmartAsset’s free tool matches you with up to three financial advisors who serve your area, and you can interview your advisor matches at no cost to decide which one is right for you. If you’re ready to find an advisor who can help you achieve your financial goals, get started now.
Investing in real estate can diversify your portfolio. But expanding your horizons may add additional costs. If you’re an investor looking to minimize expenses, consider checking out online brokerages. They often offer low investment fees, helping you maximize your profit.
Thank you for reading! Have some feedback for us?
Contact the 24/7 Wall St. editorial team.
Editors' Picks

