Special Report
States With the Strongest and Weakest Unions

Published:
Last Updated:
Labor unions exist to increase the collective bargaining power of their members to negotiate higher wages and better benefits. And historically, they have done just that. According to the Bureau of Labor Statistics, the typical non-union worker earns just 80% of what the typical unionized worker earns on a weekly basis. Labor unions have also helped to greatly improve benefits and reduce pay inequality along racial and gender lines.
While unions can provide some benefits to workers, anti-union advocates argue that unions stifle economic growth, limit corporate competitiveness, and unfairly pass higher costs down to the consumer or taxpayer. In an increasingly competitive and interconnected global economy, union membership is eroding in the United States. Today, just 10.7% of the U.S. workforce is unionized, down from 24.0% in 1973.
Labor unions are an inherently political issue, and some states are more likely to be receptive to collective bargaining than others. 24/7 Wall St. reviewed data from the BLS to identify the states where union membership is the strongest and weakest. In some states — many of which are concentrated in the West and the Northeast — union membership rates are high, near levels not seen nationwide since the 1970s. However, in other states — many of which are in the South — union membership rates are less than half the comparable national rate.
Click here to see the states with the strongest unions.
Click here to see the states with the weakest unions.
Click here to see our detailed findings and methodology.
States With the Strongest Unions
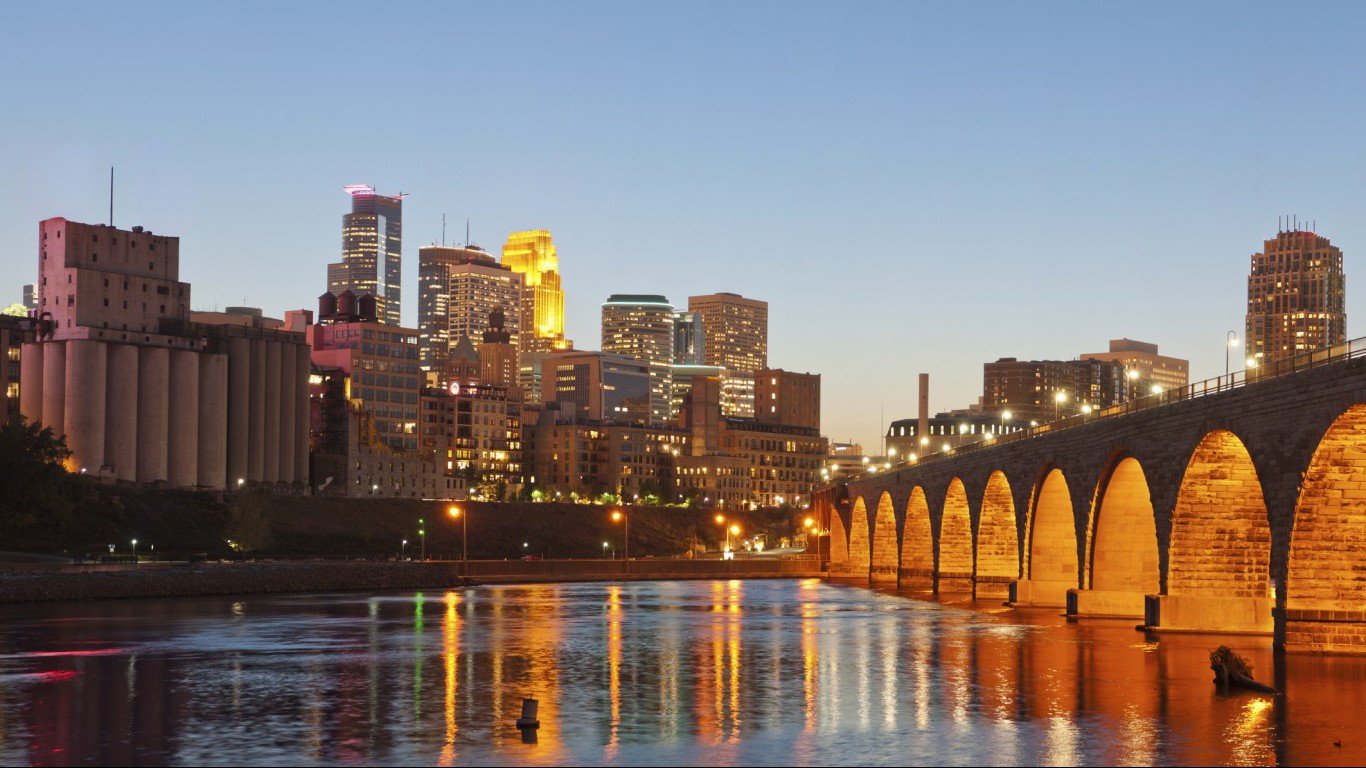
10. Minnesota
> Pct. of workers in unions: 15.2%
> Union workers 410,578 (11th most)
> 10-yr. change in union membership: +2.5% (17th highest)
> Avg. annual wage: $53,445 (13th highest)
The union membership rate — the share of workers who are union members — in Minnesota fell by 1.1 percentage points over the last decade. The decline was not attributable to less union members, however, as the number of unionized workers in the state increased from about 400,000 to nearly 411,000 over the same period. Rather, the union participation rate did not keep pace with overall workforce growth. Today, Minnesota’s 15.2% union membership rate is the 10th highest among states.
Like nearly every other state with high union participation rates, Minnesota is not a right-to-work state, meaning union membership may be a precondition for employment in certain jobs.
[in-text-ad]
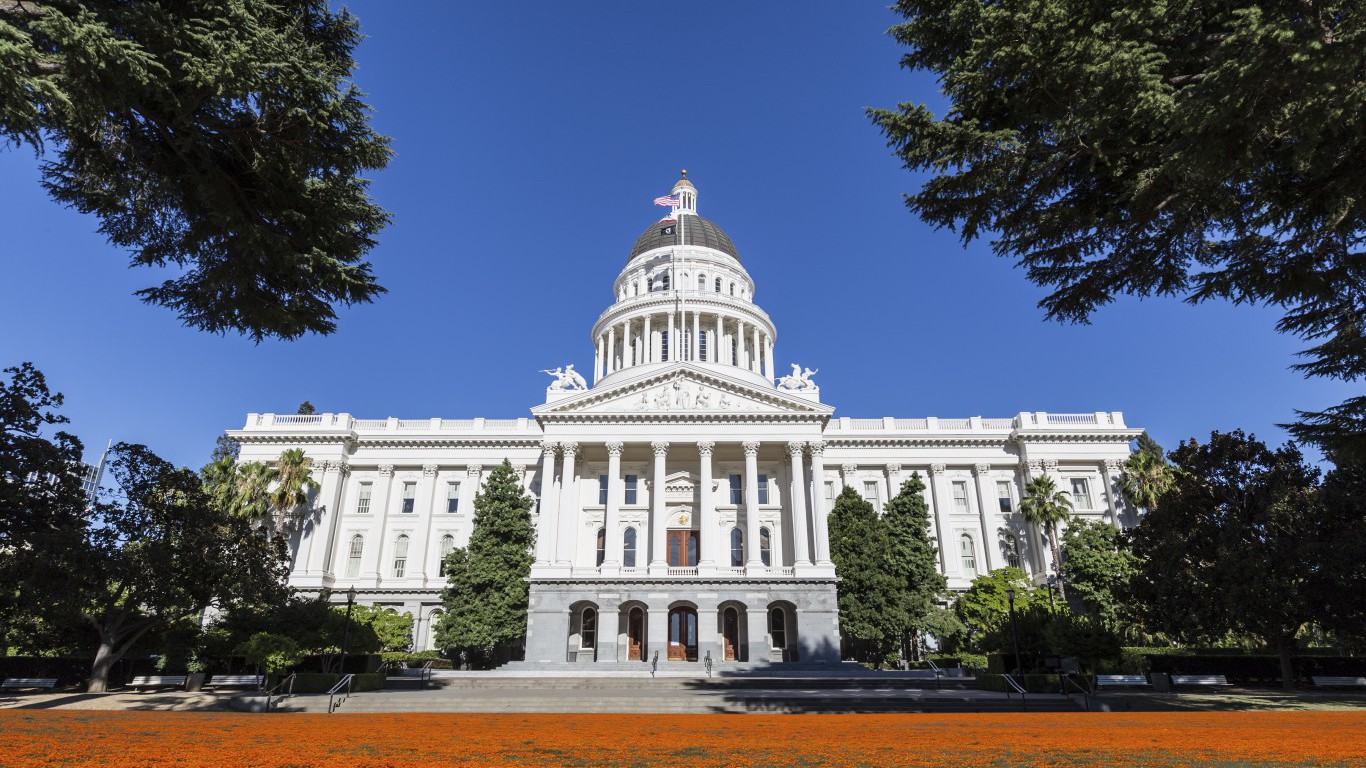
9. California
> Pct. of workers in unions: 15.5%
> Union workers 2,489,184 (the most)
> 10-yr. change in union membership: +0.6% (18th highest)
> Avg. annual wage: $63,409 (4th highest)
As the most populous state in the country, it should come as no surprise that California also is home to the most union members of any state — at nearly 2.5 million. As a share of the state’s labor force, however, union workers account for 15.5%, only the ninth largest share among states. In keeping with the national trend, the number of union members in California’s private sector fell 6.7% over the last decade. However, among public sector workers, the number of union members climbed by 7.5% over the same period even as it fell 4.6% nationwide.
One of a labor union’s primary functions is to provide workers with greater bargaining power for higher wages. According to the BLS, the typical nonunion worker earns 80% of what the typical unionized worker earns in a given week. Though union membership is one of the many factors affecting wages, high union participation rates in California may explain the state’s high average annual wage — which at $63,409 is higher than that of all but three other states.

8. Michigan
> Pct. of workers in unions: 15.6%
> Union workers 659,285 (5th most)
> 10-yr. change in union membership: -19.5% (11th lowest)
> Avg. annual wage: $50,552 (19th highest)
Michigan’s union membership rate fell by 3.9 percentage points over the last decade, nearly the largest decline of any state. Waning union participation is likely due in large part to changes in the state’s laws. A bill signed in late 2012 made Michigan the 24th state in the country to adopt so-called right-to-work legislation, meaning employers cannot make union membership a mandatory prerequisite to employment. Michigan is the only right-to-work state where over 15% of the labor force are union members.
Michigan’s construction industry bucked the broader trend of declining unionization. The union membership rate among private sector construction workers in the state climbed from 20% in 2007 to nearly 26% in 2017, even as private sector construction union membership remained effectively flat over the same period nationally.
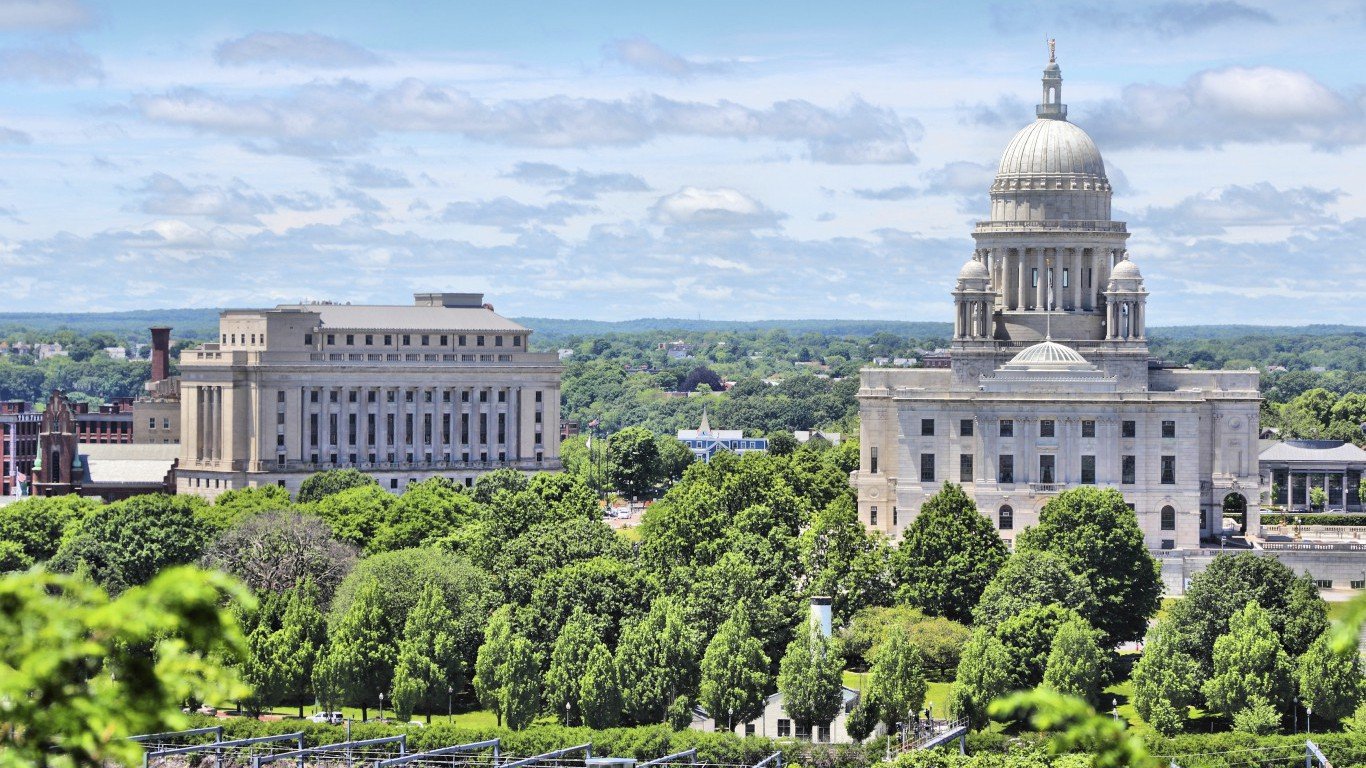
7. Rhode Island
> Pct. of workers in unions: 16.1%
> Union workers 78,224 (19th fewest)
> 10-yr. change in union membership: +5.0% (15th highest)
> Avg. annual wage: $52,109 (16th highest)
In a break from the national trend of declining unionization, union membership climbed from 15.0% to 16.1% of the Rhode Island workforce over the last decade. The public and private sectors in the state each netted some 2,000 new union members since 2007.
Largely because most teachers are public sector workers, workers in education are among the most likely to be union members. In Rhode Island, 28.3% of the labor force work in educational, health care, and social services — the largest such share of any state.
[in-text-ad-2]

6. New Jersey
> Pct. of workers in unions: 16.1%
> Union workers 628,734 (7th most)
> 10-yr. change in union membership: -15.9% (18th lowest)
> Avg. annual wage: $62,222 (5th highest)
Over 16% of workers in New Jersey are card carrying union members, a larger share than in all but five other states and well above the 10.7% share of American workers nationwide. One of the primary functions of a labor union is to increase wages and benefits for members, and high union participation rates in the state could help explain the higher than average earnings. The average annual salary in the Garden State is $62,222, about $8,400 more than the average annual wage nationwide.
Even union strongholds like New Jersey are not immune to the broad trend of declining membership. The union membership rate declined by 3.1 percentage points in the last decade, more than double the 1.4 percentage point decline nationwide.

5. Connecticut
> Pct. of workers in unions: 17.0%
> Union workers 278,874 (14th most)
> 10-yr. change in union membership: +10.2% (10th highest)
> Avg. annual wage: $64,904 (3rd highest)
Connecticut is one of only three states — all of which are in New England — to report an uptick in union participation of over 1 percentage point over the past decade. Workers in the public sector are far more likely to be union members partially because government institutions are not at risk of going out of business or being undercut by competitors with non-unionized workers. The number of public sector union members increased by 15.2% in Connecticut, driving overall union participation up from 15.6% of the state’s workforce to 17.0% between 2007 and 2017.
In February 2018, state unions organized rallies in several cities, hoping to influence a case currently being decided by the U.S. Supreme Court, which could make paying union dues optional for some government employees.Such a decision could weaken the power of labor unions considerably.
[in-text-ad]
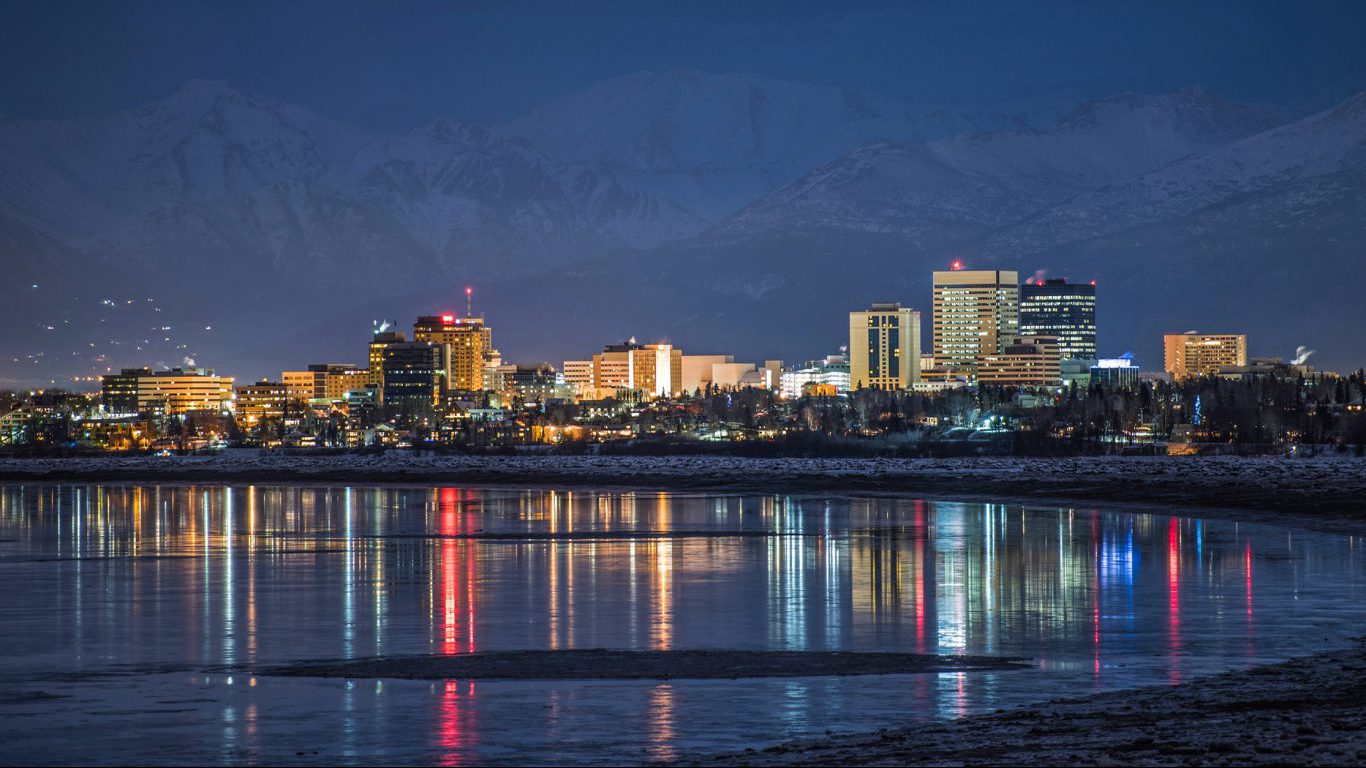
4. Alaska
> Pct. of workers in unions: 18.1%
> Union workers 54,960 (11th fewest)
> 10-yr. change in union membership: -18.6% (12th lowest)
> Avg. annual wage: $56,838 (9th highest)
Alaska’s union membership rate fell by 5.7 percentage points over the last decade, the second steepest decline of any state. The decline was largely the result of falling membership in the private sector. There were about 7,300 fewer unionized private sector workers in Alaska in 2017 than there were 10 years prior. Union membership in private sector manufacturing fell from 14.2% of sector workers to 0% over the same period.
Despite the decline, 18.1% of all workers in Alaska are union members, a larger share than in all by three other states. Public sector workers are far more likely than private sector workers to be union members, and a nation-leading 26.8% of workers in Alaska are government employees.
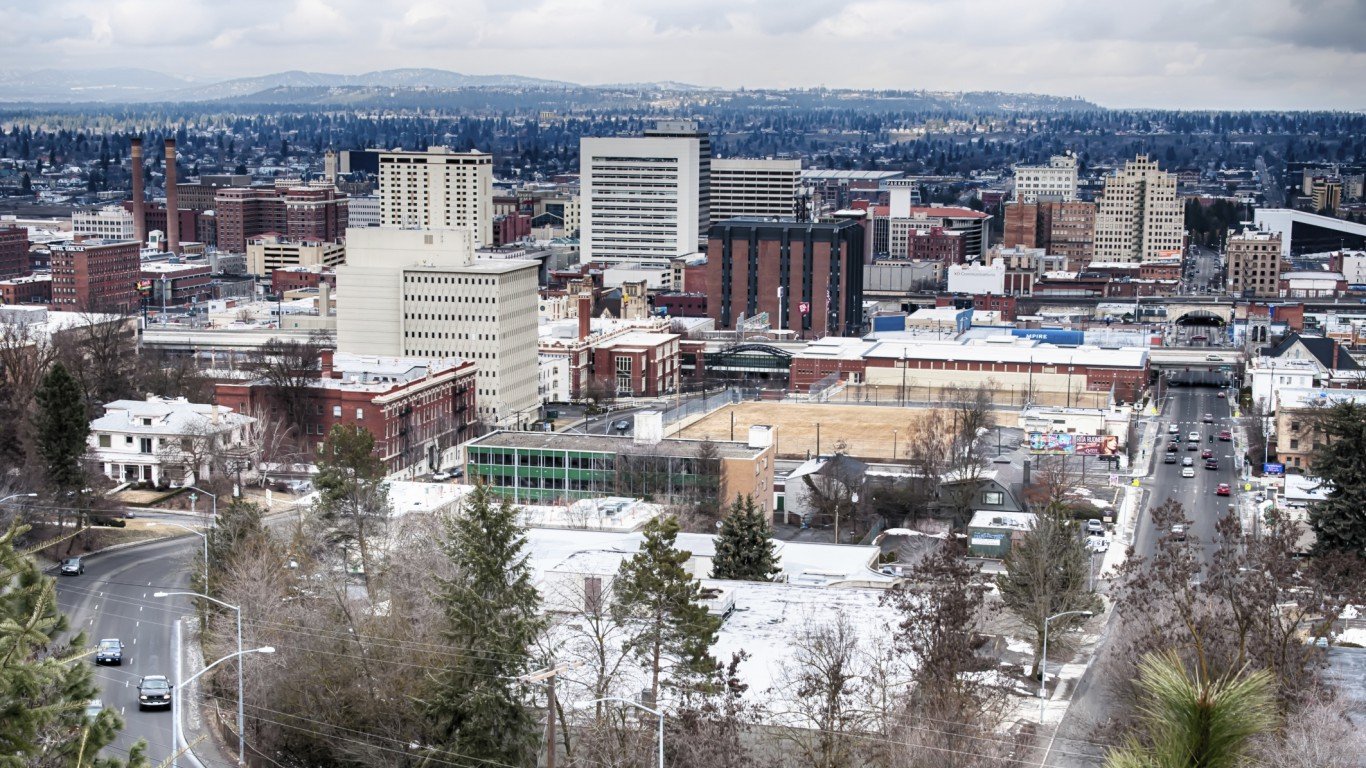
3. Washington
> Pct. of workers in unions: 18.7%
> Union workers 582,749 (8th most)
> 10-yr. change in union membership: +0.6% (19th highest)
> Avg. annual wage: $58,977 (7th highest)
Labor comprises a relatively small share of production costs in the manufacturing industry. As a result, manufacturing workers could easily organize to demand higher wages without hurting their employers profits. Indeed, historically, manufacturing has had some of the strongest union participation rates of any industry in the private sector. In Washington, 23.2% of private sector manufacturing workers are union members, the largest share of any state. Currently, 18,7% of all workers in the state are union members.
Strong union participation in the state may partially explain the high wages. The average annual wage in Washington is $59,000, more than in all but six other states.

2. Hawaii
> Pct. of workers in unions: 21.3%
> Union workers 128,896 (24th fewest)
> 10-yr. change in union membership: -1.1% (21st highest)
> Avg. annual wage: $49,601 (21st highest)
Public sector workers are far more likely than private sector workers to unionize, and in Hawaii, 19.6% of all workers are government employees — a larger share than in the vast majority of states. Partially as a result, 21.3% of all workers in the state are union members, the second largest share among states.
Still, because of its size, the private sector accounts for the majority of union members in Hawaii. The state’s construction industry in particular is heavily unionized. More than one-third of all private sector construction workers are union members, the second largest share of any state.
[in-text-ad-2]

1. New York
> Pct. of workers in unions: 23.8%
> Union workers 2,016,437 (2nd most)
> 10-yr. change in union membership: -1.9% (23rd highest)
> Avg. annual wage: $67,266 (the highest)
New York state is a bastion for organized labor. Of all workers in the state, 23.8% are union members, by far the largest share of any state. The primary function of a labor union is to strengthen bargaining power for higher wages and better benefits — and wages in New York are the highest of any state. The average annual wage in New York is $67,266, or about $13,400 more than the national average.
Just over 1 million union members in New York work in the private sector. The state’s construction industry in particular is heavily unionized. Nearly 1 in 4 private sector construction workers in New York are union members compared to only 14.0% of private construction workers nationwide.
States With the Weakest Unions

10. North Dakota
> Pct. of workers in unions: 5.1%
> Union workers 18,002 (2nd fewest)
> 10-yr. change in union membership: -7.1% (24th lowest)
> Avg. annual wage: $48,151 (24th lowest)
Only about 5% of all workers in North Dakota are union members, less than half the 10.7% share nationwide. Like most states with low union participation rates, North Dakota is a right-to-work state, meaning employment can never be contingent on union membership.
Anti-union advocates argue that labor unions hinder growth and limit the ability of companies to be competitive. While union participation is just one among many socioeconomic factors that can impact the health of a job market, only 2.6% North Dakota’s labor force were out of work in 2017, the second lowest annual unemployment rate among states.
[in-text-ad]

9. Idaho
> Pct. of workers in unions: 4.8%
> Union workers 34,759 (5th fewest)
> 10-yr. change in union membership: +4.1% (16th highest)
> Avg. annual wage: $40,505 (2nd lowest)
Just 4.8% of the workforce in Idaho are union members, the ninth smallest share among states. The primary function of a union is to increase the bargaining power of laborers to negotiate higher wages. In Idaho, the average worker earns just $40,505 a year, the lowest annual average of any state with the exception of Mississippi.
The manufacturing sector has historically been a bastion for unions, and though union participation in manufacturing is falling nationwide due in part to increased competition from overseas, Idaho is bucking the trend. Private sector manufacturing union membership climbed from 4.1% of sector workers in 2007 to 6.8% in 2017, nearly the largest such increase of any state. Nationwide, union membership in manufacturing fell by 2.2 percentage points to 9.1% over the same period.

8. Texas
> Pct. of workers in unions: 4.7%
> Union workers 542,242 (9th most)
> 10-yr. change in union membership: +17.2% (5th highest)
> Avg. annual wage: $53,838 (12th highest)
In a break from the national trend, the number of union members in Texas climbed 17.2% over the past decade, a greater increase than in the vast majority of states. The increase in union members the state was even across both the public and private sectors. However, the growing ranks of union members merely kept pace with labor force growth, as Texas’ 4.7% union membership rate remained effectively unchanged from a decade ago.
Like many states on this list, Texas prohibits employers from requiring union membership as a precondition to employment. Enacting a statute in 1947, Texas was one of the first states in the country to become a right-to-work state.
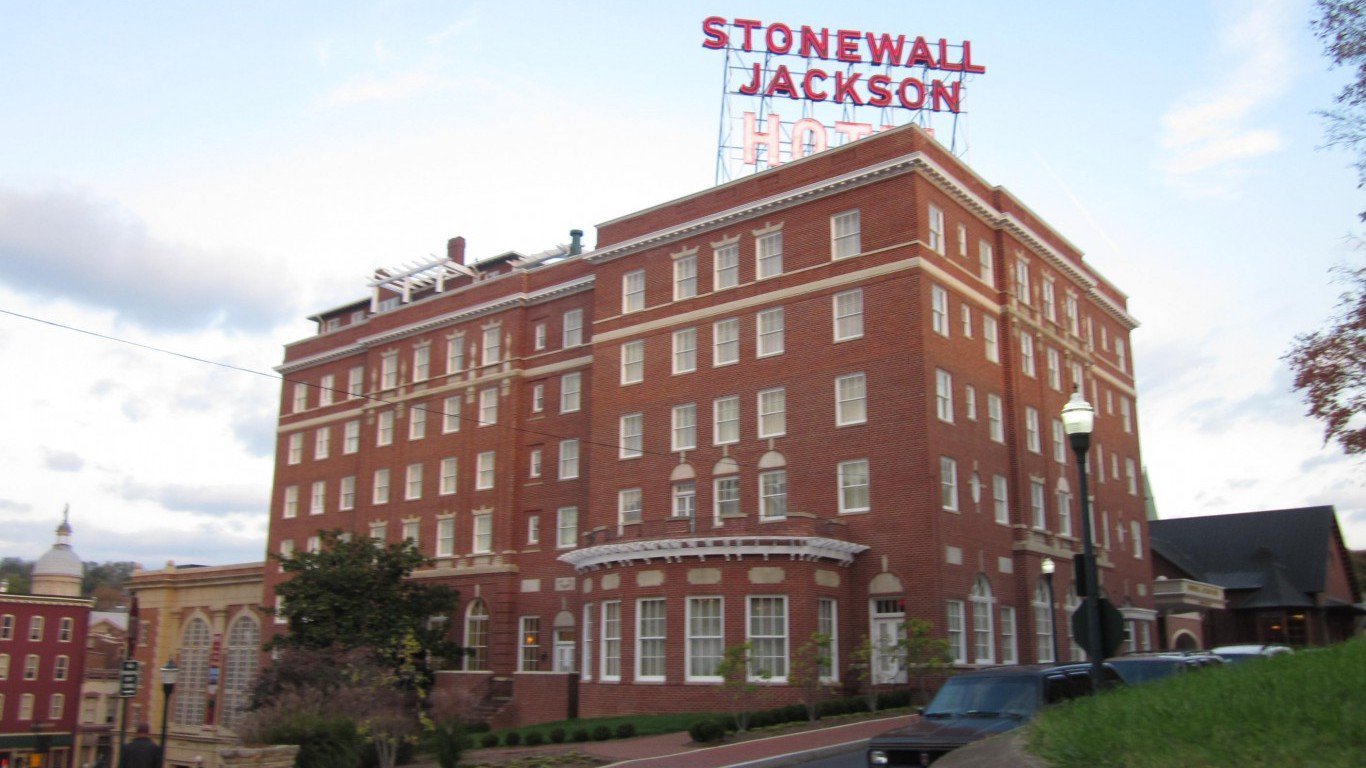
7. Virginia
> Pct. of workers in unions: 4.6%
> Union workers 176,653 (20th most)
> 10-yr. change in union membership: +37.2% (the highest)
> Avg. annual wage: $56,319 (10th highest)
The number of union members climbed by 37.2% in Virginia over the past decade, by far the largest increase of any state. The increase was driven almost exclusively by the state’s public sector. There are currently over 101,000 card carrying union members in Virginia’s public sector, up 68% from the 60,300 members in 2007. Despite climbing participation, Virginia’s 4.6% union membership rate remains among the lowest of any state.
Historically opposed to unionization, Virginia became a right-to-work state in 1947 — meaning union membership has not been a prerequisite for any job for over 70 years.
[in-text-ad-2]

6. Louisiana
> Pct. of workers in unions: 4.4%
> Union workers 77,910 (18th fewest)
> 10-yr. change in union membership: -16.9% (16th lowest)
> Avg. annual wage: $46,643 (20th lowest)
Right-to-work laws can diminish the power of labor unions considerably over time. Louisiana has been a right-to-work state for over 40 years. Partially due to the state’s anti-union policies, only 4.4% of workers in Louisiana are union members, the sixth smallest share of any state.
Union membership has fallen precipitously in Louisiana in recent years. There are only about 77,900 union members in Louisiana, down 16.9% from the 93,800 in 2007. The number of union members in Louisiana declined faster than it did nationwide. The number of union members nationwide fell by 5.5% over the same period.

5. Arizona
> Pct. of workers in unions: 4.0%
> Union workers 111,840 (23rd fewest)
> 10-yr. change in union membership: -51.3% (the lowest)
> Avg. annual wage: $49,432 (22nd highest)
Union membership is eroding faster in Arizona than in any other state. Over the last decade, the number of union members was more than cut in half, from 229,600 in 2007 to 111,800 in 2017. Union membership is all but gone in the state’s private sector construction and manufacturing industries — which historically have been bastions of union membership. Over the last decade, union membership rates in construction and manufacturing have each fallen to below 2% from 8.4% and 7.1%, respectively.
Implementing right-to-work laws in 1946, Arizona has had anti-union policies for over 70 years.
[in-text-ad]
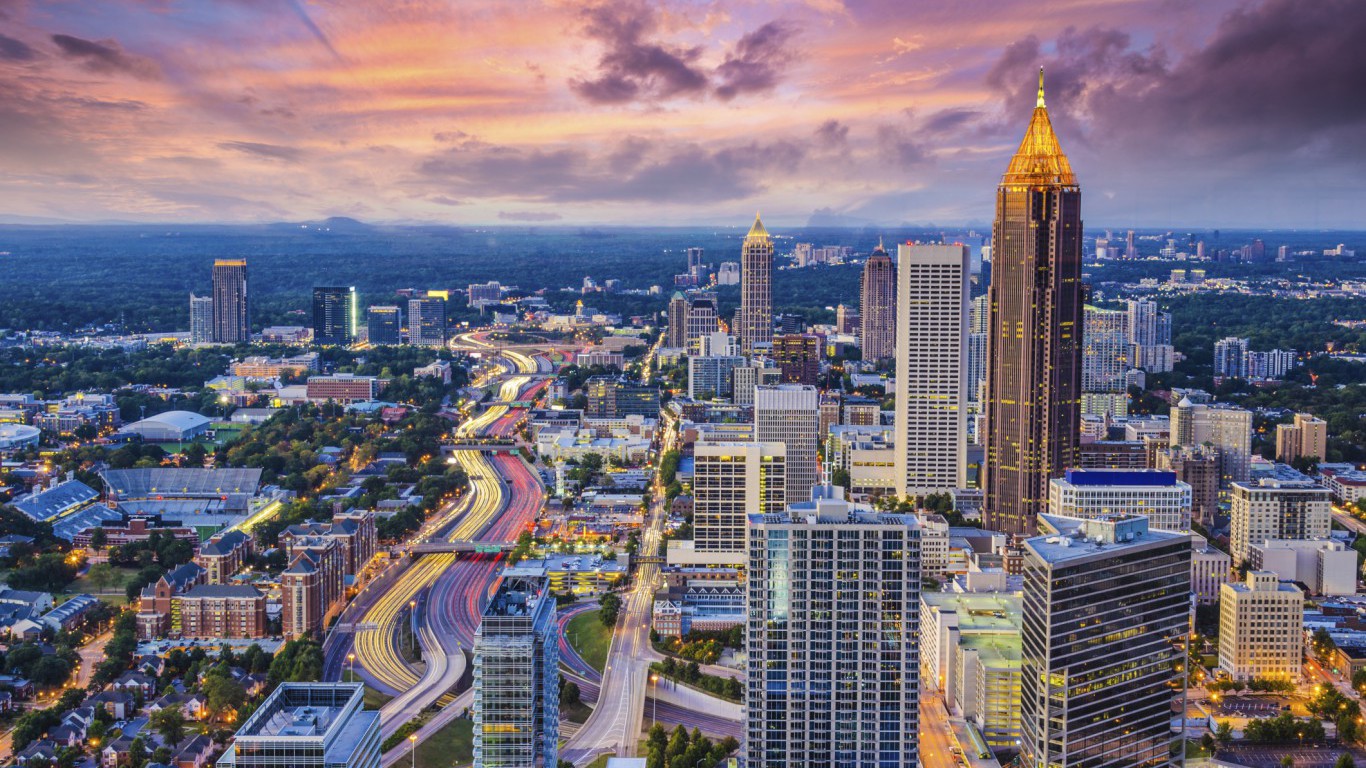
4. Georgia
> Pct. of workers in unions: 4.0%
> Union workers 172,589 (22nd most)
> 10-yr. change in union membership: -7.0% (25th lowest)
> Avg. annual wage: $51,572 (17th highest)
Only 4% of the workforce in Georgia is unionized, the fourth smallest share of any state. The primary purpose of a union is to increase members’ bargaining power when it comes to wage negotiation, and the low union membership rate in Georgia may partially explain lower than average wages in the state. The average annual wage of only $51,572 is about $2,300 less than the average wage nationwide.
Historically, the manufacturing industry has reported higher than average union membership. However, due in part to increased competition abroad, union membership in manufacturing is eroding nationwide. Currently, only 3.7% of private sector manufacturing workers in Georgia are union members, well below the comparable 9.1% share nationwide.
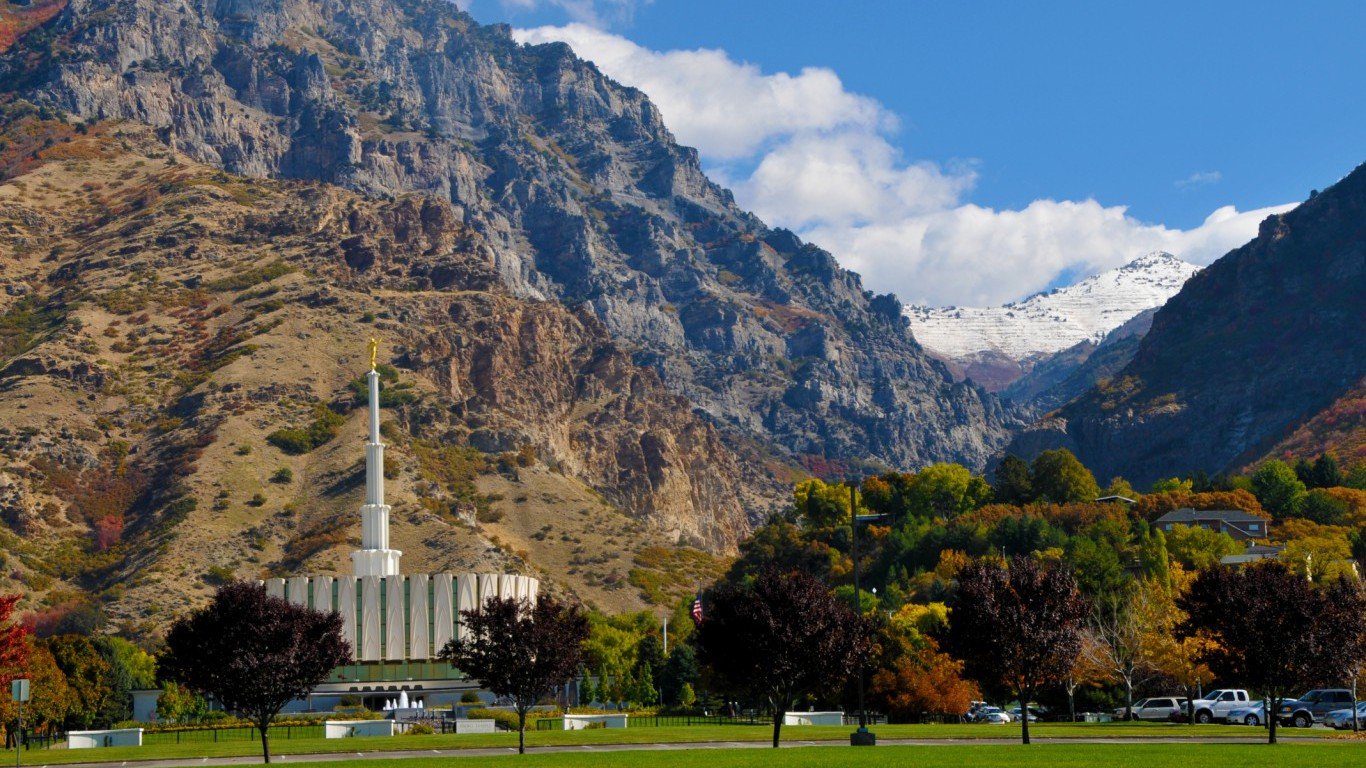
3. Utah
> Pct. of workers in unions: 3.9%
> Union workers 54,083 (10th fewest)
> 10-yr. change in union membership: -19.8% (10th lowest)
> Avg. annual wage: $46,178 (19th lowest)
The number of union members fell by 20% in Utah over the last decade, more than triple the corresponding decline nationwide. Like every other state on this list, Utah is a right-to-work state, meaning union membership can never be a precondition for employment.
Anti-union advocates argue that labor unions hinder growth and limit the ability of companies to be competitive. While union participation is just one of many socioeconomic factors that can impact the health of a job market, only 3.2% Utah’s labor force were jobless in 2017, one of the lowest annual unemployment rates among states.

2. North Carolina
> Pct. of workers in unions: 3.4%
> Union workers 144,232 (25th most)
> 10-yr. change in union membership: +26.9% (2nd highest)
> Avg. annual wage: $48,207 (25th lowest)
Just 3.4% of workers in North Carolina are union members, the smallest share in the country after only South Carolina. Historically, construction and manufacturing have been relatively highly unionized industries. In North Carolina, however, just 0.8% of private sector construction workers and 2.2% of private sector manufacturing workers are union members — each among the smallest such shares of any state.
In a break from the national trend, union membership is on the rise in the Tar Heel State. Over the past decade, the number of union members climbed from 113,600 to 144,200. The 26.9% increase was the second largest among states.
[in-text-ad-2]
1. South Carolina
> Pct. of workers in unions: 2.6%
> Union workers 52,209 (9th fewest)
> 10-yr. change in union membership: -32.7% (3rd lowest)
> Avg. annual wage: $44,134 (12th lowest)
Union membership has been eroding nationwide for decades. In recent years, few states have reported as steep a decline in overall membership as South Carolina. At 52,209, the number of union members in the state is down 32.7% from a decade ago. Today, only 2.6% of workers in the state are union members, the smallest share of any state. Like every other state on this list, South Carolina is a right-to-work state.
The primary purpose of a union is to increase members’ bargaining power when it comes to wage negotiation — and the low union membership in South Carolina may partially explain the low wages in the state. The average annual wage of only $44,134 is about $9,700 less than the average wage nationwide.
Detailed Findings & Methodology
Declining union membership nationwide has been precipitated in part by an increasing number of states passing right-to-work laws. A right-to-work state is one in which union membership cannot be a precondition to employment. In states without right-to-work laws, unions often have more power, as they can compel workers in certain jobs to pay membership dues. Currently, 28 states are right-to-work states. Kentucky and Missouri are the most recent additions, passing right-to-work laws in 2017.
In an interview with 24/7 Wall St., David Macpherson, E.M. Stevens Professor and Economics Department Chair at Trinity University, explained that right-to-work laws can reflect overall attitudes towards unions in a given state. “[Right-to-work laws] look like they have been more effective than they really are because the areas that have passed them are some of the ones that tend to be not favorable towards unions anyway,” Macpherson said.
Still, over time, right-to-work laws can erode collective bargaining powers considerably. Each of the 10 states with the lowest union membership rates are right-to-work states and have been for decades. Meanwhile, Michigan is the only right-to-work state with a relatively strong union membership rate.
Some patterns in collective bargaining are true across virtually all states, regardless of overall union membership. For example, workers in the public sector are far more likely to unionize than those in the private sector. According to Macpherson, this is largely because public sector institutions do not have to worry about going out of business. “If you raise wages in the private sector too much, non-union firms are going to undercut you and have you go under,” Macpherson said. “But in the public sector, you can raise wages and just pass those costs on to the taxpayer.”
Based on figures published by Unionstats.com, an online union membership and coverage database, 24/7 Wall St. identified the states with the highest and lowest union membership as a percentage of total employment. The database, which analyzes Bureau of Labor Statistics’ Current Population Survey, provides labor force and union membership figures in both the public and private sectors, including manufacturing and construction. Additionally, 24/7 Wall St. reviewed annual average unemployment rates for each state from the BLS. Annual average wages by state came from Bureau of Economic Analysis. Rates of change were calculated over the period of 2007 to 2017.
Are you ready for retirement? Planning for retirement can be overwhelming, that’s why it could be a good idea to speak to a fiduciary financial advisor about your goals today.
Start by taking this retirement quiz right here from SmartAsset that will match you with up to 3 financial advisors that serve your area and beyond in 5 minutes. Smart Asset is now matching over 50,000 people a month.
Click here now to get started.
Thank you for reading! Have some feedback for us?
Contact the 24/7 Wall St. editorial team.


 24/7 Wall St.
 24/7 Wall St.