
According to a recent Gallup poll, 18% of American workers are worried about losing their job — down from a peak of 31% in 2009 in the wake of the Great Recession. American workers have good reason to feel secure. The economy has added jobs for the last 100 consecutive months, and the unemployment rate recently hit its lowest point since the 1960s.
Still, while the jobs picture in the United States is encouraging on a broad scale, on a more granular level, certain jobs are inherently less secure than others.
24/7 Wall St. reviewed unemployment rates by occupation from the Bureau of Labor Statistics to identify the occupations with the best and worst job security. The 32 jobs with the highest job security have unemployment rates below 1.0%, while the 32 jobs with the lowest job security have unemployment rates of at least 6.6%.
The jobs with the lowest job security tend to require little education. Many of these jobs are also projected to become less common in the future as automation will reduce hiring demand.
Meanwhile, the most secure jobs typically require at least some college, and often a doctoral or professional degree. Additionally, partially because the government never goes out of business, these jobs are far more likely to be in the public sector, either at the local, state, or federal level.
Jobs With the Best Job Security

Source: andresr / Getty Images
32. Civil engineers
> Unemployment rate: 0.9% (tied – 24th lowest)
> Labor force: 460,000
> Median annual wage: $84,770
> Proj. job growth 2016-2026: +10.6%
> Typical entry level edu. required: Bachelor’s degree

Source: filadendron / Getty Images
31. Dentists
> Unemployment rate: 0.9% (tied – 24th lowest)
> Labor force: 163,000
> Median annual wage: $158,120
> Proj. job growth 2016-2026: +19.1%
> Typical entry level edu. required: Doctoral or professional degree

Source: RichLegg / Getty Images
30. Farmers, ranchers, and other agricultural managers
> Unemployment rate: 0.9% (tied – 24th lowest)
> Labor force: 1.0 million
> Median annual wage: $69,620
> Proj. job growth 2016-2026: -0.8%
> Typical entry level edu. required: High school diploma or equivalent

Source: yacobchuk / iStock
29. First-line supervisors of housekeeping and janitorial workers
> Unemployment rate: 0.9% (tied – 24th lowest)
> Labor force: 342,000
> Median annual wage: $39,230
> Proj. job growth 2016-2026: +9.9%
> Typical entry level edu. required: High school diploma or equivalent

Source: RUBEN RAMOS / iStock
28. First-line supervisors of personal service workers
> Unemployment rate: 0.9% (tied – 24th lowest)
> Labor force: 210,000
> Median annual wage: $37,450
> Proj. job growth 2016-2026: +14.6%
> Typical entry level edu. required: High school diploma or equivalent

Source: FlamingoImages / Getty Images
27. Insurance underwriters
> Unemployment rate: 0.9% (tied – 24th lowest)
> Labor force: 120,000
> Median annual wage: $69,760
> Proj. job growth 2016-2026: -5.2%
> Typical entry level edu. required: Bachelor’s degree

Source: belenox / Getty Images
26. Lawyers
> Unemployment rate: 0.9% (tied – 24th lowest)
> Labor force: 1.2 million
> Median annual wage: $119,250
> Proj. job growth 2016-2026: +8.2%
> Typical entry level edu. required: Doctoral or professional degree

Source: sturti / Getty Images
25. Medical and health services managers
> Unemployment rate: 0.9% (tied – 24th lowest)
> Labor force: 645,000
> Median annual wage: $98,350
> Proj. job growth 2016-2026: +20.5%
> Typical entry level edu. required: Bachelor’s degree

Source: LDProd / Getty Images
24. Personal financial advisors
> Unemployment rate: 0.9% (tied – 24th lowest)
> Labor force: 542,000
> Median annual wage: $90,640
> Proj. job growth 2016-2026: +14.9%
> Typical entry level edu. required: Bachelor’s degree

Source: FatCamera / Getty Images
23. Directors, religious activities and education
> Unemployment rate: 0.8% (tied – 20th lowest)
> Labor force: 77,000
> Median annual wage: $38,980
> Proj. job growth 2016-2026: +7.1%
> Typical entry level edu. required: Bachelor’s degree

Source: Jirapong Manustrong / Getty Images
22. Financial analysts
> Unemployment rate: 0.8% (tied – 20th lowest)
> Labor force: 309,000
> Median annual wage: $84,300
> Proj. job growth 2016-2026: +10.9%
> Typical entry level edu. required: Bachelor’s degree

Source: wundervisuals / Getty Images
21. Reservation and transportation ticket agents and travel clerks
> Unemployment rate: 0.8% (tied – 20th lowest)
> Labor force: 129,000
> Median annual wage: $36,280
> Proj. job growth 2016-2026: +3.8%
> Typical entry level edu. required: High school diploma or equivalent

Source: FatCamera / Getty Images
20. Speech-language pathologists
> Unemployment rate: 0.8% (tied – 20th lowest)
> Labor force: 153,000
> Median annual wage: $76,610
> Proj. job growth 2016-2026: +17.8%
> Typical entry level edu. required: Master’s degree

Source: andresr / Getty Images
19. Aircraft mechanics and service technicians
> Unemployment rate: 0.7% (tied – 16th lowest)
> Labor force: 165,000
> Median annual wage: $61,020
> Proj. job growth 2016-2026: +4.9%
> Typical entry level edu. required: Postsecondary nondegree award
 24/7 Wall St.
Source: MatusDuda / Getty Images
18. Aircraft pilots and flight engineers
> Unemployment rate: 0.7% (tied – 16th lowest)
> Labor force: 120,000
> Median annual wage: $137,330
> Proj. job growth 2016-2026: N/A
> Typical entry level edu. required: N/A

Source: Yok46233042 / Getty Images
17. Budget analysts
> Unemployment rate: 0.7% (tied – 16th lowest)
> Labor force: 51,000
> Median annual wage: $75,240
> Proj. job growth 2016-2026: +6.5%
> Typical entry level edu. required: Bachelor’s degree

Source: RyanJLane / Getty Images
16. Police and sheriff’s patrol officers
> Unemployment rate: 0.7% (tied – 16th lowest)
> Labor force: 733,000
> Median annual wage: $61,050
> Proj. job growth 2016-2026: +7.0%
> Typical entry level edu. required: High school diploma or equivalent

Source: nautilus_shell_studios / Getty Images
15. Dental hygienists
> Unemployment rate: 0.6% (tied – 14th lowest)
> Labor force: 179,000
> Median annual wage: $74,070
> Proj. job growth 2016-2026: +19.7%
> Typical entry level edu. required: Associate’s degree

Source: http://www.policehow.com/how-to-become-a-probation-officer.php
14. Probation officers and correctional treatment specialists
> Unemployment rate: 0.6% (tied – 14th lowest)
> Labor force: 105,000
> Median annual wage: $51,410
> Proj. job growth 2016-2026: +5.7%
> Typical entry level edu. required: Bachelor’s degree

Source: Suwat Rujimethakul / Getty Images
13. Database administrators
> Unemployment rate: 0.5% (tied – 9th lowest)
> Labor force: 109,000
> Median annual wage: $87,020
> Proj. job growth 2016-2026: +11.5%
> Typical entry level edu. required: Bachelor’s degree

Source: Ikonoklast_Fotografie / Getty Images
12. Opticians, dispensing
> Unemployment rate: 0.5% (tied – 9th lowest)
> Labor force: 61,000
> Median annual wage: $36,250
> Proj. job growth 2016-2026: +15.0%
> Typical entry level edu. required: High school diploma or equivalent
Source: Public Domain / Wikimedia Commons
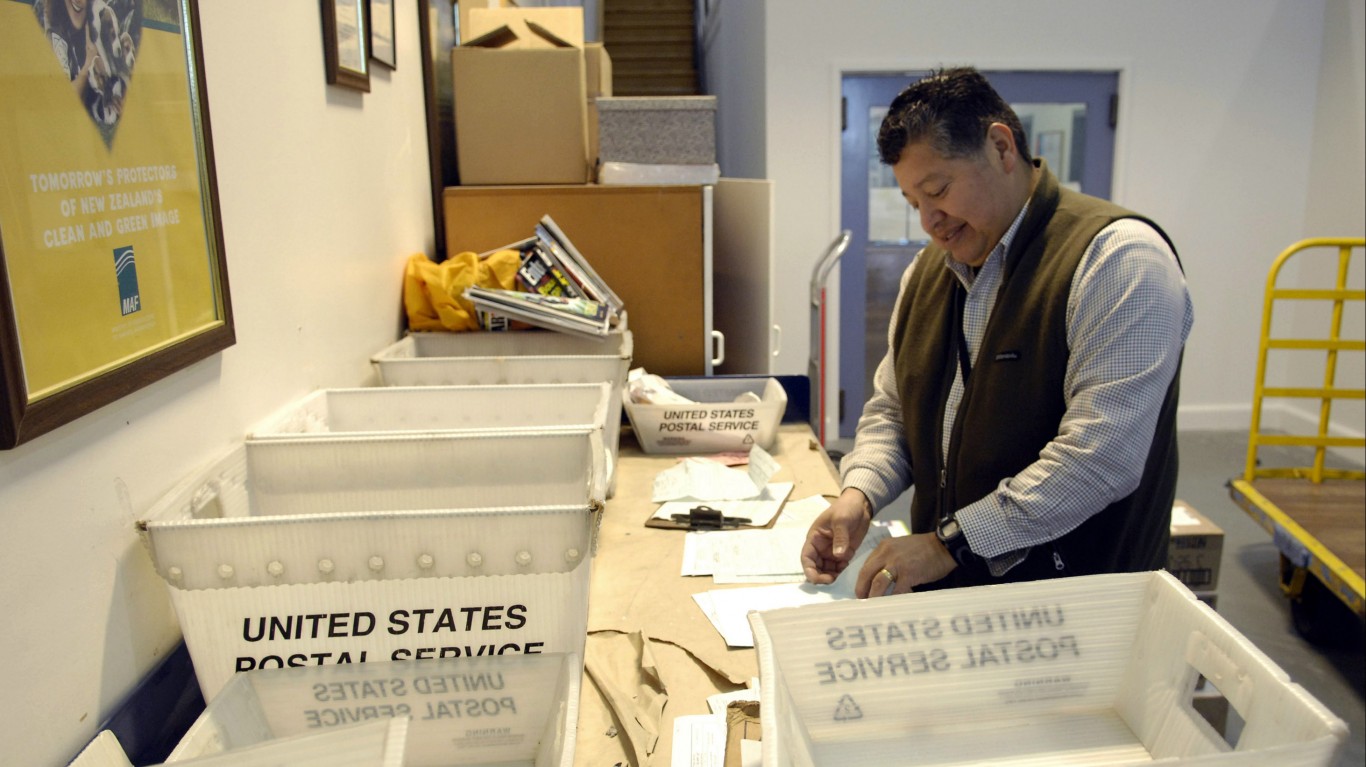
11. Postal service clerks
> Unemployment rate: 0.5% (tied – 9th lowest)
> Labor force: 121,000
> Median annual wage: $58,550
> Proj. job growth 2016-2026: -12.1%
> Typical entry level edu. required: High school diploma or equivalent

Source: 7postman / Getty Images
10. Precision instrument and equipment repairers
> Unemployment rate: 0.5% (tied – 9th lowest)
> Labor force: 65,000
> Median annual wage: $56,940
> Proj. job growth 2016-2026: N/A
> Typical entry level edu. required: N/A

Source: yacobchuk / Getty Images
9. Psychologists
> Unemployment rate: 0.5% (tied – 9th lowest)
> Labor force: 225,000
> Median annual wage: $77,030
> Proj. job growth 2016-2026: +13.8%
> Typical entry level edu. required: Doctoral or professional degree
 24/7 Wall St.
Source: jacoblund / Getty Images
8. Physicians and surgeons
> Unemployment rate: 0.4% (tied – 7th lowest)
> Labor force: 1.1 million
> Median annual wage: > $208,000
> Proj. job growth 2016-2026: +12.8%
> Typical entry level edu. required: Doctoral or professional degree

Source: DjelicS / Getty Images
7. Veterinarians
> Unemployment rate: 0.4% (tied – 7th lowest)
> Labor force: 102,000
> Median annual wage: $90,420
> Proj. job growth 2016-2026: +18.8%
> Typical entry level edu. required: Doctoral or professional degree

Source: EXTREME-PHOTOGRAPHER / Getty Images
6. Aerospace engineers
> Unemployment rate: 0.3% (6th lowest)
> Labor force: 147,000
> Median annual wage: $113,030
> Proj. job growth 2016-2026: +6.1%
> Typical entry level edu. required: Bachelor’s degree

Source: anandaBGD / Getty Images
5. Computer network architects
> Unemployment rate: 0.1% (tied – 2nd lowest)
> Labor force: 114,000
> Median annual wage: $104,650
> Proj. job growth 2016-2026: +6.5%
> Typical entry level edu. required: Bachelor’s degree

Source: andresr / Getty Images
4. Court, municipal, and license clerks
> Unemployment rate: 0.1% (tied – 2nd lowest)
> Labor force: 83,000
> Median annual wage: $37,300
> Proj. job growth 2016-2026: +6.5%
> Typical entry level edu. required: High school diploma or equivalent

Source: Wavebreakmedia / Getty Images
3. Optometrists
> Unemployment rate: 0.1% (tied – 2nd lowest)
> Labor force: 54,000
> Median annual wage: $110,300
> Proj. job growth 2016-2026: +17.9%
> Typical entry level edu. required: Doctoral or professional degree

Source: Public Domain / Wikimedia Commons
2. Veterinary assistants and laboratory animal caretakers
> Unemployment rate: 0.1% (tied – 2nd lowest)
> Labor force: 56,000
> Median annual wage: $26,140
> Proj. job growth 2016-2026: +19.4%
> Typical entry level edu. required: High school diploma or equivalent

Source: ftwitty / Getty Images
1. Appraisers and assessors of real estate
> Unemployment rate: <0.1% (the lowest)
> Labor force: 84,000
> Median annual wage: $54,010
> Proj. job growth 2016-2026: +14.4%
> Typical entry level edu. required: Bachelor’s degree
Jobs with the Worst Job Security

Source: Believe_In_Me / Getty Images
32. Cleaners of vehicles and equipment
> Unemployment rate: 6.6% (tied – 32nd highest)
> Labor force: 352,000
> Median annual wage: $23,360
> Proj. job growth 2016-2026: +10.7%
> Typical entry level edu. required: No formal educational credential

Source: Koldunov / Getty Images
31. Cooks
> Unemployment rate: 6.6% (tied – 32nd highest)
> Labor force: 2.2 million
> Median annual wage: $23,970
> Proj. job growth 2016-2026: +6.1%
> Typical entry level edu. required: No formal educational credential

Source: Steve Debenport / Getty Images
30. Dining room and cafeteria attendants and bartender helpers
> Unemployment rate: 6.7% (tied – 30th highest)
> Labor force: 331,000
> Median annual wage: $21,160
> Proj. job growth 2016-2026: +7.1%
> Typical entry level edu. required: No formal educational credential

Source: kadmy / Getty Images
29. Hotel, motel, and resort desk clerks
> Unemployment rate: 6.7% (tied – 30th highest)
> Labor force: 140,000
> Median annual wage: $22,850
> Proj. job growth 2016-2026: +4.4%
> Typical entry level edu. required: High school diploma or equivalent

Source: SanneBerg / Getty Images
28. Models, demonstrators, and product promoters
> Unemployment rate: 6.8% (tied – 28th highest)
> Labor force: 64,000
> Median annual wage: $27,060
> Proj. job growth 2016-2026: N/A
> Typical entry level edu. required: High school diploma or equivalent

Source: aydinmutlu / Getty Images
27. Painters, construction and maintenance
> Unemployment rate: 6.9% (27th highest)
> Labor force: 652,000
> Median annual wage: $37,960
> Proj. job growth 2016-2026: +5.7%
> Typical entry level edu. required: No formal educational credential

Source: Olivier Le Moal / Getty Images
26. Bill and account collectors
> Unemployment rate: 7.0% (tied – 23rd highest)
> Labor force: 131,000
> Median annual wage: $35,330
> Proj. job growth 2016-2026: -3.0%
> Typical entry level edu. required: High school diploma or equivalent

Source: RGtimeline / Getty Images
25. Cement masons, concrete finishers, and terrazzo workers
> Unemployment rate: 7.0% (tied – 23rd highest)
> Labor force: 54,000
> Median annual wage: $42,900
> Proj. job growth 2016-2026: +12.6%
> Typical entry level edu. required: High school diploma or equivalent

Source: dardespot / Getty Images
24. Mail clerks and mail machine operators, except postal service
> Unemployment rate: 7.0% (tied – 23rd highest)
> Labor force: 68,000
> Median annual wage: $29,620
> Proj. job growth 2016-2026: -7.4%
> Typical entry level edu. required: High school diploma or equivalent

Source: Drazen_ / Getty Images
23. Operating engineers and other construction equipment operators
> Unemployment rate: 7.0% (tied – 23rd highest)
> Labor force: 368,000
> Median annual wage: $47,040
> Proj. job growth 2016-2026: +12.3%
> Typical entry level edu. required: High school diploma or equivalent

Source: Juanmonino / Getty Images
22. Combined food preparation and serving workers, including fast food
> Unemployment rate: 7.2% (22nd highest)
> Labor force: 347,000
> Median annual wage: $20,180
> Proj. job growth 2016-2026: +16.8%
> Typical entry level edu. required: No formal educational credential

Source: wathanyu / Getty Images
21. Grounds maintenance workers
> Unemployment rate: 7.5% (21st highest)
> Labor force: 1.4 million
> Median annual wage: $28,110
> Proj. job growth 2016-2026: +11.2%
> Typical entry level edu. required: No formal educational credential
 24/7 Wall St.
Source: YakobchukOlena / Getty Images
20. Cashiers
> Unemployment rate: 7.6% (20th highest)
> Labor force: 3.5 million
> Median annual wage: $21,030
> Proj. job growth 2016-2026: -0.9%
> Typical entry level edu. required: No formal educational credential

Source: AndreyPopov / Getty Images
19. Laborers and freight, stock, and material movers, hand
> Unemployment rate: 7.7% (tied – 17th highest)
> Labor force: 2.3 million
> Median annual wage: $27,040
> Proj. job growth 2016-2026: +7.6%
> Typical entry level edu. required: No formal educational credential

Source: franckreporter / Getty Images
18. Structural iron and steel workers
> Unemployment rate: 7.7% (tied – 17th highest)
> Labor force: 65,000
> Median annual wage: $52,610
> Proj. job growth 2016-2026: +12.8%
> Typical entry level edu. required: High school diploma or equivalent

Source: Goldmund / Getty Images
17. Word processors and typists
> Unemployment rate: 7.7% (tied – 17th highest)
> Labor force: 73,000
> Median annual wage: $39,740
> Proj. job growth 2016-2026: -33.1%
> Typical entry level edu. required: High school diploma or equivalent

Source: fortrucker / Flickr
16. Tax preparers
> Unemployment rate: 7.8% (16th highest)
> Labor force: 123,000
> Median annual wage: $38,730
> Proj. job growth 2016-2026: +10.8%
> Typical entry level edu. required: High school diploma or equivalent

Source: John Moore / Getty Images
15. Lifeguards and other recreational, and all other protective service workers
> Unemployment rate: 8.0% (tied – 13th highest)
> Labor force: 127,000
> Median annual wage: $21,290
> Proj. job growth 2016-2026: N/A
> Typical entry level edu. required: No formal educational credential

Source: Victor Decolongon / Getty Images
14. Miscellaneous entertainment attendants and related workers
> Unemployment rate: 8.0% (tied – 13th highest)
> Labor force: 228,000
> Median annual wage: $24,200
> Proj. job growth 2016-2026: N/A
> Typical entry level edu. required: N/A

Source: William Thomas Cain / Getty Images
13. Packaging and filling machine operators and tenders
> Unemployment rate: 8.0% (tied – 13th highest)
> Labor force: 301,000
> Median annual wage: $29,350
> Proj. job growth 2016-2026: +1.7%
> Typical entry level edu. required: High school diploma or equivalent

Source: Drazen_ / Getty Images
12. Construction laborers
> Unemployment rate: 8.3% (12th highest)
> Labor force: 2.3 million
> Median annual wage: $34,530
> Proj. job growth 2016-2026: +12.4%
> Typical entry level edu. required: No formal educational credential

Source: Geber86 / Getty Images
11. Weighers, measurers, checkers, and samplers, recordkeeping
> Unemployment rate: 8.4% (11th highest)
> Labor force: 61,000
> Median annual wage: $30,180
> Proj. job growth 2016-2026: +1.8%
> Typical entry level edu. required: High school diploma or equivalent
 24/7 Wall St.
Source: PierreOlivierClementMantion / Getty Images
10. Brickmasons, blockmasons, and stonemasons
> Unemployment rate: 8.8% (10th highest)
> Labor force: 157,000
> Median annual wage: $42,900
> Proj. job growth 2016-2026: +10.1%
> Typical entry level edu. required: High school diploma or equivalent

Source: piola666 / Getty Images
9. Tour and travel guides
> Unemployment rate: 8.9% (9th highest)
> Labor force: 71,000
> Median annual wage: $25,770
> Proj. job growth 2016-2026: N/A
> Typical entry level edu. required: N/A

Source: Ales-A / Getty Images
8. Farming, fishing, and forestry occupations
> Unemployment rate: 9.2% (8th highest)
> Labor force: 1.2 million
> Median annual wage: $24,390
> Proj. job growth 2016-2026: +0.0%
> Typical entry level edu. required: No formal educational credential

Source: Vladimir Vladimirov / Getty Images
7. Counter attendants, cafeteria, food concession, and coffee shop
> Unemployment rate: 9.4% (7th highest)
> Labor force: 223,000
> Median annual wage: $21,280
> Proj. job growth 2016-2026: +4.6%
> Typical entry level edu. required: No formal educational credential

Source: valio84sl / Getty Images
6. Miscellaneous agricultural workers
> Unemployment rate: 9.6% (6th highest)
> Labor force: 922,000
> Median annual wage: $30,600
> Proj. job growth 2016-2026: N/A
> Typical entry level edu. required: No formal educational credential

Source: sturti / Getty Images
5. Packers and packagers, hand
> Unemployment rate: 9.7% (5th highest)
> Labor force: 672,000
> Median annual wage: $23,430
> Proj. job growth 2016-2026: +1.8%
> Typical entry level edu. required: No formal educational credential

Source: Vasyl Dolmatov / Getty Images
4. Telemarketers
> Unemployment rate: 10.5% (4th highest)
> Labor force: 65,000
> Median annual wage: $24,460
> Proj. job growth 2016-2026: +0.0%
> Typical entry level edu. required: No formal educational credential

Source: Bhakpong / iStock
3. Graders and sorters, agricultural products
> Unemployment rate: 11.5% (3rd highest)
> Labor force: 96,000
> Median annual wage: $23,340
> Proj. job growth 2016-2026: -0.9%
> Typical entry level edu. required: No formal educational credential

Source: Jens_Lambert_Photography / Getty Images
2. Roofers
> Unemployment rate: 12.2% (2nd highest)
> Labor force: 229,000
> Median annual wage: $38,970
> Proj. job growth 2016-2026: +11.1%
> Typical entry level edu. required: No formal educational credential

Source: Juanmonino / Getty Images
1. Dishwashers
> Unemployment rate: 13.9% (the highest)
> Labor force: 306,000
> Median annual wage: $21,500
> Proj. job growth 2016-2026: +4.3%
> Typical entry level edu. required: No formal educational credential
Methodology
To identify the 33 jobs with the best job security and the 33 jobs with the worst job security, 24/7 Wall St. reviewed 2017 unemployment rates for 360 occupations from the Bureau of Labor Statistics. We only considered occupations with a labor force of 50,000 or more. Unemployed members of an occupational labor force need to have been last employed in this occupation prior to unemployment. Employment projections from 2016 through 2026 came from the Occupational Outlook Handbook, published annually by the BLS. Typical entry-level education requirement and median annual wage also came from the BLS. Annual wages exclude those of part-time workers in a given profession. Occupations that represent the remainder of a broader classification, defined by the BLS as “all other,” were excluded from our analysis. Data on median annual wage, 10 year projected job growth, and typical educational attainment required was not always available from the BLS for the exact job listed. We used the data for the closest matching occupational categories in some of those cases when possible.
Take This Retirement Quiz To Get Matched With A Financial Advisor (Sponsored)
Take the quiz below to get matched with a financial advisor today.
Each advisor has been vetted by SmartAsset and is held to a fiduciary standard to act in your best interests.
Here’s how it works:
1. Answer SmartAsset advisor match quiz
2. Review your pre-screened matches at your leisure. Check out the
advisors’ profiles.
3. Speak with advisors at no cost to you. Have an introductory call on the phone or introduction in person and choose whom to work with in the future
Take the retirement quiz right here.
Thank you for reading! Have some feedback for us?
Contact the 24/7 Wall St. editorial team.
Editors' Picks

