Some countries have comprehensive weapons industries and are capable of maintaining their militaries with enough supply left over to export various arms to allies and clients around the world.
These same countries are also often among the world’s largest importers of weapons. Other countries, however, rely much more heavily on arms deals with other, large, arms-producing nations.
The United States is notably not just by far the world’s largest military force, but also by far the largest supplier of arms. The U.S.’s supplies arms to at least 98 nations, and it is the largest supplier to 20 of the 40 largest arms importers in the world.
To identify the world’s biggest arms importers and their biggest suppliers, 24/7 Wall St. reviewed the 40 countries with the largest total value of major arms imports during the 2014-18 five-year period from the report on major arms export volumes published by the Stockholm International Peace Research Institute (SIPRI) on March 11. Each country’s major suppliers, all major arms import and export data, as well as annual military expenditures in 2017, also came from SIPRI. Each country’s GDP per capita in 2016 came from the World Bank.
Click here to see the world’s biggest arms importers and their biggest suppliers.
Source: Public Domain / Wikimedia Commons
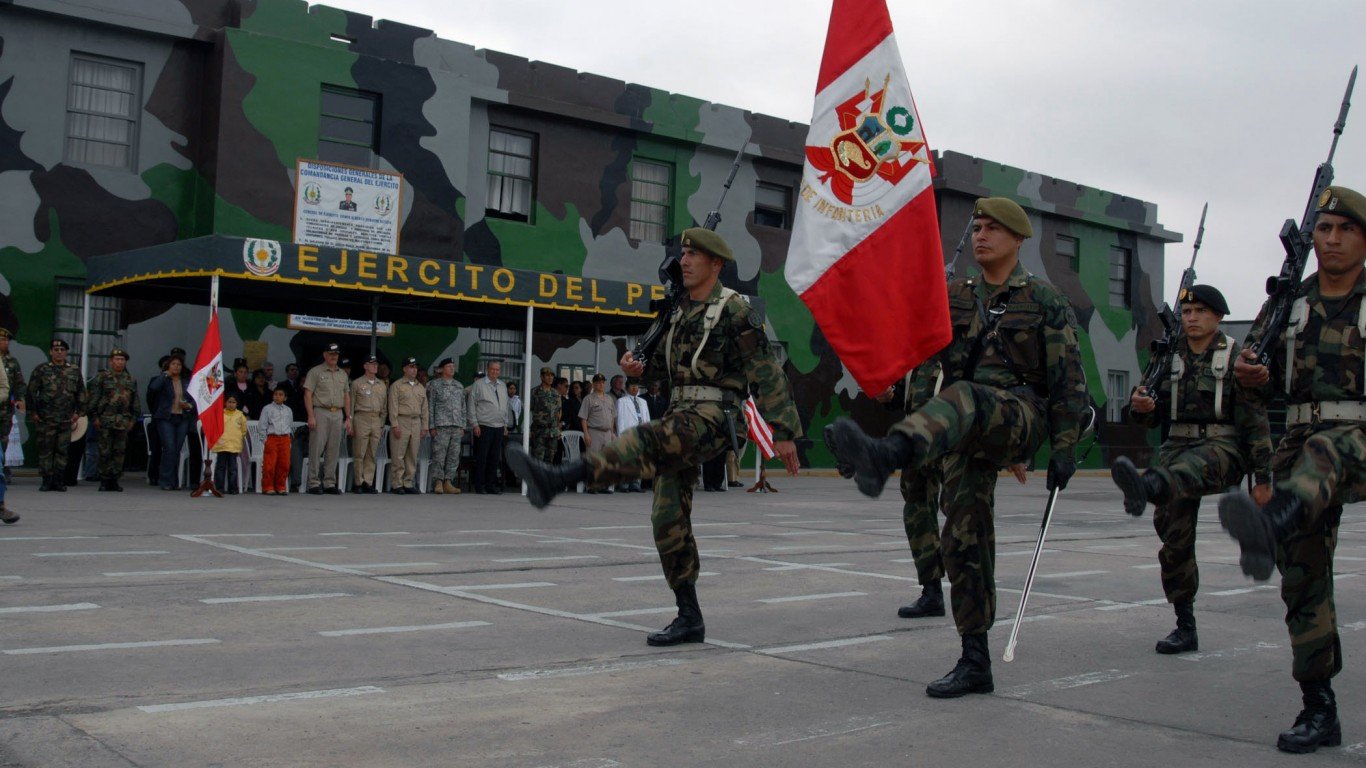
40. Peru
> Share of global arms imports (2014-18): 0.5%
> Main supplier, share of importer’s total imports: South Korea, 34%
> GDP per capita: $12,237
> Armed forces, total personnel (2016): 158,000
[in-text-ad]
Source: Kerri-Jo Stewart / Wikimedia Commons
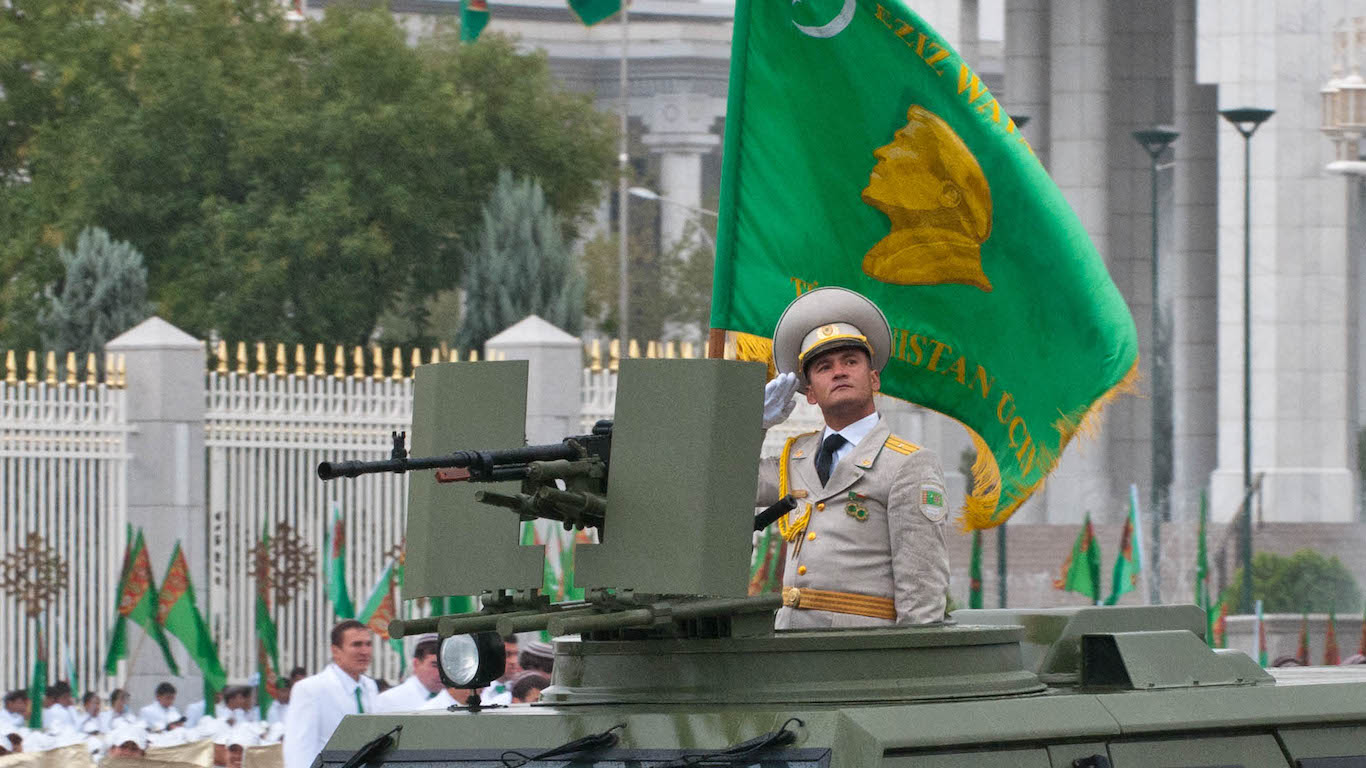
39. Turkmenistan
> Share of global arms imports (2014-18): 0.5%
> Main supplier, share of importer’s total imports: Turkey, 43%
> GDP per capita: $16,389
> Armed forces, total personnel (2016): 41,500
Source: Sean Gallup / Getty Images
38. Poland
> Share of global arms imports (2014-18): 0.6%
> Main supplier, share of importer’s total imports: Germany, 28%
> GDP per capita: $27,343
> Armed forces, total personnel (2016): 178,400
Source: Andreas Rentz / Getty Images
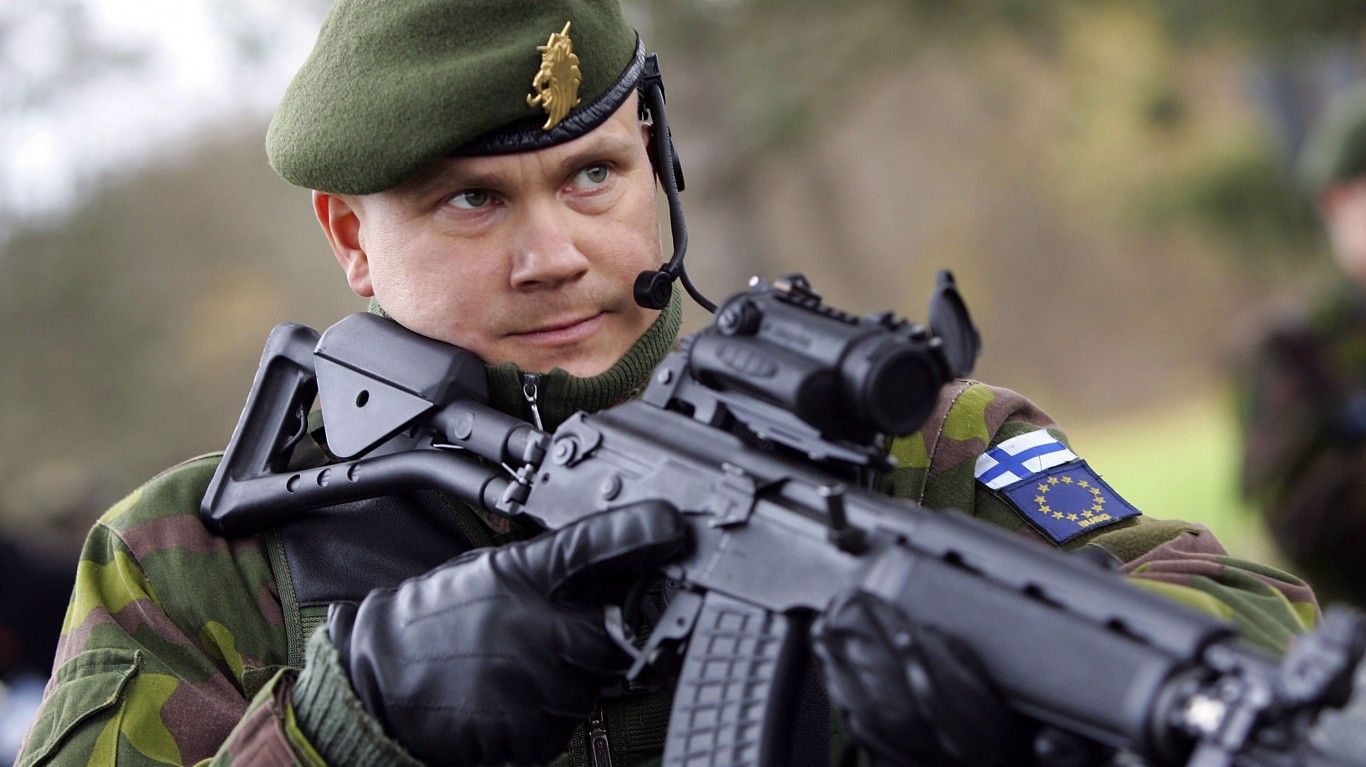
37. Finland
> Share of global arms imports (2014-18): 0.6%
> Main supplier, share of importer’s total imports: USA, 37%
> GDP per capita: $40,586
> Armed forces, total personnel (2016): 24,200
[in-text-ad-2]
Source: Peerapat Wimolrungkarat / Wikimedia Commons
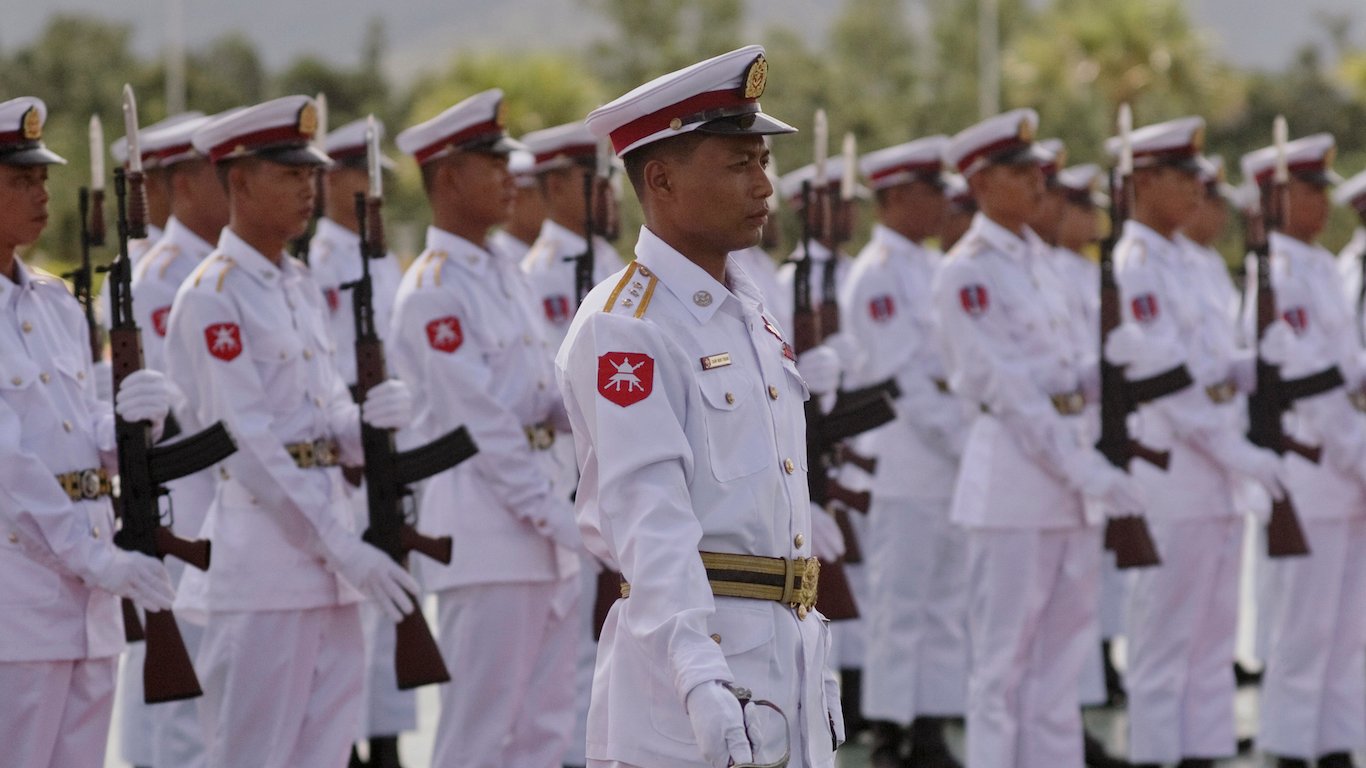
36. Myanmar
> Share of global arms imports (2014-18): 0.6%
> Main supplier, share of importer’s total imports: China, 61%
> GDP per capita: $5,612
> Armed forces, total personnel (2016): 513,250

Source: Mario Tama / Getty Images
35. Brazil
> Share of global arms imports (2014-18): 0.6%
> Main supplier, share of importer’s total imports: France, 26%
> GDP per capita: $14,103
> Armed forces, total personnel (2016): 729,500
[in-text-ad]
Source: eeliuth / Wikimedia Commons
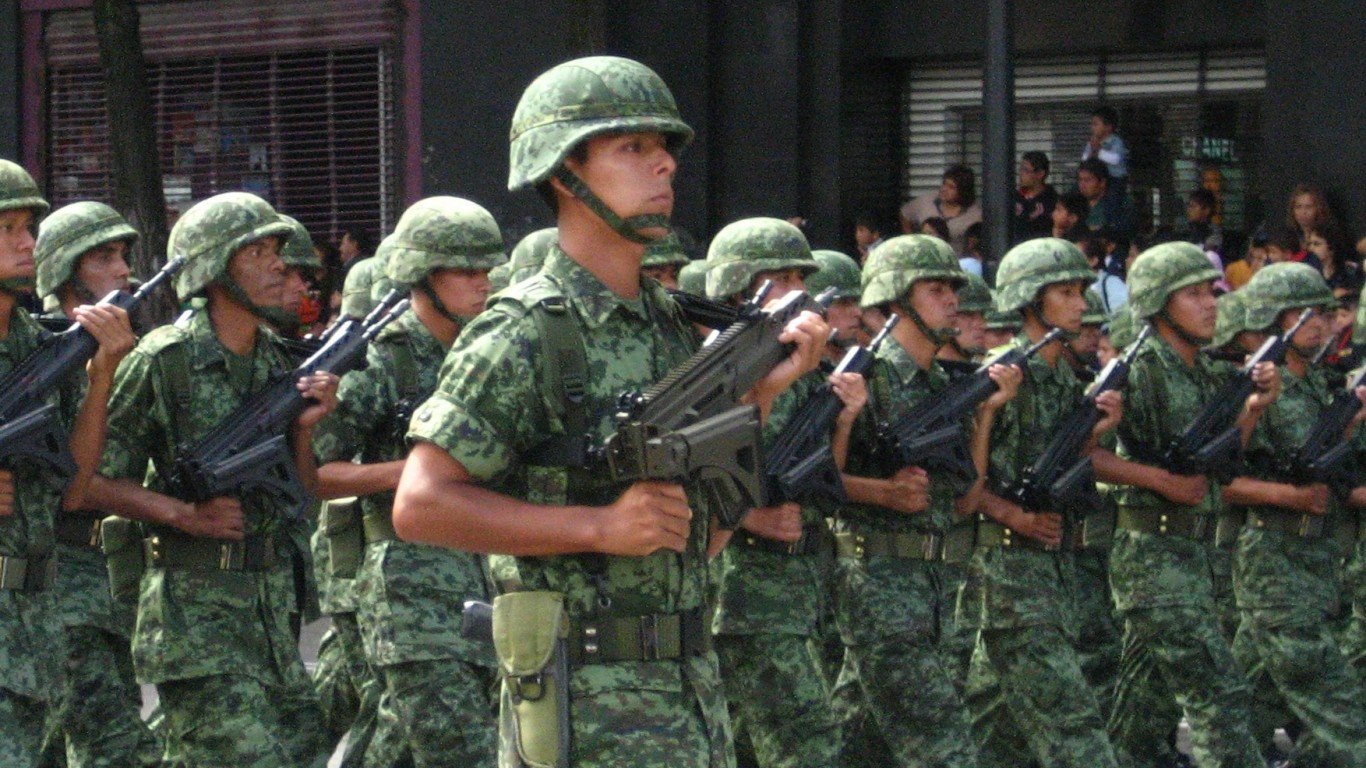
34. Mexico
> Share of global arms imports (2014-18): 0.7%
> Main supplier, share of importer’s total imports: USA, 63%
> GDP per capita: $17,331
> Armed forces, total personnel (2016): 336,050
Source: Public Domain / Wikimedia Commons
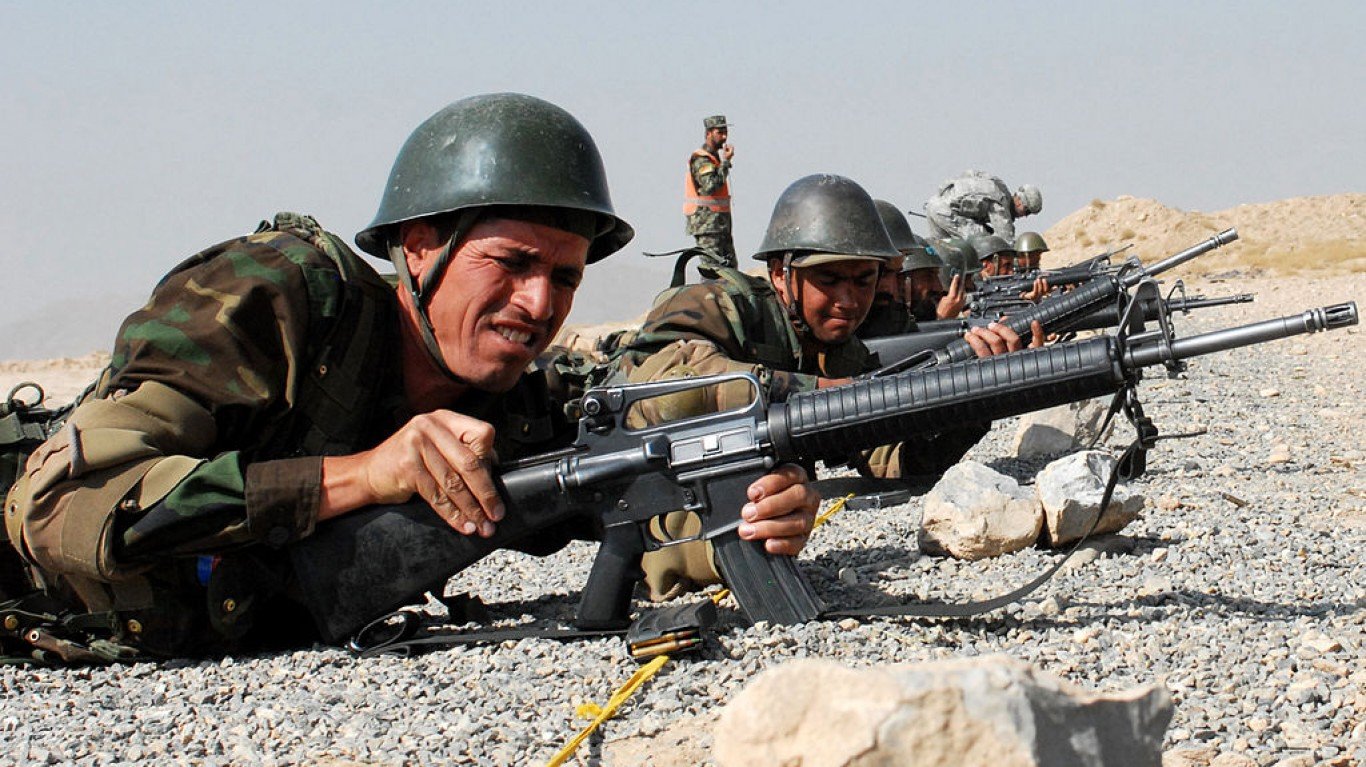
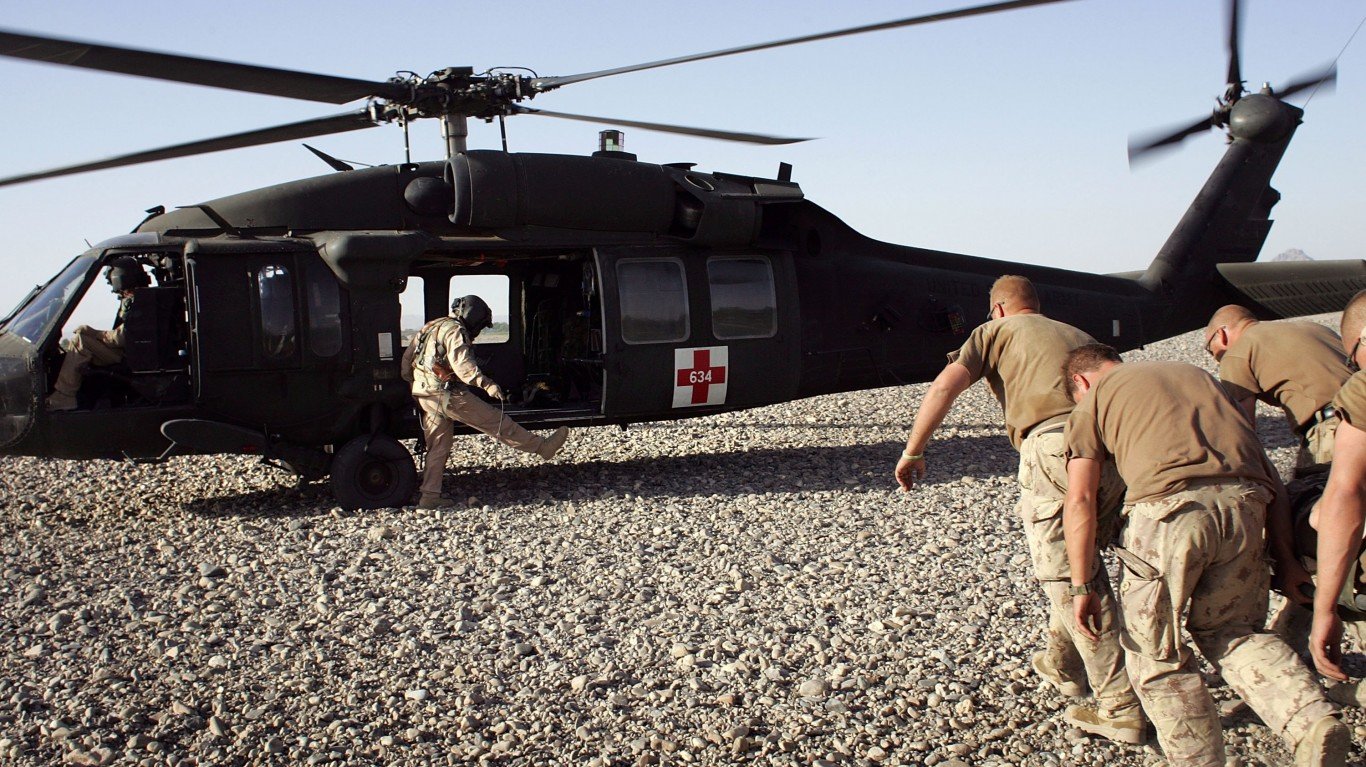
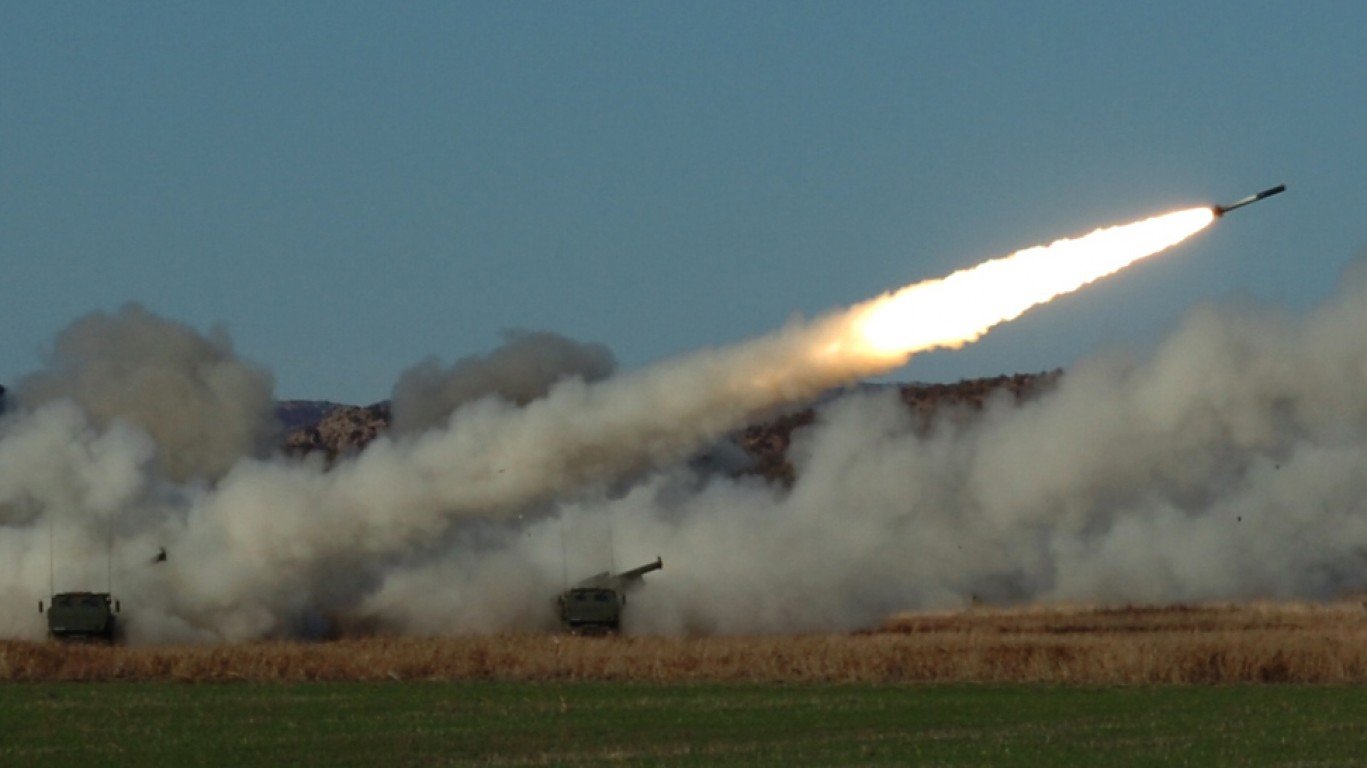
33. Afghanistan
> Share of global arms imports (2014-18): 0.8%
> Main supplier, share of importer’s total imports: USA, 66%
> GDP per capita: $1,796
> Armed forces, total personnel (2016): 323,000
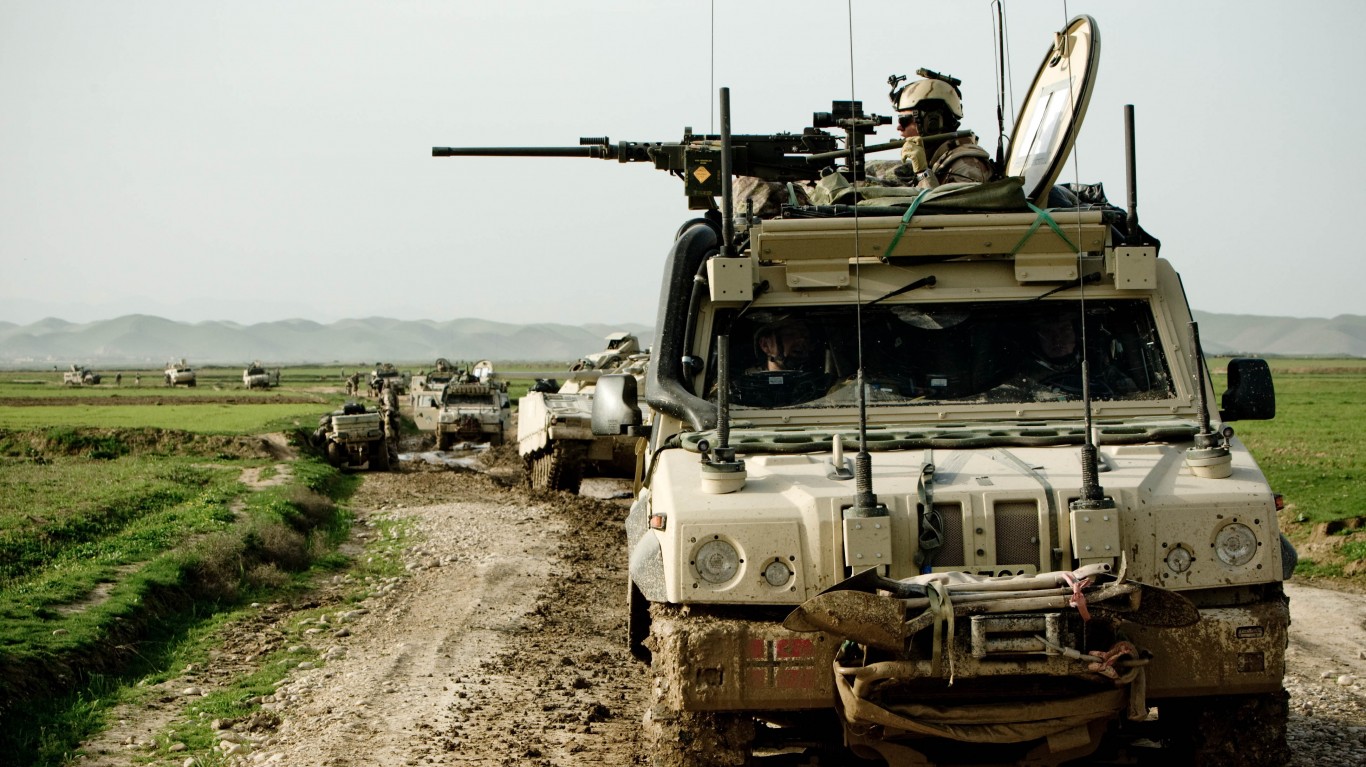
Source: PRT Meymaneh / Wikimedia Commons
32. Norway
> Share of global arms imports (2014-18): 0.8%
> Main supplier, share of importer’s total imports: USA, 76%
> GDP per capita: $64,800
> Armed forces, total personnel (2016): 23,950
[in-text-ad-2]

Source: Public Domain / Wikimedia Commons
31. Jordan
> Share of global arms imports (2014-18): 0.9%
> Main supplier, share of importer’s total imports: Netherlands, 37%
> GDP per capita: $8,337
> Armed forces, total personnel (2016): 115,500
Source: Public Domain / Wikimedia Commons
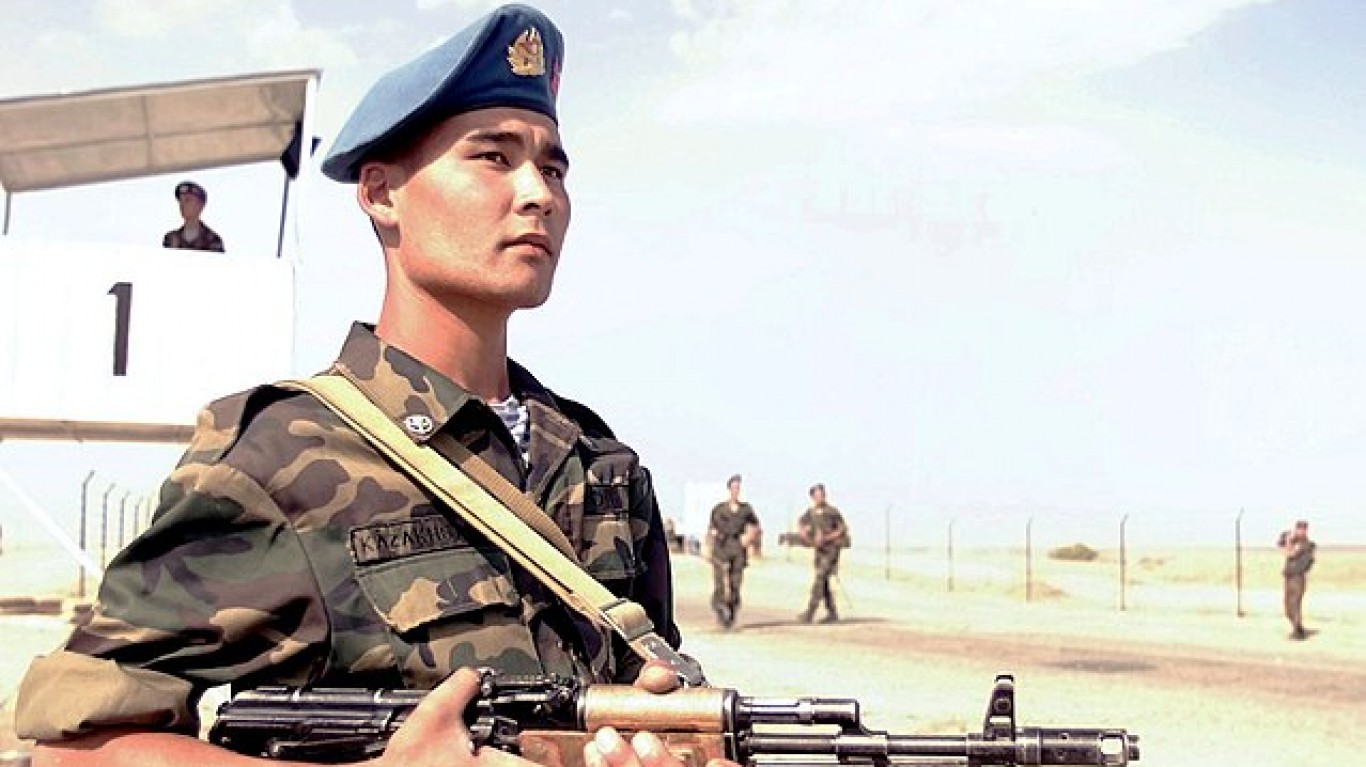
30. Kazakhstan
> Share of global arms imports (2014-18): 0.9%
> Main supplier, share of importer’s total imports: Russia, 84%
> GDP per capita: $24,079
> Armed forces, total personnel (2016): 70,500
[in-text-ad]
Source: Public Domain / Wikimedia Commons
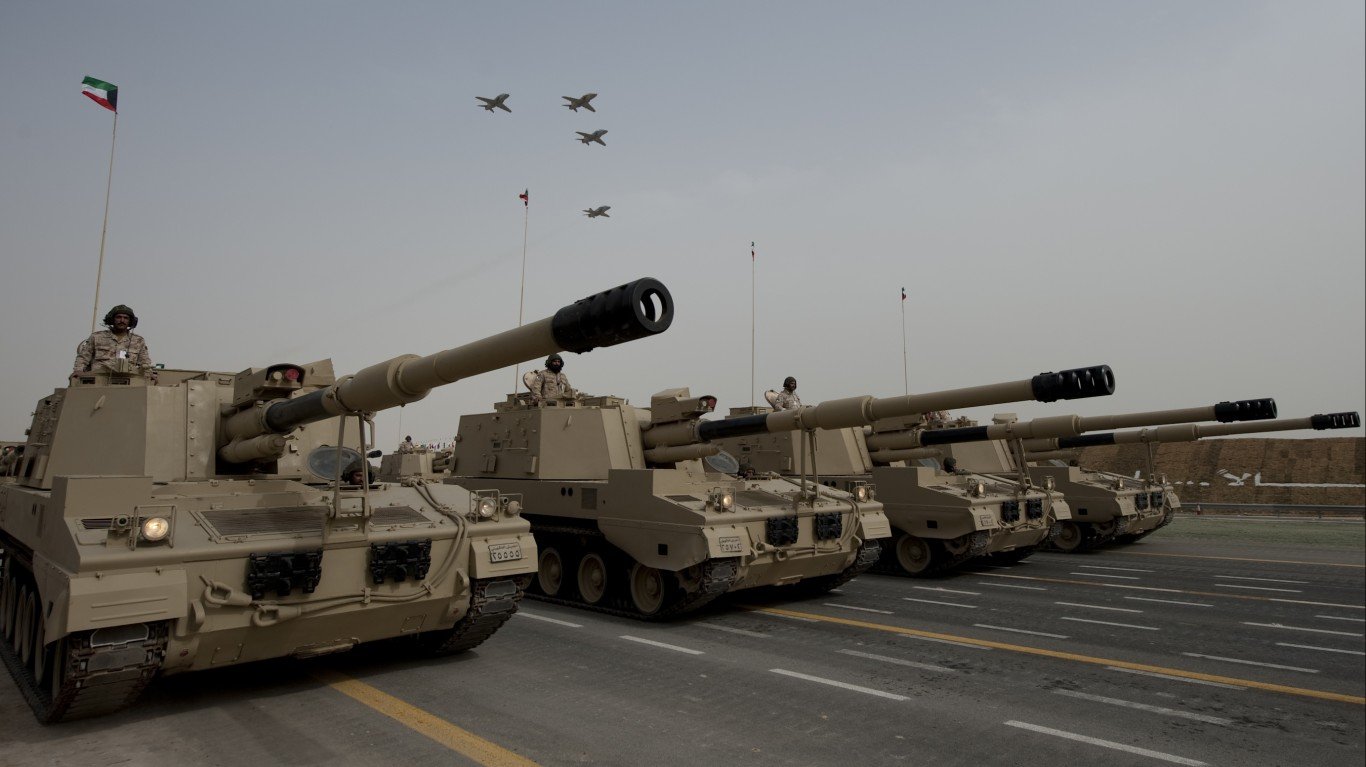
29. Kuwait
> Share of global arms imports (2014-18): 1.0%
> Main supplier, share of importer’s total imports: USA, 87%
> GDP per capita: $65,531
> Armed forces, total personnel (2016): 22,600

Source: Konstantinos Stampoulis (el:User:Geraki) / Wikimedia Commons
28. Greece
> Share of global arms imports (2014-18): 1.0%
> Main supplier, share of importer’s total imports: Germany, 67%
> GDP per capita: $24,574
> Armed forces, total personnel (2016): 145,350
Source: Paula Bronstein / Getty Images
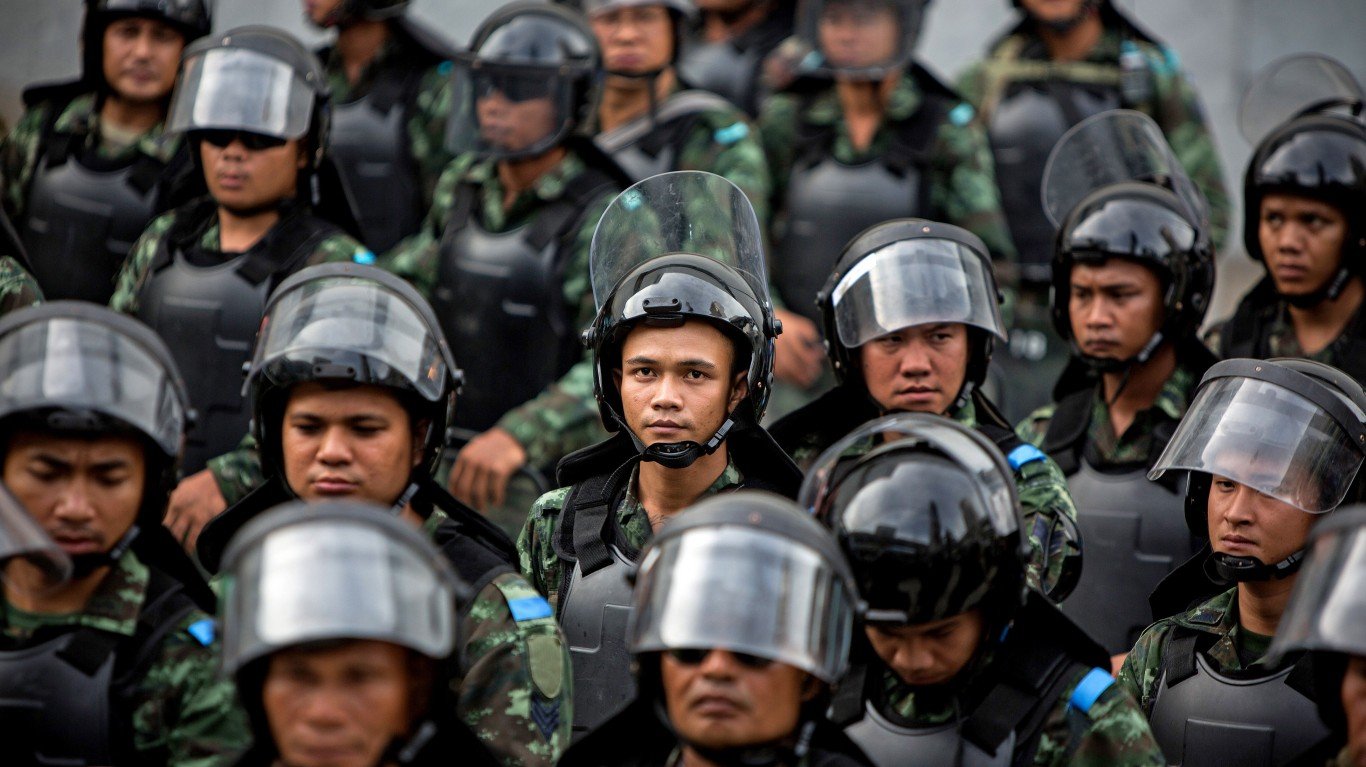
27. Thailand
> Share of global arms imports (2014-18): 1.0%
> Main supplier, share of importer’s total imports: South Korea, 20%
> GDP per capita: $16,279
> Armed forces, total personnel (2016): 454,550
[in-text-ad-2]
Source: John Moore / Getty Images
26. Canada
> Share of global arms imports (2014-18): 1.0%
> Main supplier, share of importer’s total imports: USA, 63%
> GDP per capita: $44,018
> Armed forces, total personnel (2016): 67,500
Source: shadman_samee / Flickr
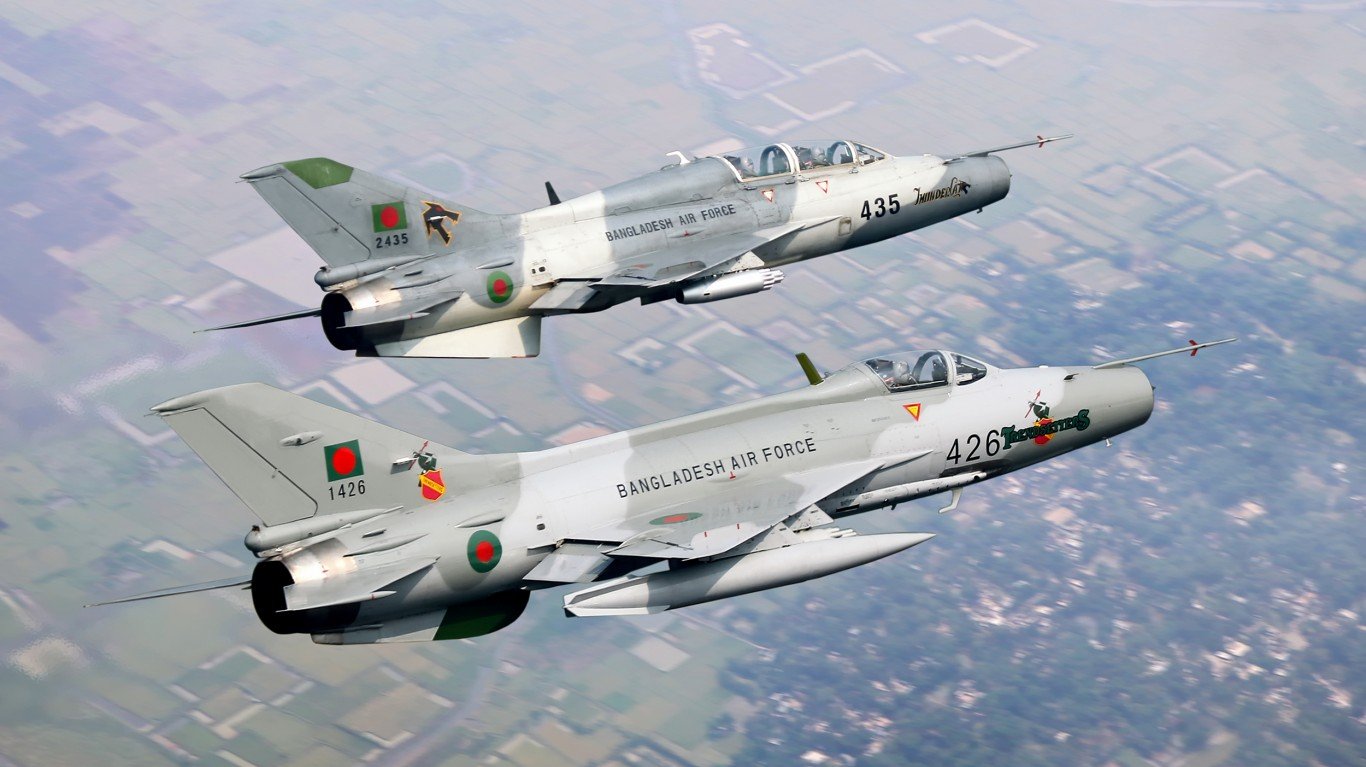
25. Bangladesh
> Share of global arms imports (2014-18): 1.2%
> Main supplier, share of importer’s total imports: China, 70%
> GDP per capita: $3,524
> Armed forces, total personnel (2016): 220,950
[in-text-ad]
Source: Public Domain / Wikimedia Commons
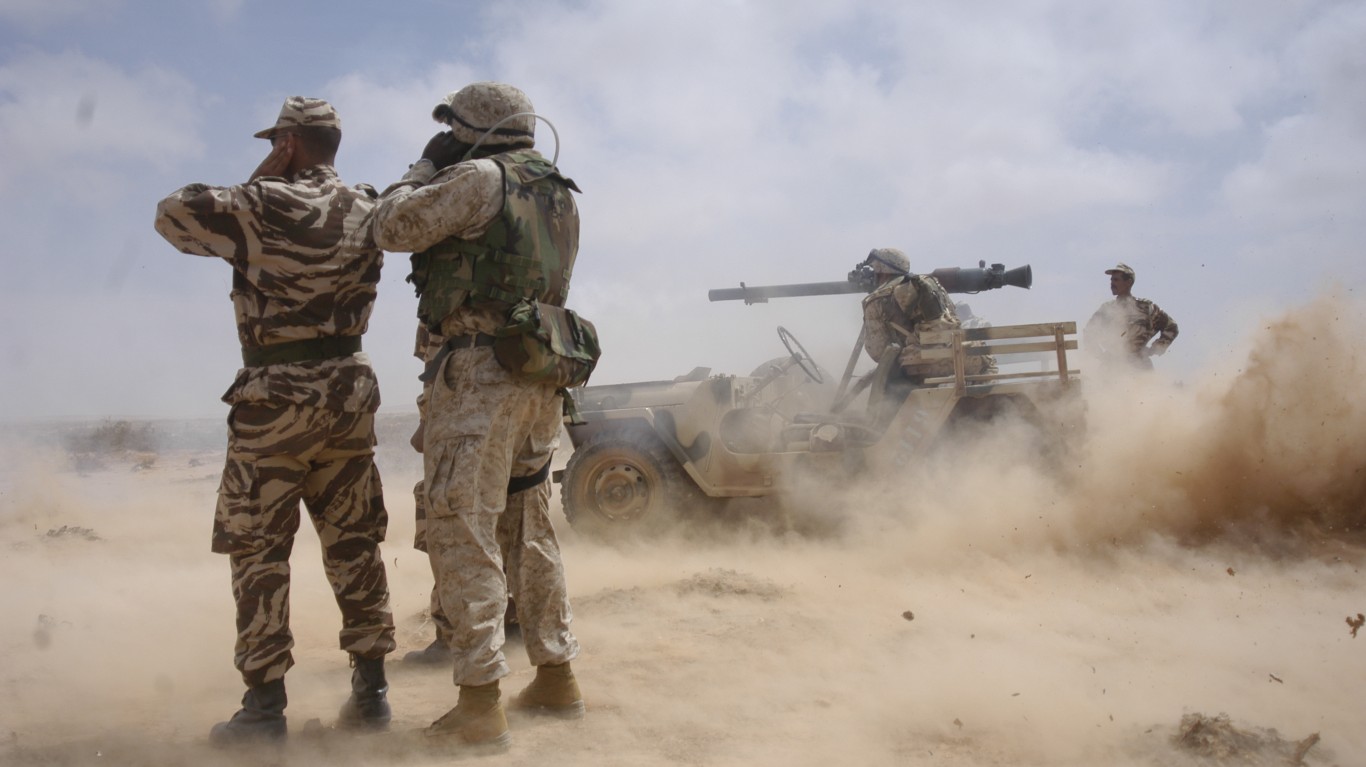
24. Morocco
> Share of global arms imports (2014-18): 1.2%
> Main supplier, share of importer’s total imports: USA, 62%
> GDP per capita: $7,485
> Armed forces, total personnel (2016): 245,800
Source: Sean Gallup / Getty Images
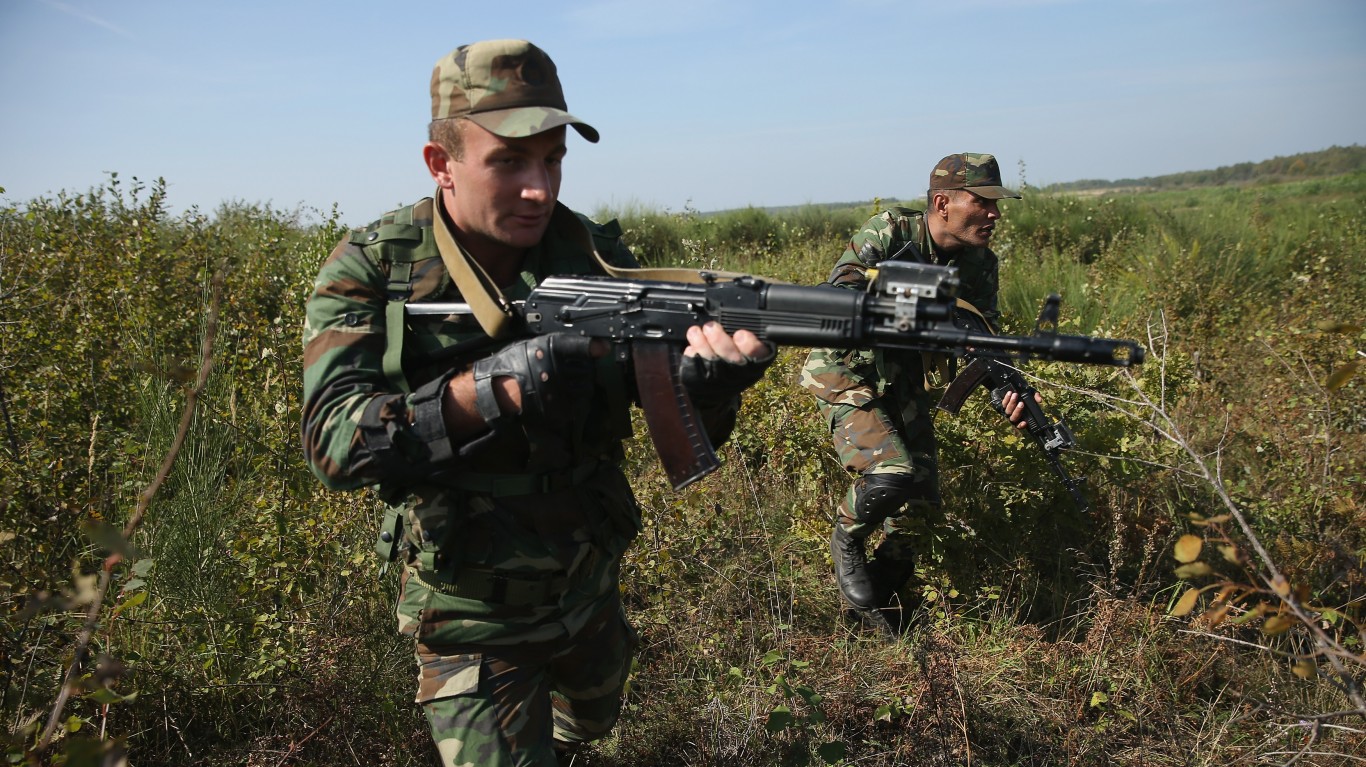
23. Azerbaijan
> Share of global arms imports (2014-18): 1.3%
> Main supplier, share of importer’s total imports: Russia, 51%
> GDP per capita: $15,847
> Armed forces, total personnel (2016): 81,950
Source: dvids / Flickr
22. Singapore
> Share of global arms imports (2014-18): 1.3%
> Main supplier, share of importer’s total imports: USA, 46%
> GDP per capita: $85,535
> Armed forces, total personnel (2016): 147,600
[in-text-ad-2]
Source: Koichi Kamoshida / Getty Images
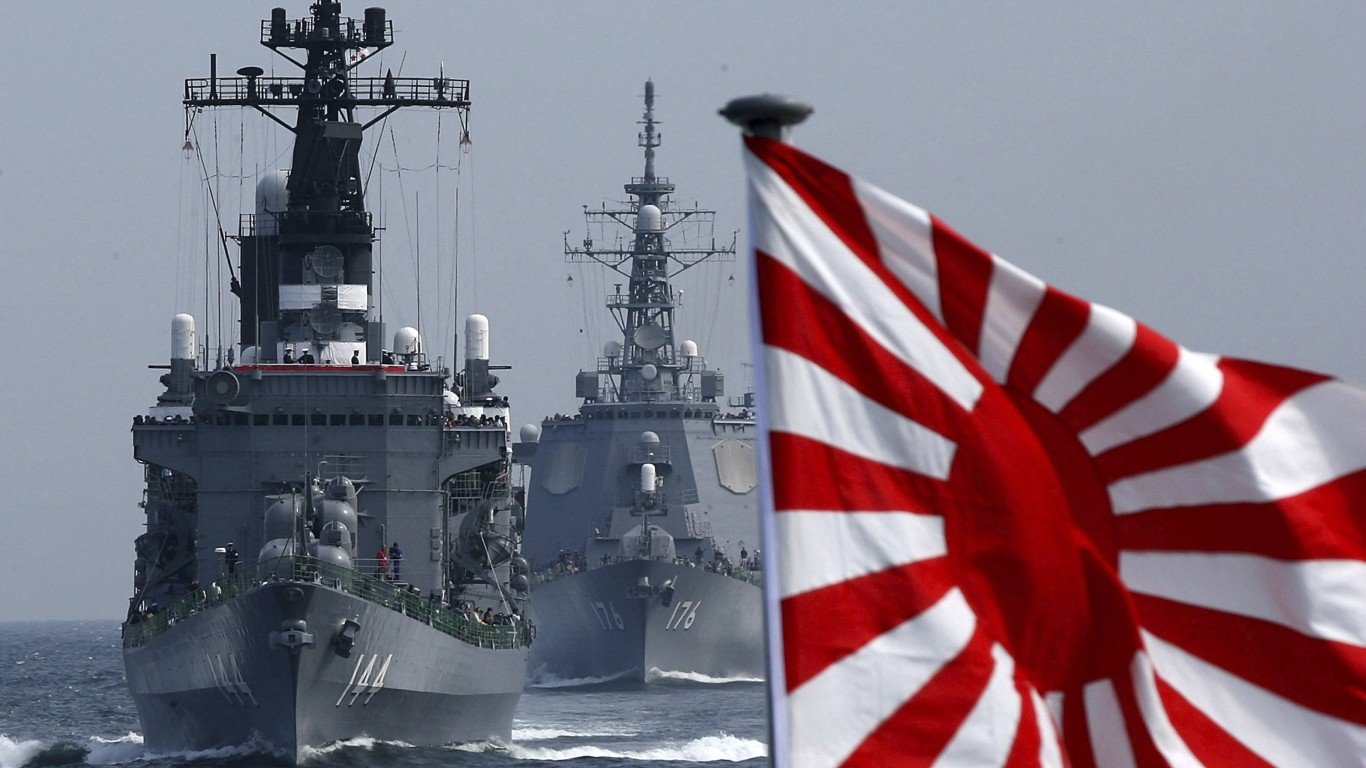
21. Japan
> Share of global arms imports (2014-18): 1.4%
> Main supplier, share of importer’s total imports: USA, 95%
> GDP per capita: $39,002
> Armed forces, total personnel (2016): 260,890

Source: Utente:Jollyroger / Wikimedia Commons
20. Italy
> Share of global arms imports (2014-18): 1.5%
> Main supplier, share of importer’s total imports: USA, 59%
> GDP per capita: $35,220
> Armed forces, total personnel (2016): 356,850
[in-text-ad]
Source: Getty Images / Getty Images
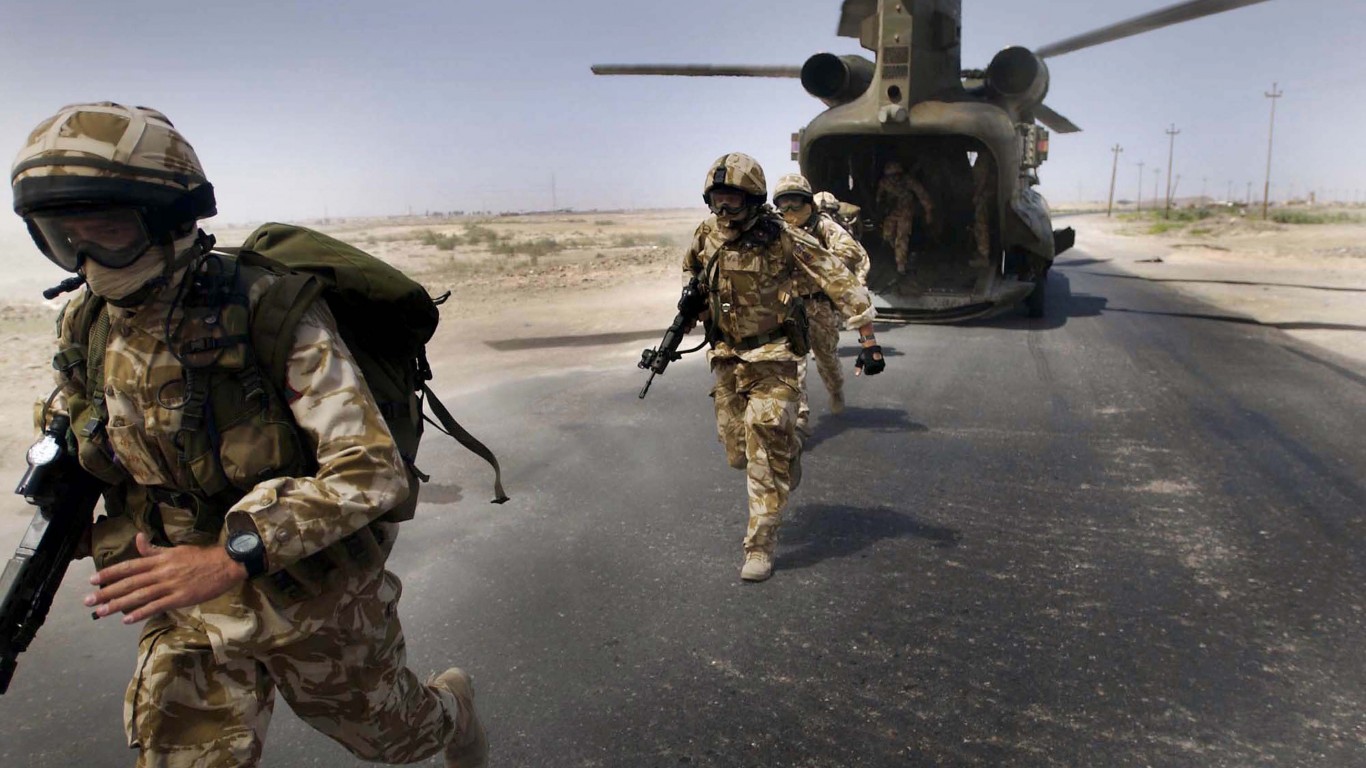
19. United Kingdom
> Share of global arms imports (2014-18): 1.6%
> Main supplier, share of importer’s total imports: USA, 71%
> GDP per capita: $39,753
> Armed forces, total personnel (2016): 150,250
 24/7 Wall St.
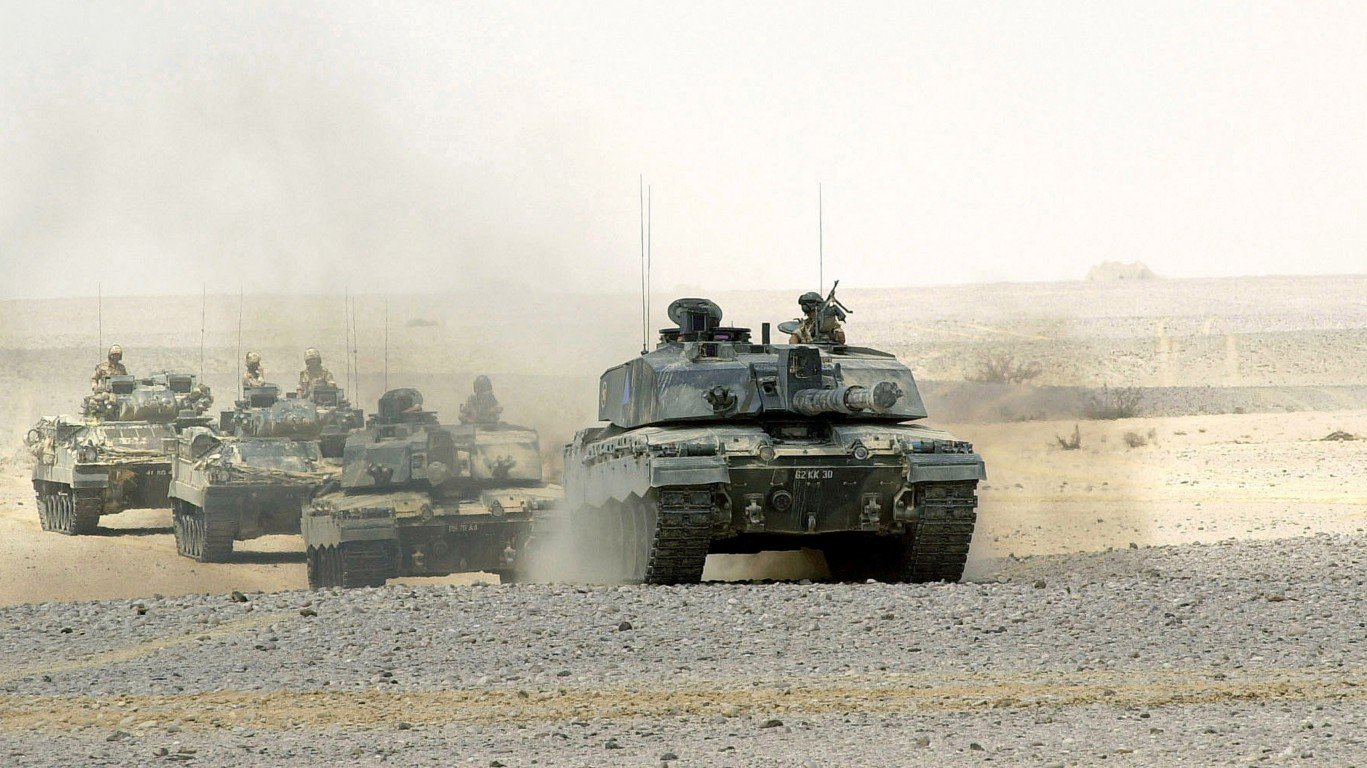
Source: WO2 Pete Bristo MBE / Wikimedia Commons
18. Oman
> Share of global arms imports (2014-18): 1.6%
> Main supplier, share of importer’s total imports: UK, 39%
> GDP per capita: $37,961
> Armed forces, total personnel (2016): 47,000
Source: Billy H.C. Kwok / Getty Images
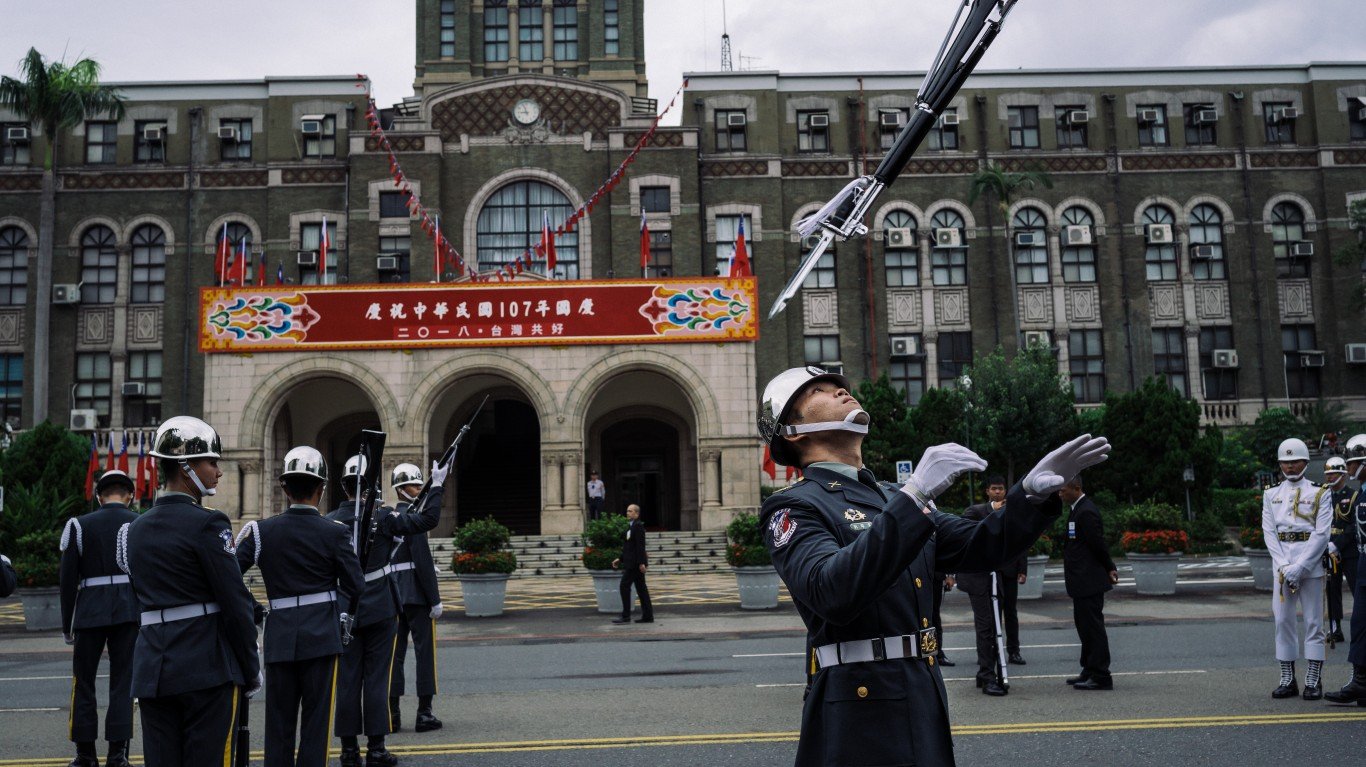
17. Taiwan
> Share of global arms imports (2014-18): 1.7%
> Main supplier, share of importer’s total imports: USA, 100%
> GDP per capita: N/A
> Armed forces, total personnel (2016): N/A
[in-text-ad-2]
Source: Scott Nelson / Getty Images
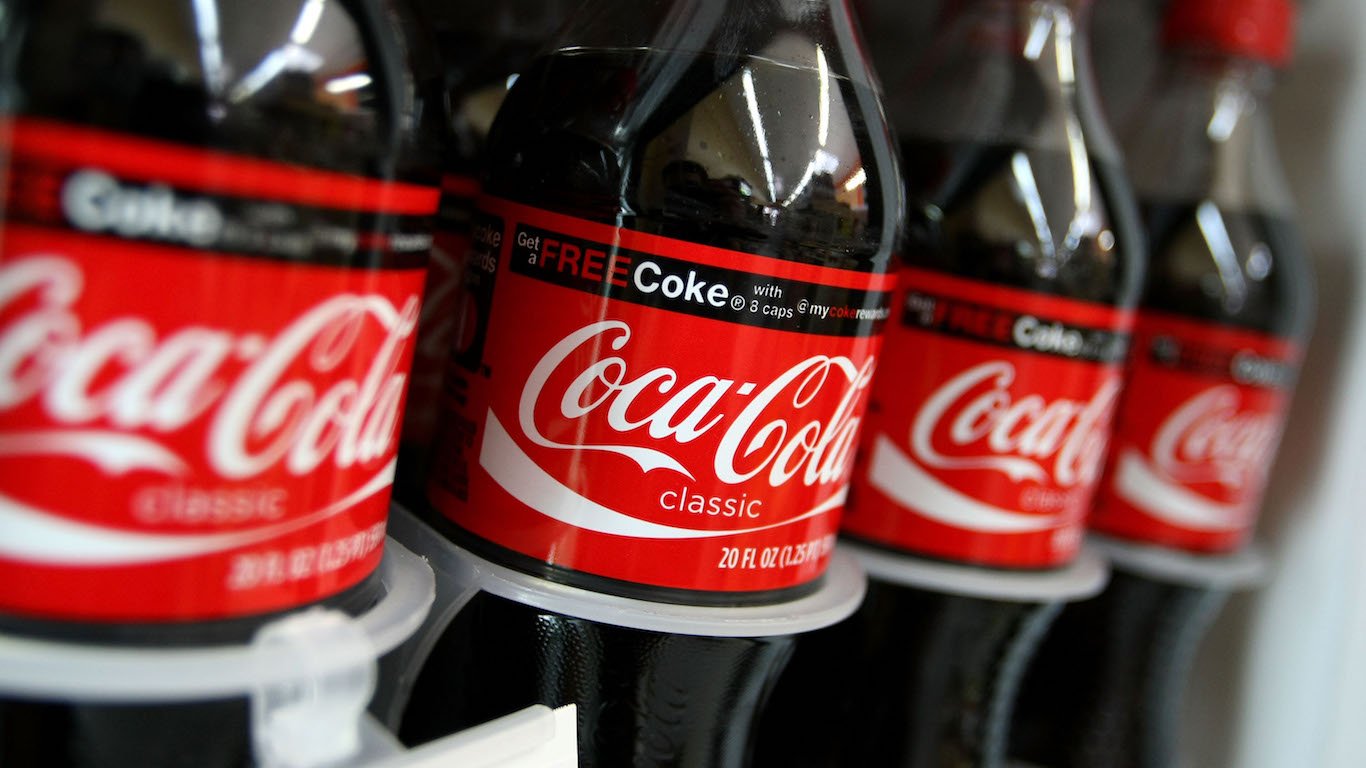
16. United States
> Share of global arms imports (2014-18): 1.8%
> Main supplier, share of importer’s total imports: Germany, 22%
> GDP per capita: $54,225
> Armed forces, total personnel (2016): 1,348,400
Source: Israel Defense Forces / Wikimedia Commons
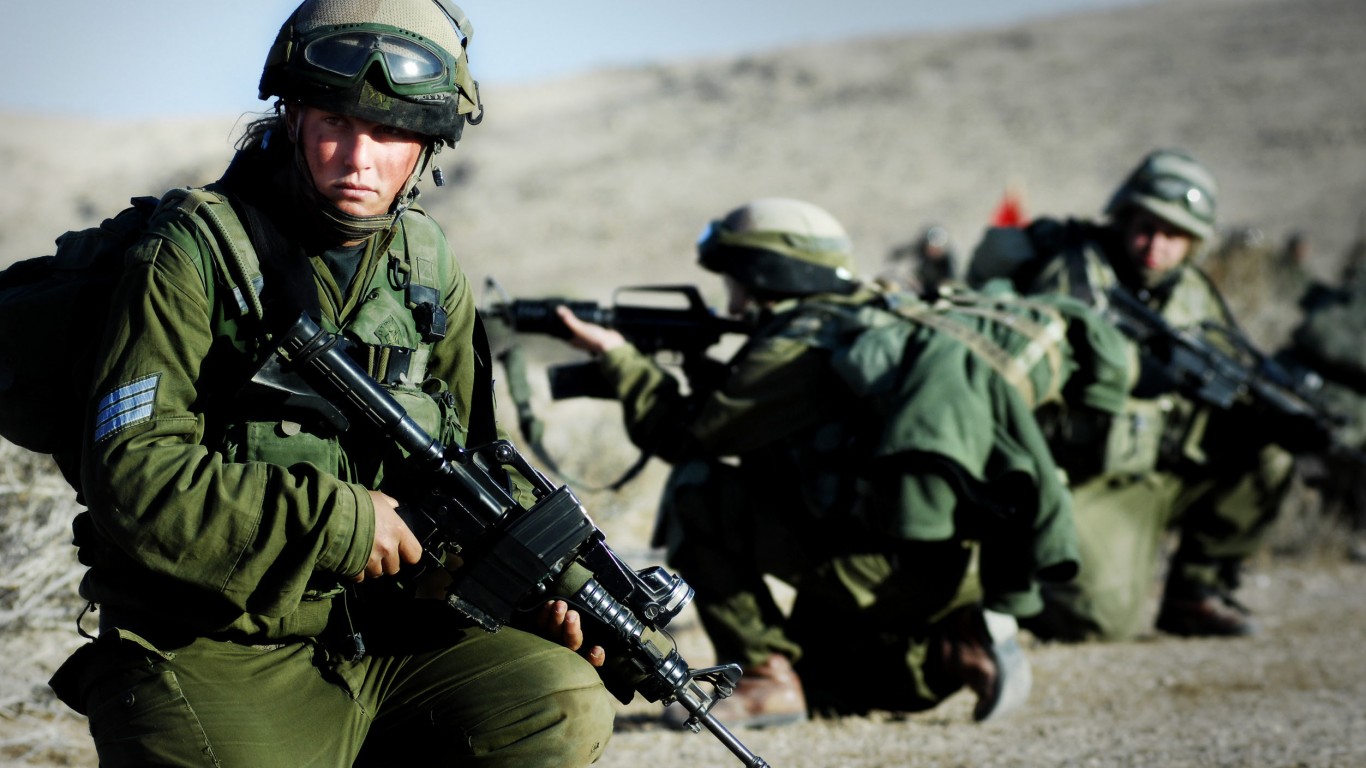
15. Israel
> Share of global arms imports (2014-18): 2.0%
> Main supplier, share of importer’s total imports: USA, 64%
> GDP per capita: $33,132
> Armed forces, total personnel (2016): 184,500
[in-text-ad]
Source: 39955793@N07 / Flickr
14. Qatar
> Share of global arms imports (2014-18): 2.0%
> Main supplier, share of importer’s total imports: USA, 65%
> GDP per capita: $116,932
> Armed forces, total personnel (2016): 21,500
 24/7 Wall St.
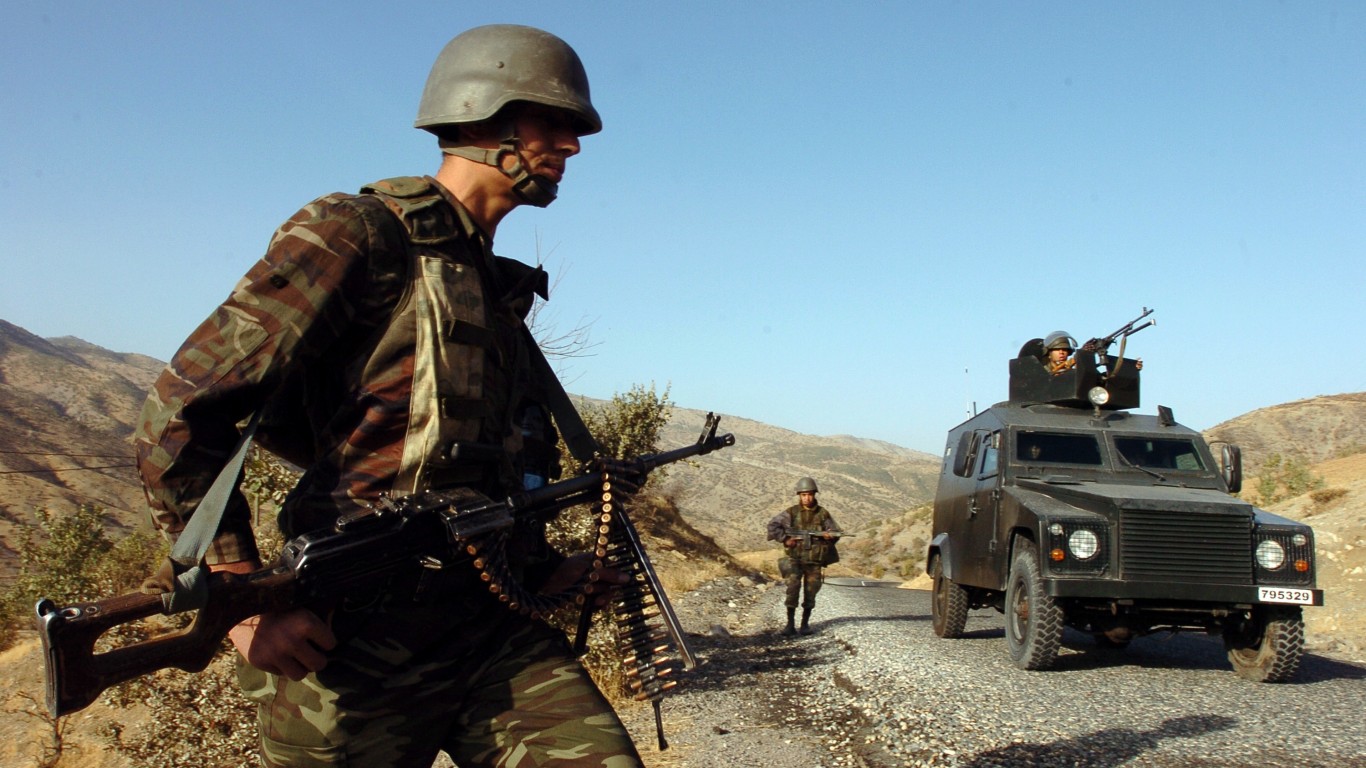
Source: Burak Kara / Getty Images
13. Turkey
> Share of global arms imports (2014-18): 2.3%
> Main supplier, share of importer’s total imports: USA, 60%
> GDP per capita: $25,135
> Armed forces, total personnel (2016): 512,000
Source: Gitoyo aryo / Wikimedia Commons
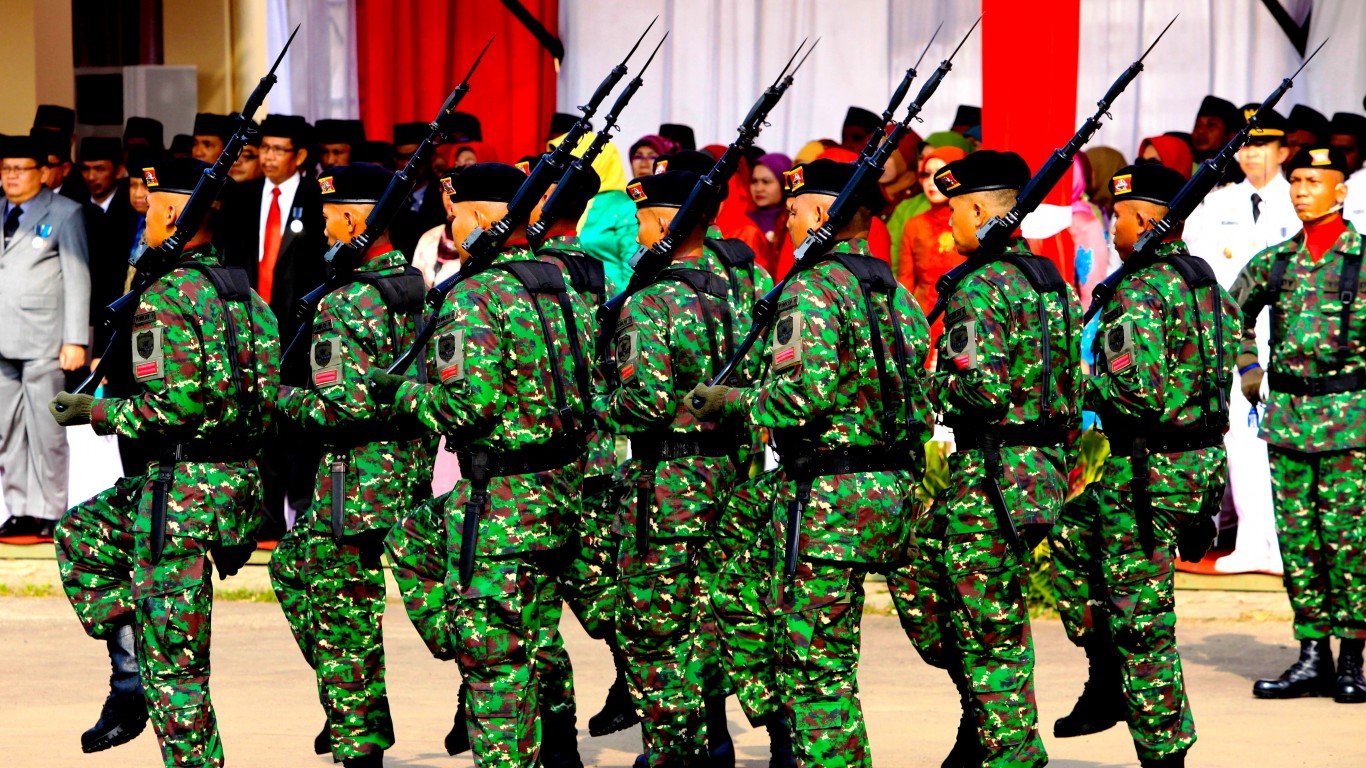
12. Indonesia
> Share of global arms imports (2014-18): 2.5%
> Main supplier, share of importer’s total imports: UK, 19%
> GDP per capita: $11,189
> Armed forces, total personnel (2016): 675,500
[in-text-ad-2]
Source: John Moore / Getty Images
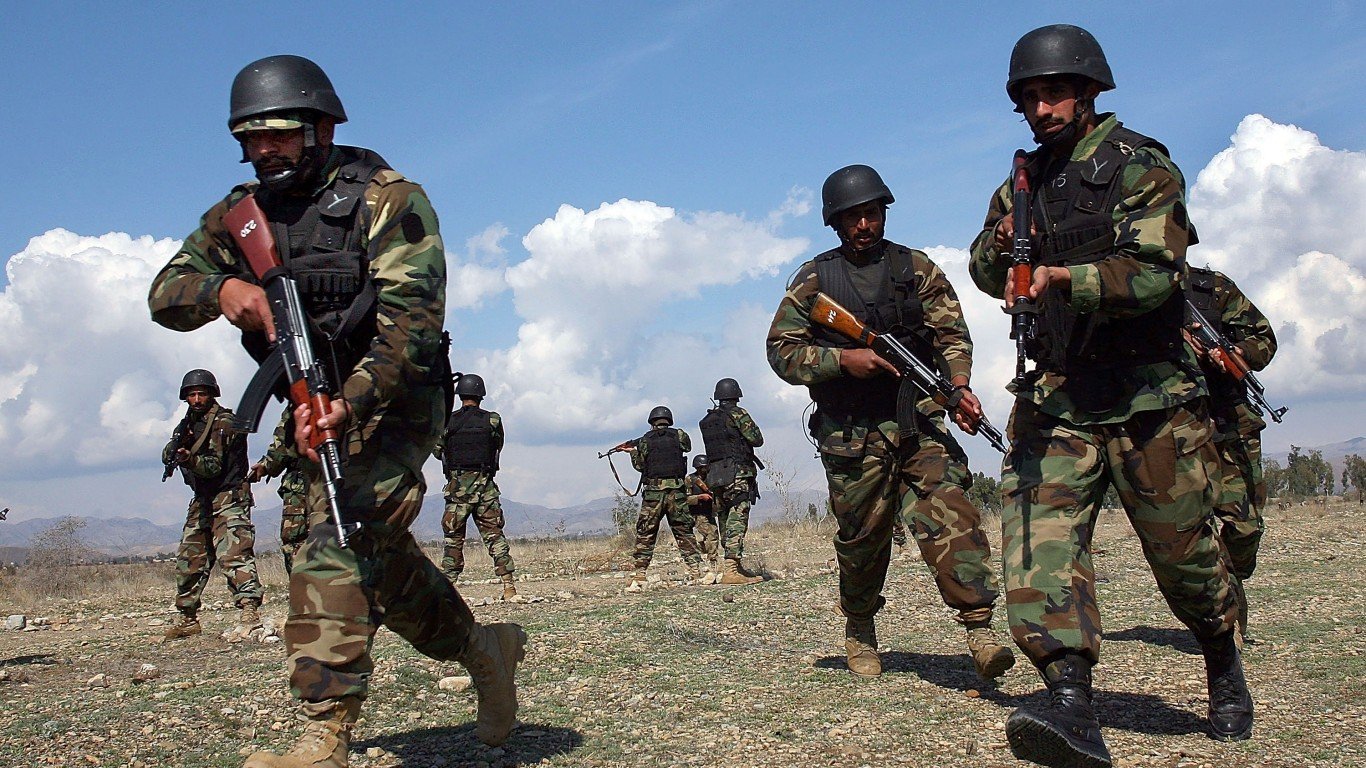
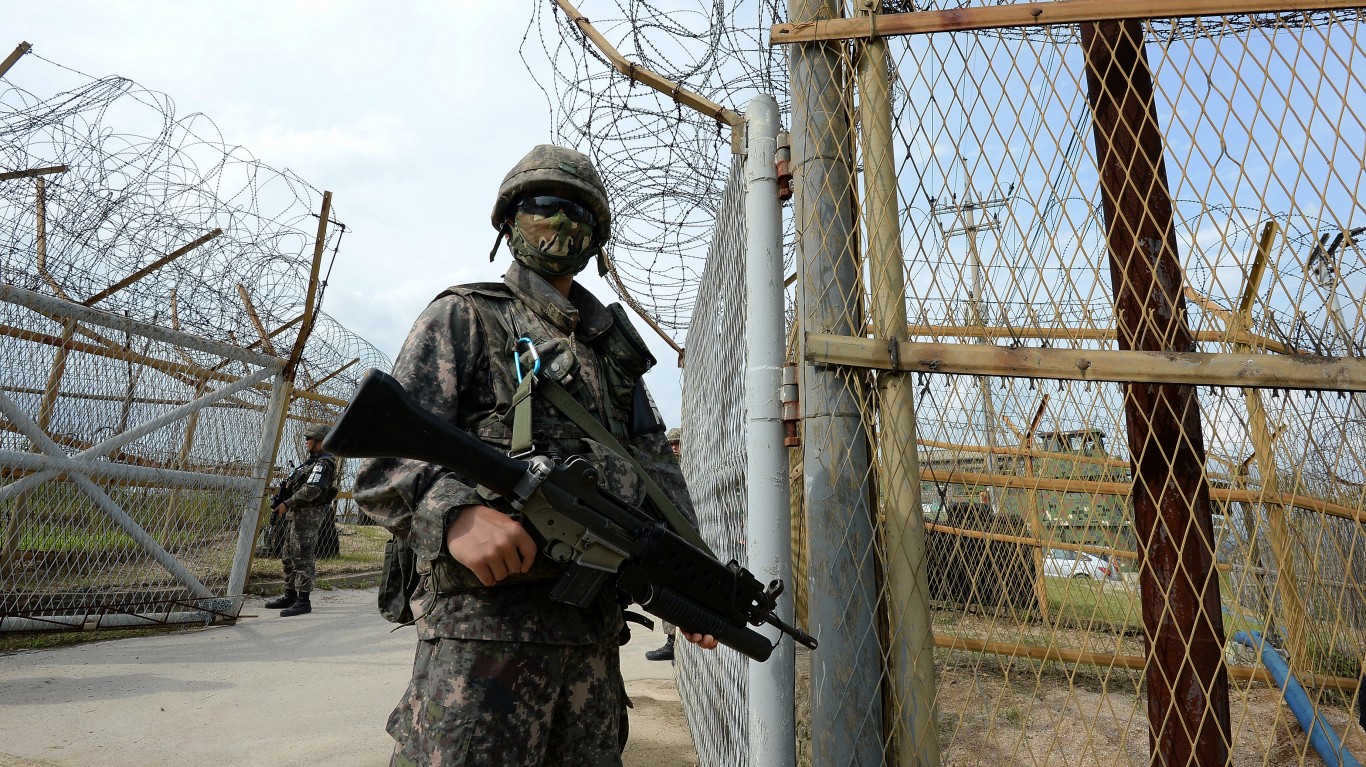
11. Pakistan
> Share of global arms imports (2014-18): 2.7%
> Main supplier, share of importer’s total imports: China, 70%
> GDP per capita: $5,035
> Armed forces, total personnel (2016): 935,800
Source: Photo by D. Myles Cullen / U.S. Department of Defense
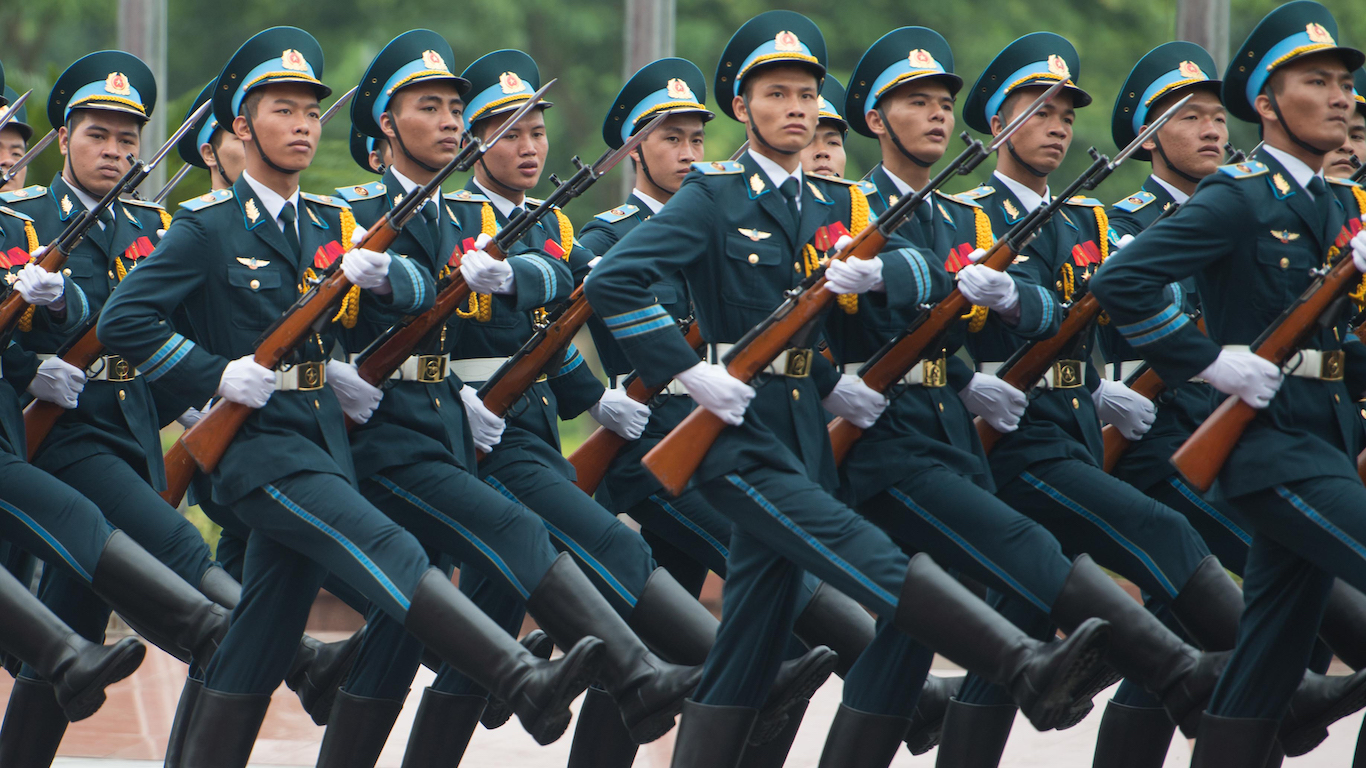
10. Vietnam
> Share of global arms imports (2014-18): 2.9%
> Main supplier, share of importer’s total imports: Russia, 78%
> GDP per capita: $6,172
> Armed forces, total personnel (2016): 522,000
[in-text-ad]
Source: Handout / Getty Images
9. South Korea
> Share of global arms imports (2014-18): 3.1%
> Main supplier, share of importer’s total imports: USA, 51%
> GDP per capita: $35,938
> Armed forces, total personnel (2016): 634,000
Source: Mstyslav Chernov / Wikimedia Commons
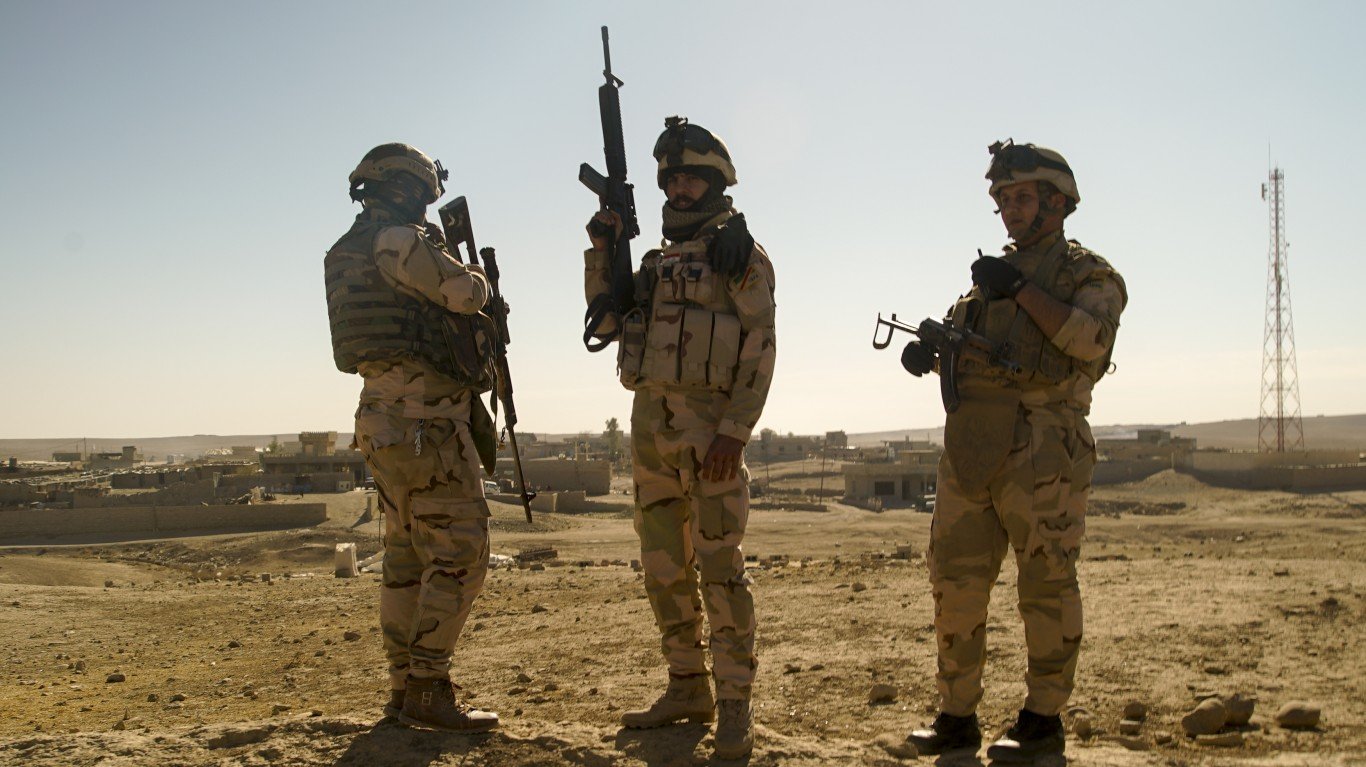
8. Iraq
> Share of global arms imports (2014-18): 3.7%
> Main supplier, share of importer’s total imports: USA, 47%
> GDP per capita: $15,393
> Armed forces, total personnel (2016): 209,000
Source: Handout / Getty Images
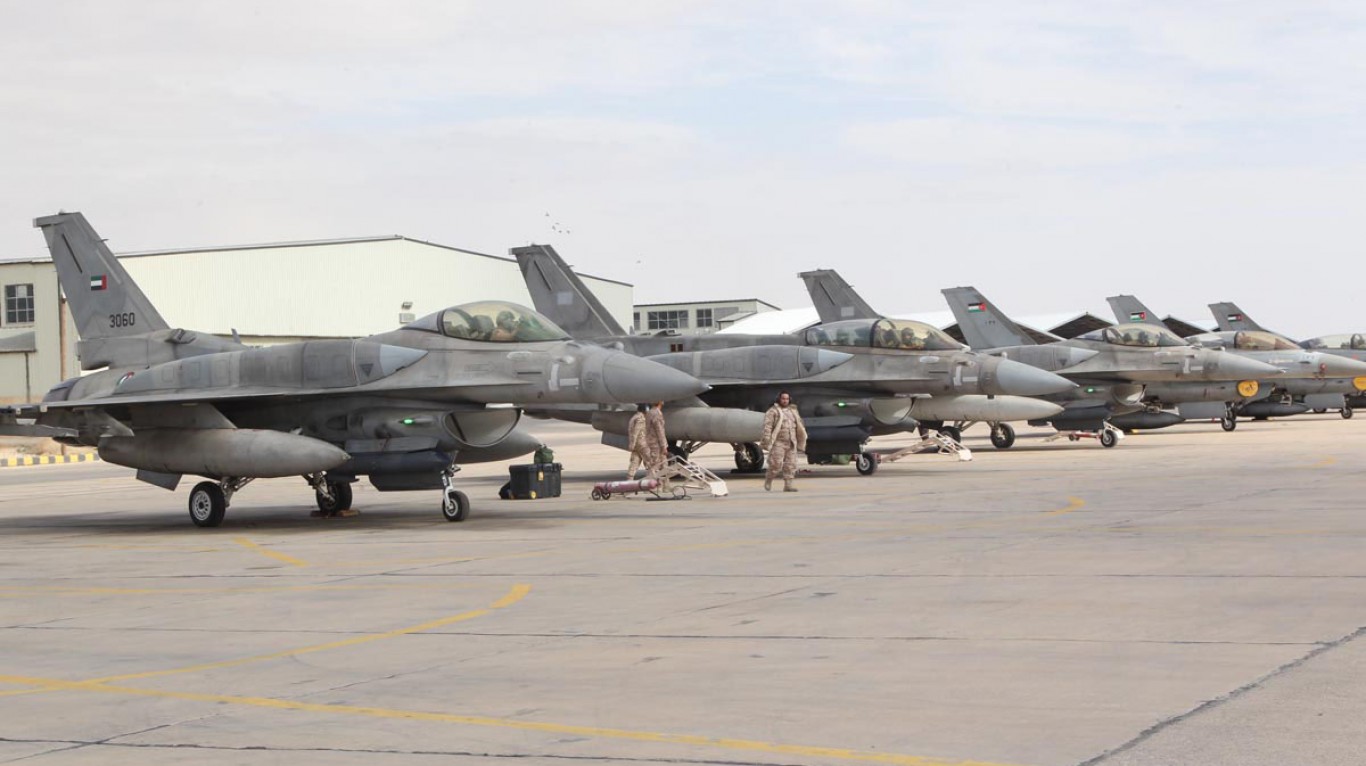
7. United Arab Emirates
> Share of global arms imports (2014-18): 3.7%
> Main supplier, share of importer’s total imports: USA, 64%
> GDP per capita: $67,293
> Armed forces, total personnel (2016): 63,000
[in-text-ad-2]
Source: Kevin Frayer / Getty Images
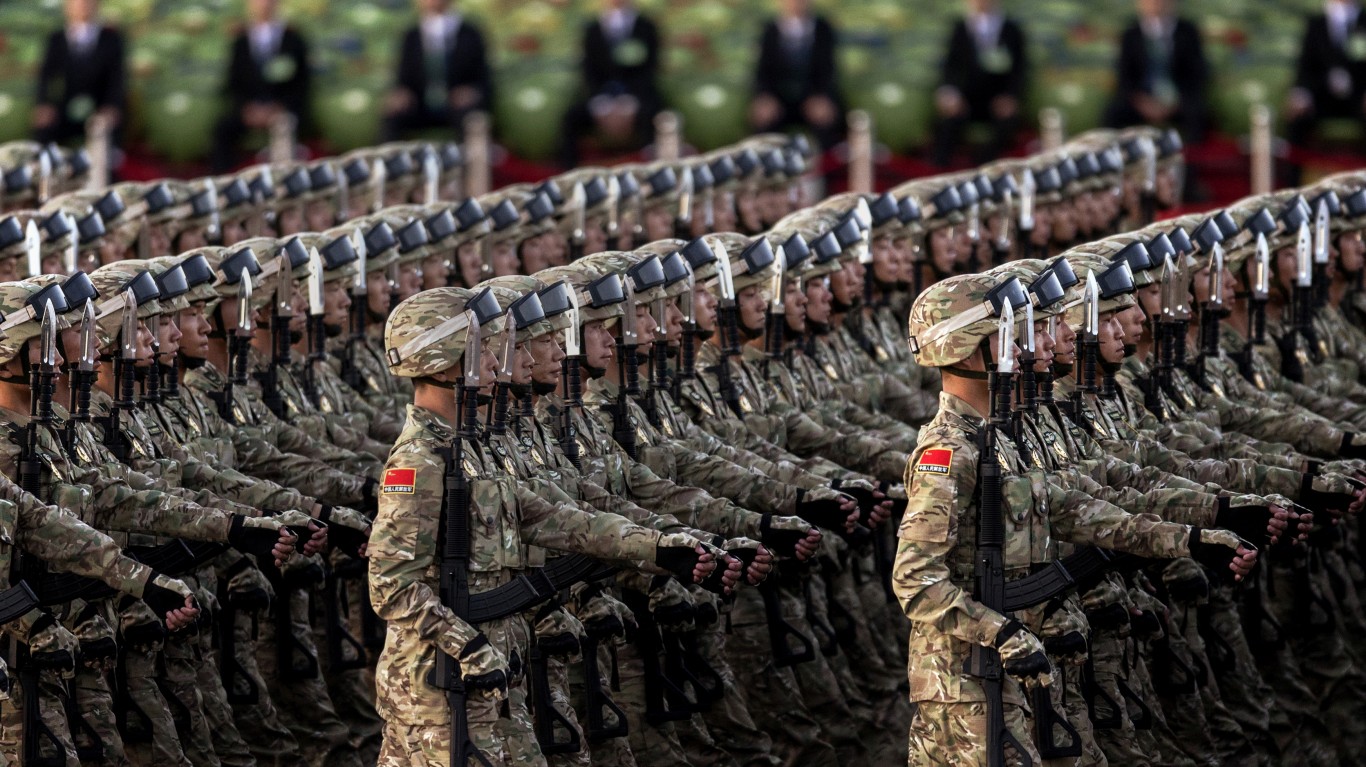
6. China
> Share of global arms imports (2014-18): 4.2%
> Main supplier, share of importer’s total imports: Russia, 70%
> GDP per capita: $15,309
> Armed forces, total personnel (2016): 2,695,000
Source: Public Domain / Wikimedia Commons
5. Algeria
> Share of global arms imports (2014-18): 4.4%
> Main supplier, share of importer’s total imports: Russia, 66%
> GDP per capita: $13,900
> Armed forces, total personnel (2016): 317,200
[in-text-ad]
Source: Ian Hitchcock / Getty Images
4. Australia
> Share of global arms imports (2014-18): 4.6%
> Main supplier, share of importer’s total imports: USA, 60%
> GDP per capita: $44,649
> Armed forces, total personnel (2016): 57,800
Source: Chris Hondros / Getty Images
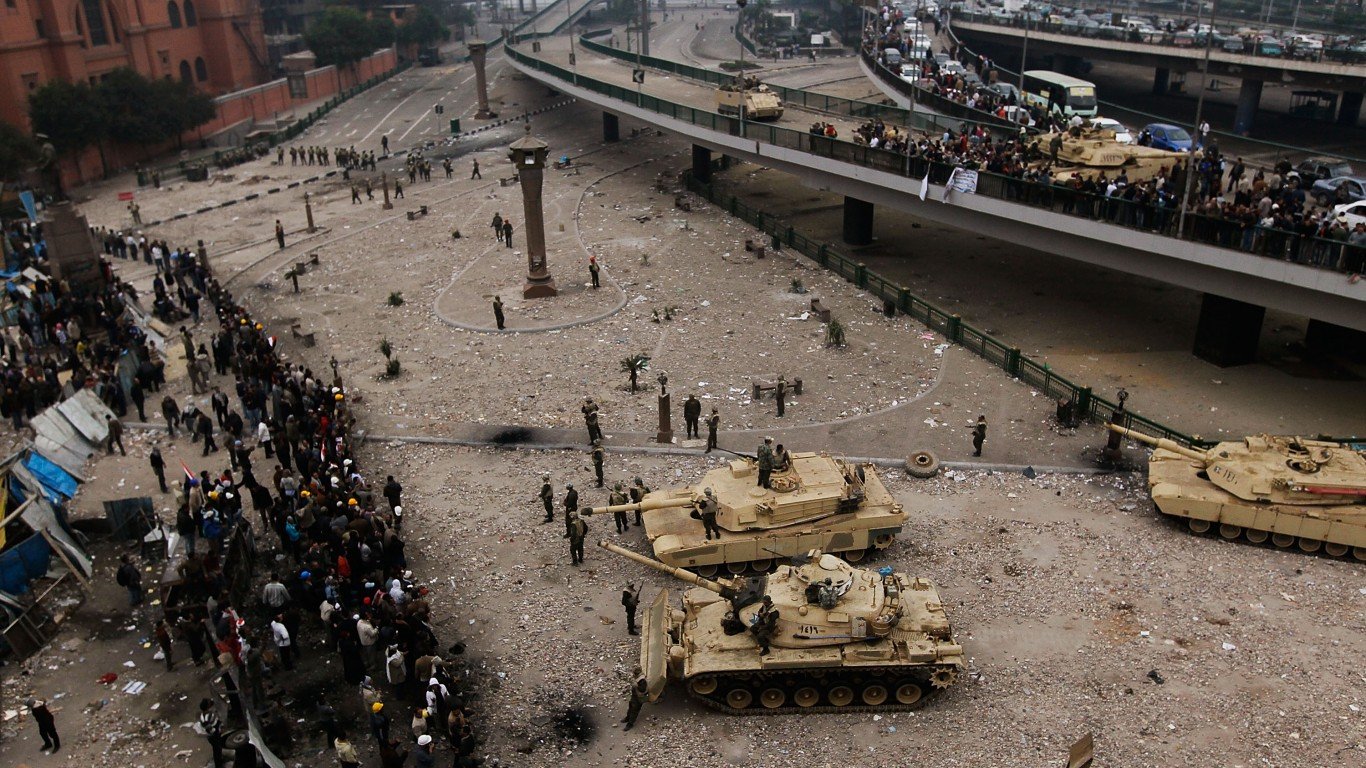
3. Egypt
> Share of global arms imports (2014-18): 5.1%
> Main supplier, share of importer’s total imports: France, 37%
> GDP per capita: $10,551
> Armed forces, total personnel (2016): 835,500
Source: Daniel Berehulak / Getty Images
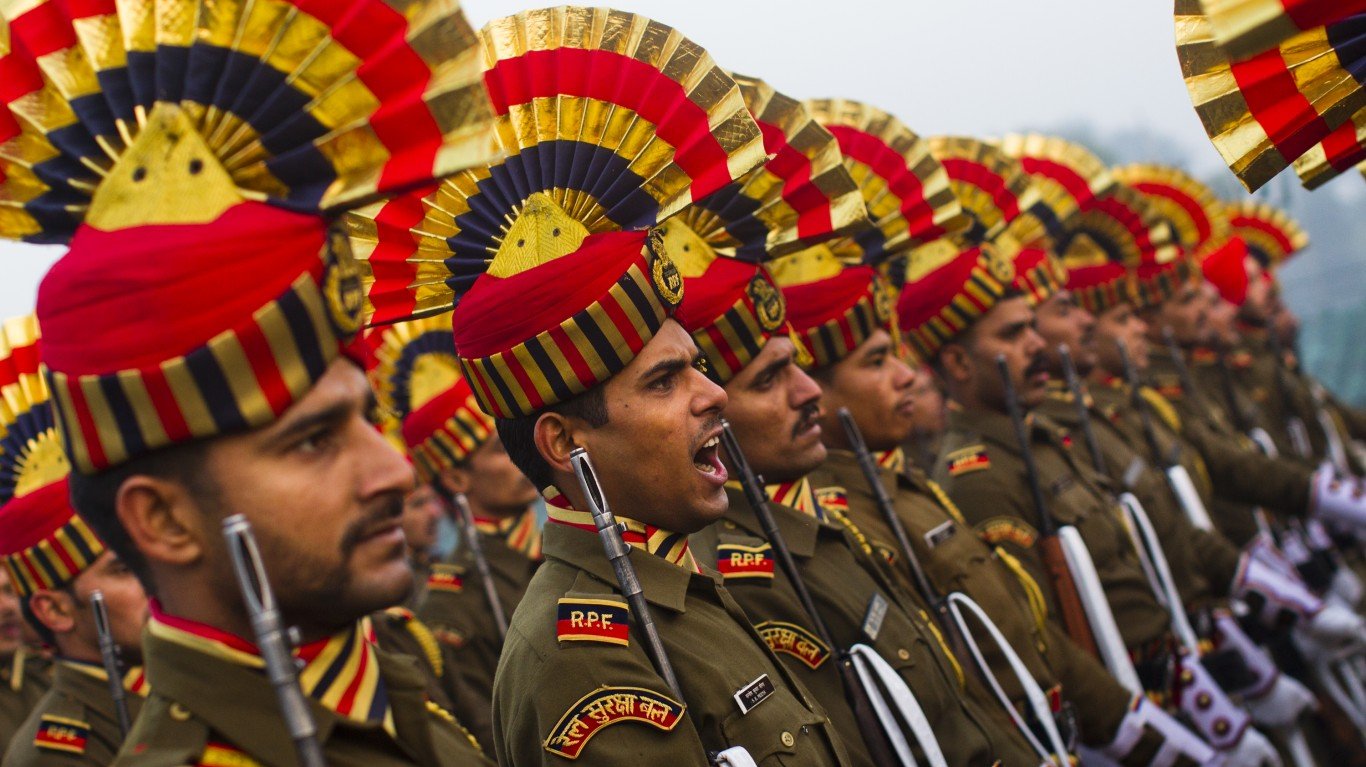
2. India
> Share of global arms imports (2014-18): 9.5%
> Main supplier, share of importer’s total imports: Russia, 58%
> GDP per capita: $6,430
> Armed forces, total personnel (2016): 2,981,050
[in-text-ad-2]

Source: Photo / Abid Katib / Getty Images
1. Saudi Arabia
> Share of global arms imports (2014-18): 12.0%
> Main supplier, share of importer’s total imports: USA, 68%
> GDP per capita: $48,986
> Armed forces, total personnel (2016): 251,500
Essential Tips for Investing: Sponsored
A financial advisor can help you understand the advantages and disadvantages of investment properties. Finding a qualified financial advisor doesn’t have to be hard. SmartAsset’s free tool matches you with up to three financial advisors who serve your area, and you can interview your advisor matches at no cost to decide which one is right for you. If you’re ready to find an advisor who can help you achieve your financial goals, get started now.
Investing in real estate can diversify your portfolio. But expanding your horizons may add additional costs. If you’re an investor looking to minimize expenses, consider checking out online brokerages. They often offer low investment fees, helping you maximize your profit.
Thank you for reading! Have some feedback for us?
Contact the 24/7 Wall St. editorial team.
Editors' Picks

