Technology
What Investors Have to Fear in Amazon and Google Earnings
Published:
Last Updated:
Thursday afternoon is one of those days that are absolutely packed with first-quarter earnings reports from technology giants. Among the expected and highly anticipated reports are those from Amazon.com Inc. (NASDAQ: AMZN) and Google Inc. (NASDAQ: GOOGL). Source: Thinkstock
By the view of 24/7 Wall St., investors may have a lot to fear from both earnings reports. It is silly to predict how earnings will be reacted to ahead of time, but some investors almost certainly will have some fears here about how each company reports their numbers.
Amazon.com might sit in a far better place than Google, if you just look at the trading performance. As such, we have included two-year charts (from StockCharts.com) below. The reality is that Amazon likely will need to have better numbers than some are expecting, and Google could end up being up or down by a large amount depending on its report.
Consensus estimates and analyst targets have been taken from Thomson Reuters.
Amazon
Jeff Bezos and team have consensus estimates of -$0.13 in earnings per share (EPS) on revenue of $22.43 billion. This would compare to a report of $0.23 EPS and $19.74 billion in revenue a year ago.
As far as what to expect ahead, Thomson Reuters has consensus estimates as follows:
ALSO READ: Is Prime Paying Off for Amazon?
Keep in mind that a $386 handle and the $0.37 EPS target for 2015 generate an expected price-to-earnings (P/E) ratio that is an embarrassing 1,000 or so — and the $2.36 EPS for 2016 generates a forward P/E of 163.
Bezos had shown for far too long that he was willing to run his business units at near-zero or even negative margins to grow and gain market share. Just do not forget that a 20-year-old company has to at some point start making real money.
Since the last time Amazon shares peaked just above $400, in late 2013 and the start of 2014, it took only five months for shares to plummet down to under $300. Now here we are back at $387 just under a year later. This almost certainly has to have set the bar much higher for the online seller of everything.
Amazon’s chart shows that the 50-day moving average is close to $378.50, while the 200-day moving average is all the way down at $335.66. With a prior peak of almost $410, a nosebleed valuation against consistently elusive earnings and a market cap of almost $180 billion, it just (again) sets the stage that Bezos has to come in with a “wow report” on the first quarter.
As far as stock options pricing, the closest speculative call and put options would cost a combined $31 — implying that options traders are braced for a move of well over 5% on the baseline and up to 8% on the higher-end. Now keep in mind that Amazon shares have been wildly volatile after most earnings reports.
ALSO READ: How Currency Issues Will Affect Internet Giants
Google shares are now in their post-split stage. That was actually more of a power grab by Larry and Sergey to give them control for years and years into the future, and investors remain very confused over the “GOOG” and “GOOGL” tickers.
Google (GOOGL estimates) is expected to report about $6.60 in EPS and $17.52 billion in revenue. This would compare to $6.27 EPS a year ago, and it would be a revenue gain of more than 13%. Google does not offer forward guidance, but for reference the consensus estimates are as follows:
Google is still growing earnings and revenues in the double digit percentages, yet it trades at about 18 times expected earnings. That sounds cheap, but the issue is that investors are having a harder time evaluating just what they are investing in and how they should value it.
Google is the undisputed king of Internet search. That being said, it is not very present in the social media growth wave. YouTube is still considered a financial wash despite its growth, and initiatives behind Chromecast, Google Docs, Gmail, Android and the rest make it harder for investors to know value. These may require massive spending, but the earnings are still geared mostly around search. Now throw in a driverless car, solar initiatives, a new cellular launch, a high-speed broadband initiative, funding space projects, and a couple dozen other big-ticket expense areas that eat deep into R&D budgets.
ALSO READ: Cowen’s 4 Top Internet Stocks to Buy Now
Now you know why Google’s valuation is harder to peg. As you will see below, the overwhelming majority of Google’s revenue comes from advertising, despite all of these other initiatives. This has another side too, if any of those big bets pay off down the road — Google could have billions of dollars worth of untold hidden value for new businesses.
Google’s chart also peaked in early 2014, shortly above $610, and then the $600 handle acted as very harsh resistance last July and September. Then $580 has been the dual point of resistance in 2015 — making for a period of lower highs.
Now Google’s chart is set for a serious battle. With shares now at $556, the 50-day moving average is $554.57 and the 200-day moving average is $557.55. That means that whatever the next move is directionally, it likely will lead chartists to believe that a new trading trend is in place.
Options traders do not seem as concerned about Google’s post-earnings reaction. The closest speculative call and put strikes would cost roughly $20 combined. The long and short of the matter is that Google options traders are only braced for a move of about 4% after earnings — even though the GOOGL shares have rallied almost $30 in just the past four trading sessions.
Now keep in mind that Google’s most recent earnings report disclosed that it had cash and cash equivalents totaling $64.4 billion at the end of December. That earnings report also showed the following metrics from Google:
ALSO READ: 5 Outstanding UBS Quality Growth at Reasonable Price Stock Picks
Analysts have a consensus price target of $623 for the GOOGL shares.
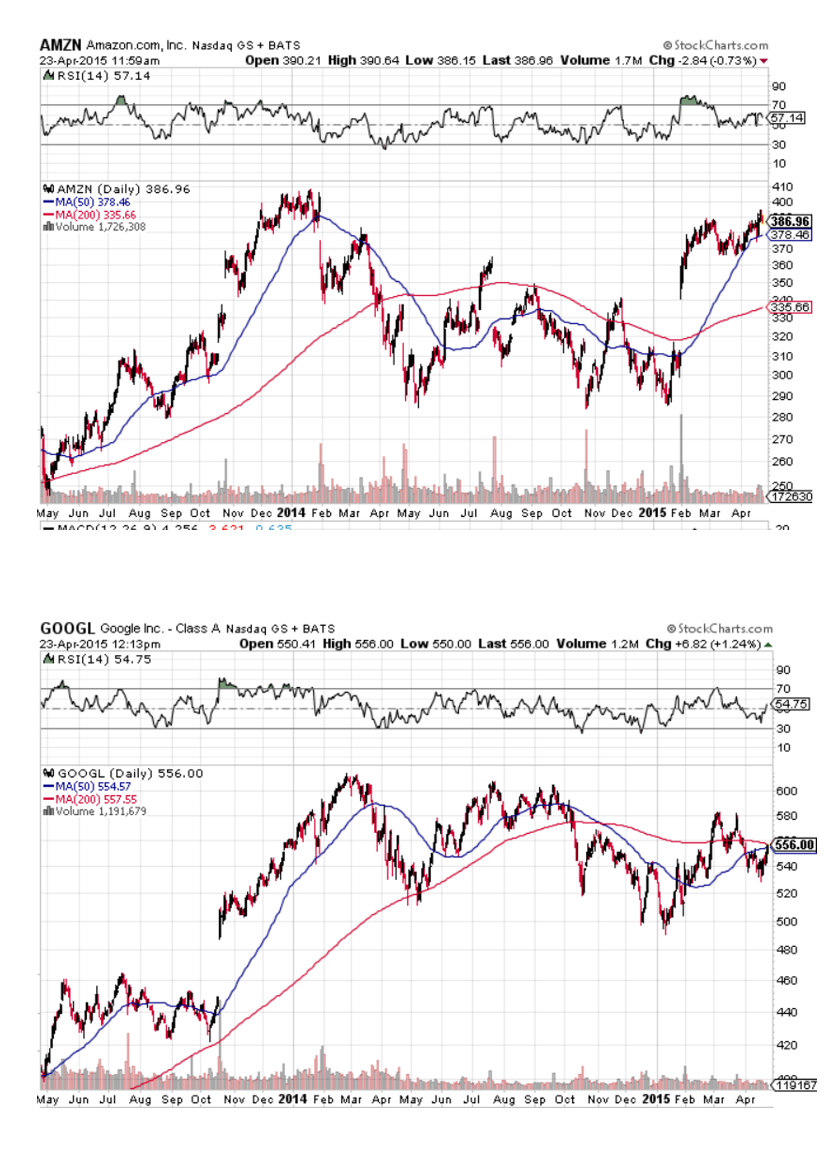 Source: stockcharts.com
ALSO READ: 5 Cheap Large Cap Stocks to Buy in a Pricey Stock Market
Are you ready for retirement? Planning for retirement can be overwhelming, that’s why it could be a good idea to speak to a fiduciary financial advisor about your goals today.
Start by taking this retirement quiz right here from SmartAsset that will match you with up to 3 financial advisors that serve your area and beyond in 5 minutes. Smart Asset is now matching over 50,000 people a month.
Click here now to get started.
Thank you for reading! Have some feedback for us?
Contact the 24/7 Wall St. editorial team.