The U.S. reported over 551,000 new cases of coronavirus over the seven days ending October 21, bringing the total count to more than 44.8 million confirmed cases of COVID-19. There have been more than 724,000 COVID-19-related deaths — the highest death toll of any country.
New cases continue to rise at a steady rate. In the past week, there were an average of 27.1 daily new coronavirus cases per 100,000 Americans — essentially unchanged from the week prior, when there were an average of 28.1 daily new coronavirus cases per 100,000 people.
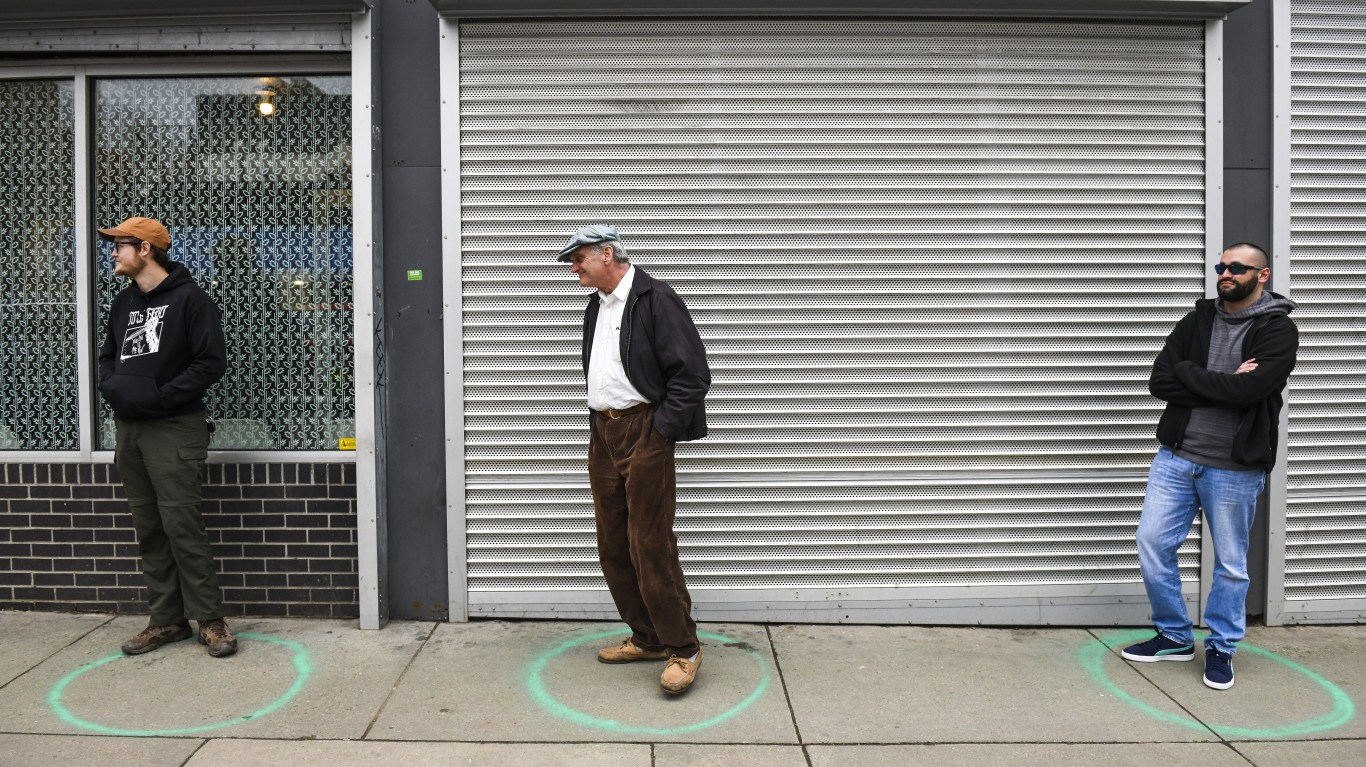
While new data shows that the risk of contracting COVID-19 is high in almost every part of the country, cities continue to be the sites of major outbreaks and superspreader events. Experts agree that the virus is more likely to spread in group settings where large numbers of people routinely have close contact with one another, such as colleges, nursing homes, bars, and restaurants. Metropolitan areas with a high degree of connectivity between different neighborhoods and a large population may be particularly at-risk.
The Modesto, CA metro area consists of just Stanislaus County. As of October 21, there were 15,786.3 confirmed cases of COVID-19 per 100,000 Modesto residents, 13.6% higher than the national rate. For comparison, the U.S. has so far reported 13,893.5 cases per 100,000 Americans nationwide.
In order to slow the spread of COVID-19, city and county governments have ordered the closure of thousands of consumer-facing businesses. These measures have led to widespread job loss and record unemployment. In the Modesto metro area, unemployment peaked at 17.4% in April 2020. As of May 2021, the metro area’s unemployment rate was 8.4%.
To determine how the incidence of COVID-19 in the Modesto, CA metro area compares to the rest of the country, 24/7 Wall St. compiled and reviewed data from state and local health departments. We ranked metro areas based on the number of confirmed COVID-19 cases per 100,000 residents.To estimate the incidence of COVID-19 at the metropolitan level, we aggregated data from the county level using boundary definitions from the U.S. Census Bureau. Population data used to adjust case and death totals came from the U.S. Census Bureau’s 2019 American Community Survey and are five-year estimates. Unemployment data is from the Bureau of Labor Statistics and is seasonally adjusted.
| FIPS | MSA | Population | Confirmed COVID-19 cases as of October 21 | Confirmed COVID-19 cases as of October 21 per 100,000 residents | Cumulative COVID-19 deaths as of October 21 | Cumulative COVID-19 deaths as of October 21 per 100,000 residents |
|---|---|---|---|---|---|---|
| 41860 | San Francisco-Oakland-Berkeley, CA | 4,701,332 | 346,032 | 7,360.3 | 3,889 | 82.7 |
| 42100 | Santa Cruz-Watsonville, CA | 273,962 | 20,943 | 7,644.5 | 218 | 79.6 |
| 41940 | San Jose-Sunnyvale-Santa Clara, CA | 1,987,846 | 152,543 | 7,673.8 | 1,967 | 99.0 |
| 42220 | Santa Rosa-Petaluma, CA | 499,772 | 40,865 | 8,176.7 | 402 | 80.4 |
| 34900 | Napa, CA | 139,623 | 12,864 | 9,213.4 | 100 | 71.6 |
| 42200 | Santa Maria-Santa Barbara, CA | 444,829 | 45,047 | 10,126.8 | 522 | 117.3 |
| 40900 | Sacramento-Roseville-Folsom, CA | 2,315,980 | 235,305 | 10,160.1 | 3,111 | 134.3 |
| 46700 | Vallejo, CA | 441,829 | 45,934 | 10,396.3 | 340 | 77.0 |
| 17020 | Chico, CA | 225,817 | 23,673 | 10,483.3 | 265 | 117.4 |
| 42020 | San Luis Obispo-Paso Robles, CA | 282,165 | 29,837 | 10,574.3 | 331 | 117.3 |
| 41740 | San Diego-Chula Vista-Carlsbad, CA | 3,316,073 | 365,253 | 11,014.6 | 4,170 | 125.8 |
| 41500 | Salinas, CA | 433,410 | 50,792 | 11,719.2 | 583 | 134.5 |
| 37100 | Oxnard-Thousand Oaks-Ventura, CA | 847,263 | 100,849 | 11,902.9 | 1,165 | 137.5 |
| 39820 | Redding, CA | 179,212 | 23,574 | 13,154.3 | 349 | 194.7 |
| 31080 | Los Angeles-Long Beach-Anaheim, CA | 13,249,614 | 1,802,990 | 13,607.9 | 31,977 | 241.3 |
| 44700 | Stockton, CA | 742,603 | 102,341 | 13,781.4 | 1,721 | 231.8 |
| 49700 | Yuba City, CA | 172,469 | 23,880 | 13,846.0 | 254 | 147.3 |
| 23420 | Fresno, CA | 984,521 | 145,378 | 14,766.4 | 2,063 | 209.5 |
| 31460 | Madera, CA | 155,433 | 23,720 | 15,260.6 | 285 | 183.4 |
| 32900 | Merced, CA | 271,382 | 42,089 | 15,509.1 | 579 | 213.4 |
| 33700 | Modesto, CA | 543,194 | 85,750 | 15,786.3 | 1,325 | 243.9 |
| 40140 | Riverside-San Bernardino-Ontario, CA | 4,560,470 | 728,247 | 15,968.7 | 10,614 | 232.7 |
| 12540 | Bakersfield, CA | 887,641 | 145,227 | 16,361.0 | 1,616 | 182.1 |
| 47300 | Visalia, CA | 461,898 | 79,627 | 17,239.1 | 958 | 207.4 |
| 20940 | El Centro, CA | 180,701 | 35,832 | 19,829.4 | 764 | 422.8 |
| 25260 | Hanford-Corcoran, CA | 150,691 | 32,649 | 21,666.2 | 320 | 212.4 |
Take This Retirement Quiz To Get Matched With A Financial Advisor (Sponsored)
Take the quiz below to get matched with a financial advisor today.
Each advisor has been vetted by SmartAsset and is held to a fiduciary standard to act in your best interests.
Here’s how it works:
1. Answer SmartAsset advisor match quiz
2. Review your pre-screened matches at your leisure. Check out the
advisors’ profiles.
3. Speak with advisors at no cost to you. Have an introductory call on the phone or introduction in person and choose whom to work with in the future
Take the retirement quiz right here.
Thank you for reading! Have some feedback for us?
Contact the 24/7 Wall St. editorial team.
Editors' Picks


