How the Personal Savings Rate Stacks Up Against GDP Gain
October 30, 2016 by Jon C. OggWhen the U.S. Department of Commerce’s Bureau of Economic Analysis (BEA) released its third-quarter preliminary gross domestic product (GDP) figure, there were many exceptions to consider behind the seemingly strong 2.9%. All in all, we cannot say that a 2.9% gain is bad by any means when it beat the 2.5% consensus estimates handily. It was also the best report since the third quarter of 2014.
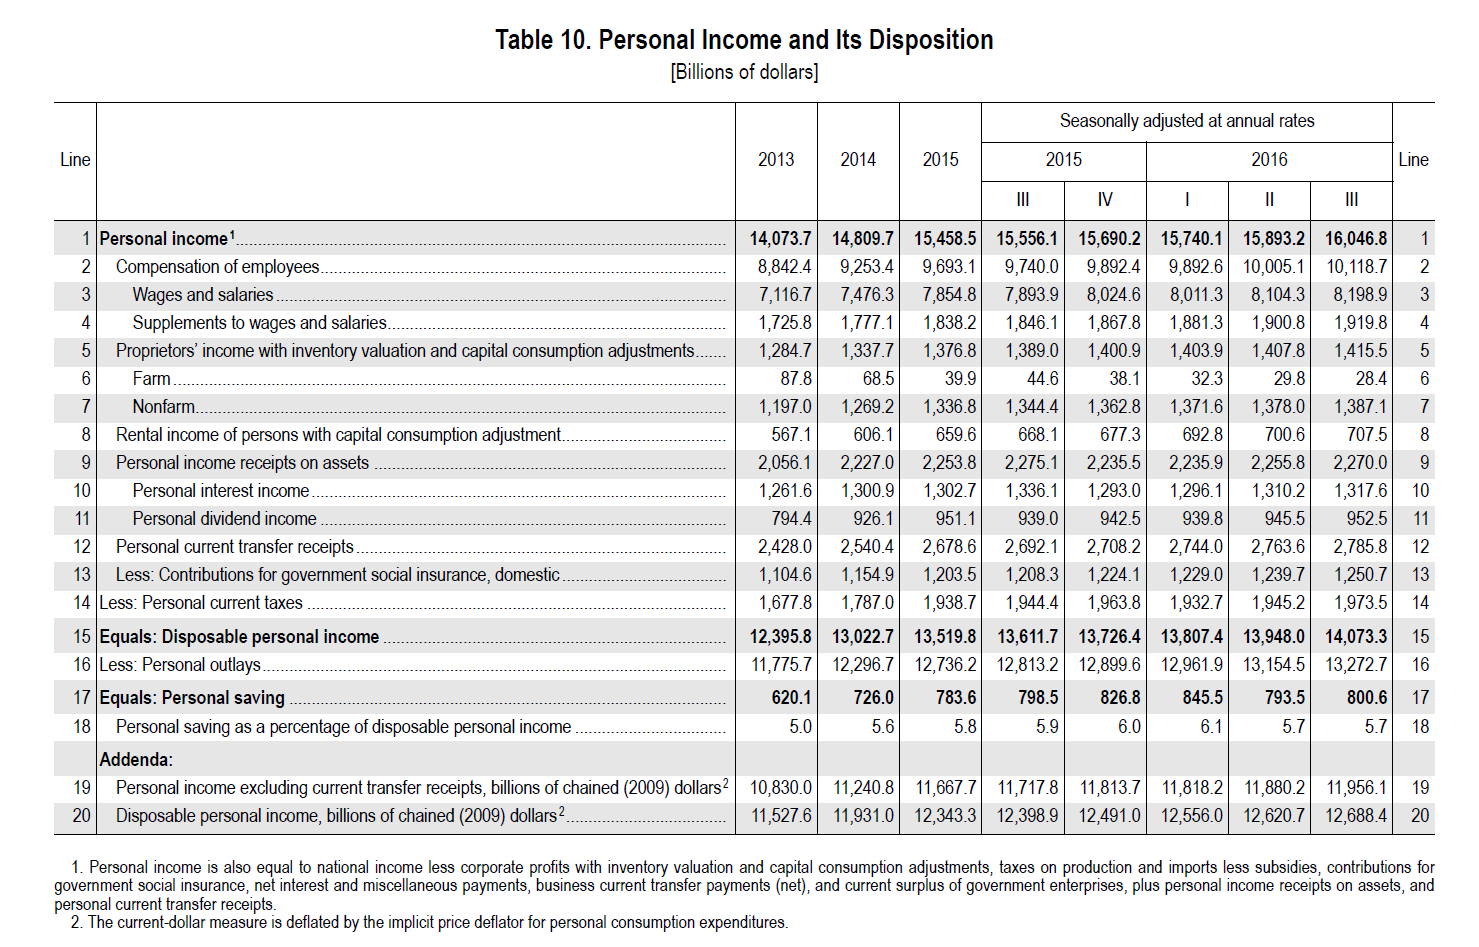
While many issues were listed as exceptions, one thing helping out is that personal income is on the rise. For 2016, we are at a seasonally adjusted run rate $16.046 trillion. That is up from $15.458 trillion in 2015 and from $14.809 trillion in 2014. Of that $16.05 trillion for 2016, $10.12 trillion was attributed to wages and salaries.
Then there is the disposable income and savings that have to be considered. Disposable personal income is on a $14.07 trillion rate in 2016, versus $13.52 trillion in 2015. If you look at total spending trends, the run rate for 2016 is now $14.07 trillion, and the personal savings rate is $800 billion. That generates a 5.7% personal savings rate (as a percentage of disposable personal income).
Here is how the Commerce Department described the personal income and savings rates:
Current-dollar personal income increased $153.6 billion in the third quarter, compared with an increase of $153.1 billion in the second.
Disposable personal income increased $125.3 billion, or 3.6 percent, in the third quarter, compared with an increase of $140.6 billion, or 4.1 percent, in the second. Real disposable personal income increased 2.2 percent, compared with an increase of 2.1 percent.
Personal saving was $800.6 billion in the third quarter, compared with $793.5 billion in the second. The personal saving rate — personal saving as a percentage of disposable personal income — was 5.7 percent in the third quarter, the same as in the second.
This personal savings rate of 5.7% as a percentage of disposable income may look high on the surface. Unfortunately, it is not if you consider that the personal savings rate is actually on a downward path from earlier in 2016 and in 2015. Also note that personal savings actually detracts from spending, and therefore personal savings actually hurts GDP.
The personal savings rate as a percentage of disposable personal income of 5.7% in the third quarter of 2016 was actually the same percentage as in the second quarter. The rate from the first quarter of 2016 was 6.1% — versus 6.0% in the fourth quarter of 2016 and 5.9% in the third quarter of 2015.
For an annual comparison, the 2015 savings rate was 5.8% in 2015, 5.6% in 2014 and 5.0% in 2015. If we get one more downtick in the fourth quarter of 2016, then we will have started to see a personal savings rate contraction.
Now consider that Forbes, USA Today and a host of other outlets recently ran the statistic that 69% of Americans do not have even $1,000 in savings to spend in a crisis.
This is one of those situations when there is a delicate balance among what the economic readings need versus what each household needs. A dollar saved is a dollar that doesn’t drive GDP, but a dollar saved is something everyone needs to have (or several thousand of them!). Those pennies saved also end up being spent at some point in the future, which will drive GDP at that time.
Below is the BEA’s table on personal income and spending.
Take This Retirement Quiz To Get Matched With An Advisor Now (Sponsored)
Are you ready for retirement? Planning for retirement can be overwhelming, that’s why it could be a good idea to speak to a fiduciary financial advisor about your goals today.
Start by taking this retirement quiz right here from SmartAsset that will match you with up to 3 financial advisors that serve your area and beyond in 5 minutes. Smart Asset is now matching over 50,000 people a month.
Click here now to get started.