Finding a bottom in the price of oil has become an elusive game of cat and mouse — or maybe a game of dollars versus logic. What is amazing to see is the absolute flush out that is taking place in the companies that win and lose with the fortunes of oil and gas. With many oil stocks down 30%, 40% or even over 50% from their highs, 24/7 Wall St. wanted to see what exactly this flush looks like — and hopefully try to figure where a bottom could be, assuming that bottom is “lower.” Source: Thinkstock
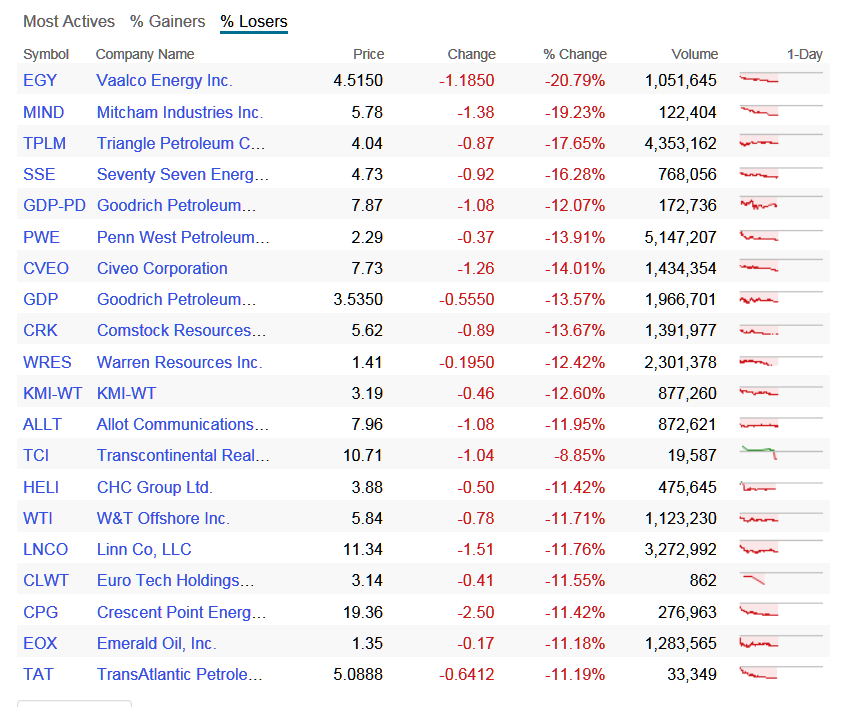
Of the 20 worst-performing stocks on the NYSE and Nasdaq on Wednesday, it turns out that all but one is tied to energy. The one that is not tied to energy is on such small volume that it shouldn’t even be counted. We have included a table from Yahoo! Finance below, but the aim here is to figure out just how bad things are — and just how bad things can get.
The International Energy Agency (IEA) recently lowered its 2015 estimate for oil demand growth by 300,000 barrels per day (down from 1.1 million prior) to 93.5 million. With demand said to be waning, we are rounding the daily global oil demand down to 90 million barrels or so and use the current $60 handle as the price for a floor level (if this is a floor of course) — knowing that oil prices globally fluctuate from the at-the-market level from West Texas Intermediate crude — you get a global daily oil marketplace value of $5.4 billion.
Comparing the daily value of stocks traded is not a typical way to evaluate a stock. First off, machines trade much of the volume. More dollars are traded in many key bank stocks and technology stocks that the key companies do in daily revenues as well. Still, when we are looking for an extreme to see where a bottom could be in oil — still looks and acts lower presumably — any and every tool has to come out of the box to see what we are really looking at.
ALSO READ: The 5 Most Shorted Stocks on the New York Stock Exchange
So, if we tally up the average daily volume of the stock value alone as follows, with rounding to nearest levels of course, we evaluated 10 top stocks with their daily trading volumes on NYSE (see on page 2), and the value of just these stocks comes to $5.1 billion per day. Again, the effort here is not to try to use the equity volume and dollars traded around the stocks as a barometer.
Now let’s look at the chart on front month oil from Barcharts.com (see below) that goes back 25 years. This current trend is simply becoming the second worst downdraft we have seen in a generation. The only time it was worse was the 2008 oil bubble bursting, which was right in the middle of the economic meltdown during the Great Recession.
Does this chart signal a bottom down close to $50? Or does it get a tad worse? For things to get worse than $50, one might have to assume that the next leg of the global downturn is imminent. Or so logic might dictate. Using a chart alone is hard to do for fundamental investors, but something is happening now that will remain static:
- Does OPEC want to run the new high-cost producers out of business (hint, frackers, that is you)? It seems so. Can they absorb losses and pain if necessary to reestablish market share floors ahead? Almost certainly.
Now think about the financial side of the trade when oil began skyrocketing in 2007 and well into 2008. The same argument that took oil up each day — from $90 to $100, and $100 to $110, and $110 to $120, and $120 to over $140 — it was the same rationale used for the argument every single day. A shortfall of production versus demand was the common discussion, but there was never really a single net delivery miss anywhere in the world. Not once was there a series of oil tankers that arrived at port to find that there was no oil to load. What really drove that price up endlessly was that the flow of money simply took over the actual market.
ALSO READ: 11 Very Popular Stocks Now Valued Over 50 Times Earnings
What seems obvious this time around is that the financial side of the trade has again completely overtaken the fundamentals of supply and demand. To the downside that is. That being said, this downward move looks and feels like the inverse of what happened from 2007 to 2008. When it ends is of course a guess, as is at what price the floor occurs. The raw dollars involved are far more active than the fundamentals in the pricing side of the equation right now.
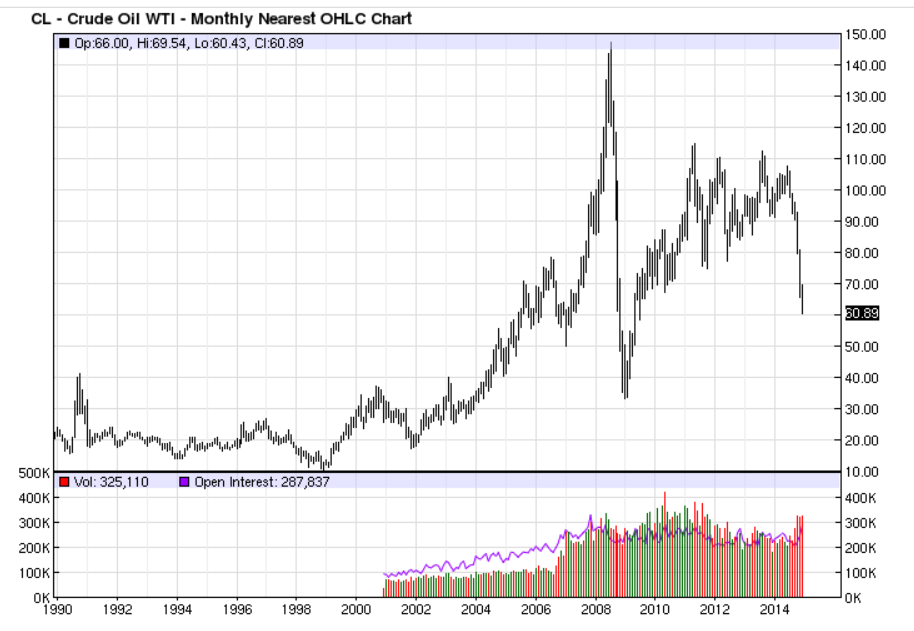 Source: barchart.com
Please note: These values are provided for reference only. They are not an attempt to show the value of oil today versus the weighted dollar volume of their shares traded. The table provided at the end of this article is to show that virtually all the biggest percentage losers on Wednesday were in the oil and gas sector.
Exxon Mobil Corp.’s (NYSE: XOM) 13.3 million shares per day at $89 comes to $1.05 billion in daily stock value traded. Exxon Mobil shares are down about 15% from their 52-week high.
Chevron Corp.’s (NYSE: CVX) 7.8 million shares per day at $104 comes to $810 million in daily stock value traded. Chevron is down 23% from its 52-week high.
Kinder Morgan Inc.’s (NYSE: KMI) 23 million shares per day at $39.50 generates almost $910 million in daily stock value traded. Kinder Morgan is on the infrastructure side of the equation, so it is only down just over 5% from its fresh highs.
Occidental Petroleum Corp.’s (NYSE: OXY) 6 million shares per day at $75 is $450 million in daily stock value traded. Occidental is down over 25% from its 52-week high now.
ConocoPhillips (NYSE: COP), at almost 8 million shares per day at $63.50, is just over $500 million in daily stock value traded. ConocoPhillips is down 27% from its 52-week high.
ALSO READ: The 7 Best Investments of 2014
Add in BP PLC (NYSE: BP) and Petróleo Brasileiro S.A. (NYSE: PBR), or Petrobras, and you get another $500 million in total dollars per day traded in the ADSs in New York alone (not counting home markets).
Lastly, add in Phillips 66 (NYSE: PSX) at just over $300 million per day in stock traded and add in Valero Energy Corp. (NYSE: VLO) at $375 million or so in daily stock traded, as well as Marathon Oil Corp. (NYSE: MRO) at $190 million in daily stock traded, and you get another $865 million in combined daily stock value.
The grand total above comes to an equity value of almost $5.1 billion. That is solely the value of the key oil equities traded on the New York Stock Exchange. This ignores the hundreds of additional oil and gas stocks and their infrastructure and transport stocks that trade on the NYSE and Nasdaq — again versus a current projected $5.4 billion daily value of the world’s daily oil demand.
Then there is the volume in futures and options around oil. The CME website for October trading volumes showed the following:
- Average daily volume for October 2014 Light Sweet Crude Oil futures was 693,007 contracts.
- Average daily volume for October 2014 Light Sweet Crude Oil options was 185,708 contracts.
ALSO READ: The 7 Worst Investments of 2014
Essential Tips for Investing: Sponsored
A financial advisor can help you understand the advantages and disadvantages of investment properties. Finding a qualified financial advisor doesn’t have to be hard. SmartAsset’s free tool matches you with up to three financial advisors who serve your area, and you can interview your advisor matches at no cost to decide which one is right for you. If you’re ready to find an advisor who can help you achieve your financial goals, get started now.
Investing in real estate can diversify your portfolio. But expanding your horizons may add additional costs. If you’re an investor looking to minimize expenses, consider checking out online brokerages. They often offer low investment fees, helping you maximize your profit.
Thank you for reading! Have some feedback for us?
Contact the 24/7 Wall St. editorial team.
Editors' Picks


