Health and Healthcare
How Just 10 States Saved Almost $120 Billion in 2015 Using Generic Drugs
Published:
Last Updated:
It is no secret that the health care system in America needs help. Treatment costs have gone through the roof over the past two decades, and there is an ongoing debate over just how good the health care is for the money that gets spent. There is a common thread in America that seems to be true regardless of which side of the political aisle voters fall on. Americans generally would like to spend less money on health care. One way that this can be and will be accomplished is through the continued use and expanded use of generic drugs.
When drugs go off-patent, competing drug makers are free to launch generic drugs. This often takes those brand drug sales from having hundreds of millions or billions of dollars in annual revenues down to the tens or hundreds of millions of dollars per year.
The QuintilesIMS Institute, on behalf of the Generic Pharmaceutical Association, has released the 2016 Generic Drug Savings and Access in the United States. Clearly this report is a pro-generic drug by design. That caveat aside, 24/7 Wall St. still wanted to see what the represented savings might be. The report shows a shocking number, that generic savings reached $227 billion in 2015 — and that generic drugs saved $1.46 trillion in a 10-year period (2006 to 2015).
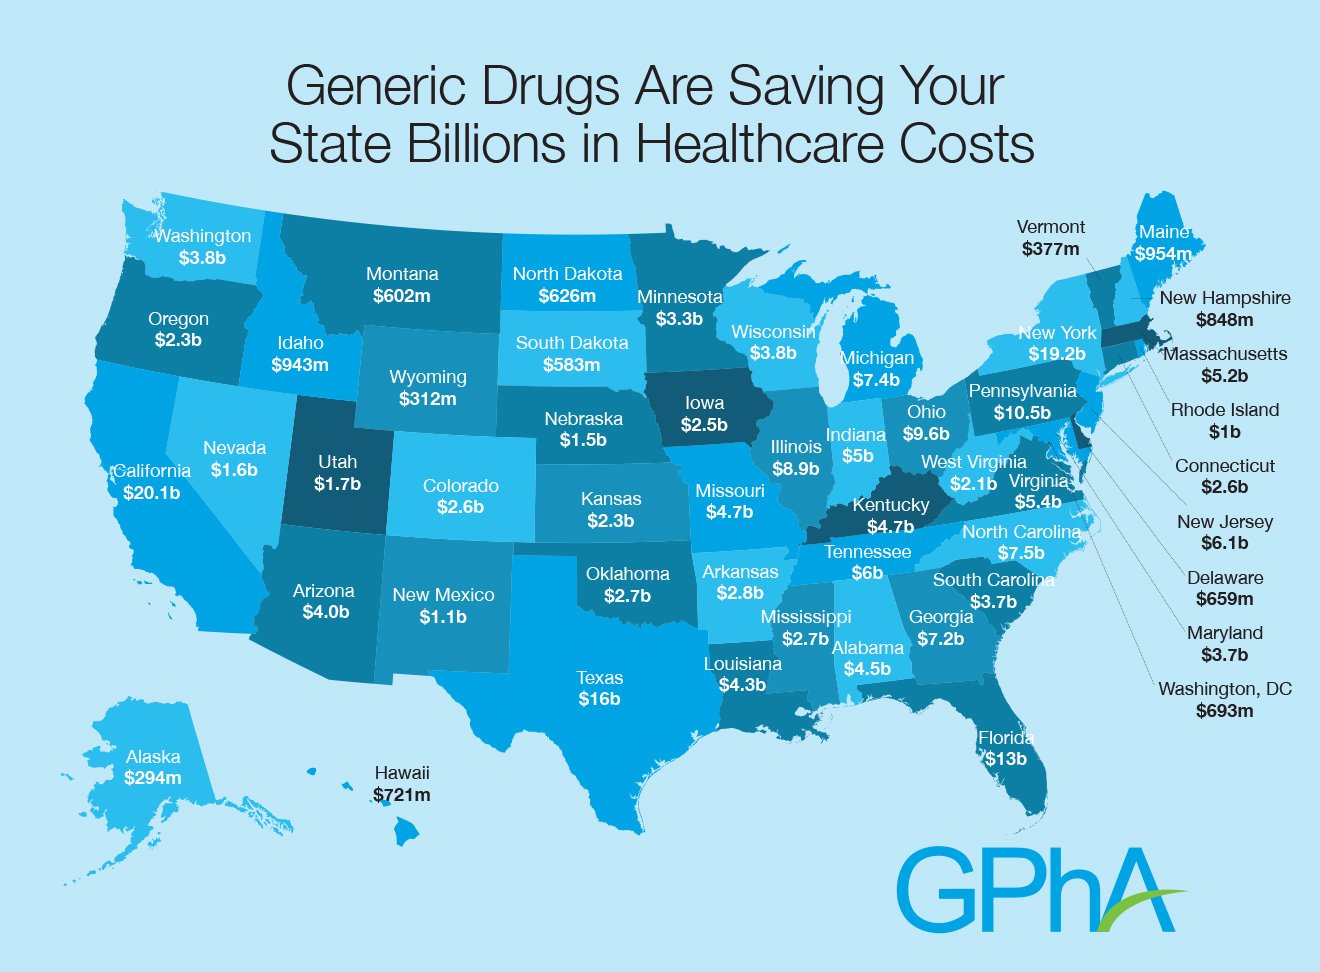
24/7 Wall St. looked through this report and its map on a state-by-state basis. It turns out that just 10 states were projected to have saved almost $120 billion (see table below) of that total national $227 billion in savings in 2015 alone.
The report shows how vast the use of generic drugs is, versus how little of the total pie of pharmaceutical spending. It says:
Nearly 3.9 billion of the total 4.4 billion prescriptions dispensed in the United States are for generics. Generics make up 89% of prescriptions dispensed but only 27% of total medicine spending. Put another way, brand drugs are 11% of prescriptions and responsible for 73% of drug costs.
As you might expect, the larger the state, the larger the savings for generics. That means that California, New York, Texas and other large states dominate the savings. Still, just 10 states of the entire 50 came to over $119 billion (see table below) and made up over 50% of the entire savings for the whole country by using generic drugs. If you want to know just some of the blockbuster branded drugs that have gone off patent in recent years, they are Oxycontin, Nexium, Cymbalta, Celebrex, Abilify, Copaxone, Gleevec, Neulasta, Crestor and many more.
One issue that stood out handily was the savings in Medicare and Medicaid. The Medicare savings alone of $67.6 billion in 2015 were represented as translating to savings of $1,737 per enrollee. The Medicaid savings of $32.7 billion were represented as saving $450 per enrollee in 2015. That isn’t chump change by any measurement.
The methodology for how each state saved money was based upon Medicaid, Medicare, cash (non-insured) and commercial insured. These have been included for each state as well and were taken directly from the report. Here are 10 states that made up over half of all generic drug savings in 2015.
1. California Total 2015 Savings: $20.1 billion
> Medicaid: $3.6 billion
> Medicare: $6.4 billion
> Cash (Non-Insured) $1.1 billion
> Commercial Insured: $8.9 billion
2. New York Total 2015 Savings: $19.2 billion
> Medicaid: $4.4 billion
> Medicare: $6.1 billion
> Cash (Non-Insured) $692 million
> Commercial Insured: $7.9 billion
3. Texas Total 2015 Savings: $16 billion
> Medicaid: $1.5 billion
> Medicare: $4.4 billion
> Cash (Non-Insured) $1.1 billion
> Commercial Insured: $8.9 billion
4. Florida Total 2015 Savings: $13 billion
> Medicaid: $1.6 billion
> Medicare: $4.6 billion
> Cash (Non-Insured) $925 million
> Commercial Insured: $5.8 billion
5. Pennsylvania Total 2015 Savings: $10.5 billion
> Medicaid: $1.5 billion
> Medicare: $3.4 billion
> Cash (Non-Insured) $385 million
> Commercial Insured: $5.1 billion
6. Ohio Total 2015 Savings: $9.6 billion
> Medicaid: $1.8 billion
> Medicare: $2.7 billion
> Cash (Non-Insured) $436 million
> Commercial Insured: $4.5 billion
7. Illinois Total 2015 Savings: $8.9 billion
> Medicaid: $1.2 billion
> Medicare: $2.5 billion
> Cash (Non-Insured) $547 million
> Commercial Insured: $4.5 billion
8. North Carolina Total 2015 Savings: $7.5 billion
> Medicaid: $803 million
> Medicare: $2.3 billion
> Cash (Non-Insured) $465 million
> Commercial Insured: $3.8 billion
9. Michigan Total 2015 Savings: $7.4 billion
> Medicaid: $1.2 billion
> Medicare: $2.2 billion
> Cash (Non-Insured) $447 million
> Commercial Insured: $3.5 billion
10. Georgia Total 2015 Savings: $7.2 billion
> Medicaid: $752 million
> Medicare: $2.2 billion
> Cash (Non-Insured) $570 million
> Commercial Insured: $3.6 billion

A review of the 24/7 Wall St. site for “generics” will show just how the impact of certain generics can be for the companies releasing them and for the companies with drugs coming off patent.
While not all data is available matching up from year to year, official Centers for Medicare & Medicaid Services (CMS) data for 2014 showed that U.S. health care spending in 2014 increased by 5.3% (following growth of 2.9% in 2013) to reach $3.0 trillion. This figure represented some $9,523 per person, and the share of the economy devoted to health care spending was 17.5% in 2014, versus 17.3% in 2013.
CMS noted that the growth of health care spending in 2014 was primarily due to the major coverage expansions under the Affordable Care Act, particularly for Medicaid and private health insurance.
24/7 Wall St. looked at the data from the World Bank, and they used the World Health Organization Global Health Expenditure database to show this as well. Unfortunately, their view of the percentage of the economy for 2014 was 17.1%. Despite the discrepancy of the WHO data and CMS data, the reality is that there is one obvious standout issue here that the United States spends far more in health care as a percentage of the total economy (by GDP) than other nations. Their 2014 data showed the percentages as follows:
Are you ready for retirement? Planning for retirement can be overwhelming, that’s why it could be a good idea to speak to a fiduciary financial advisor about your goals today.
Start by taking this retirement quiz right here from SmartAsset that will match you with up to 3 financial advisors that serve your area and beyond in 5 minutes. Smart Asset is now matching over 50,000 people a month.
Click here now to get started.
Thank you for reading! Have some feedback for us?
Contact the 24/7 Wall St. editorial team.