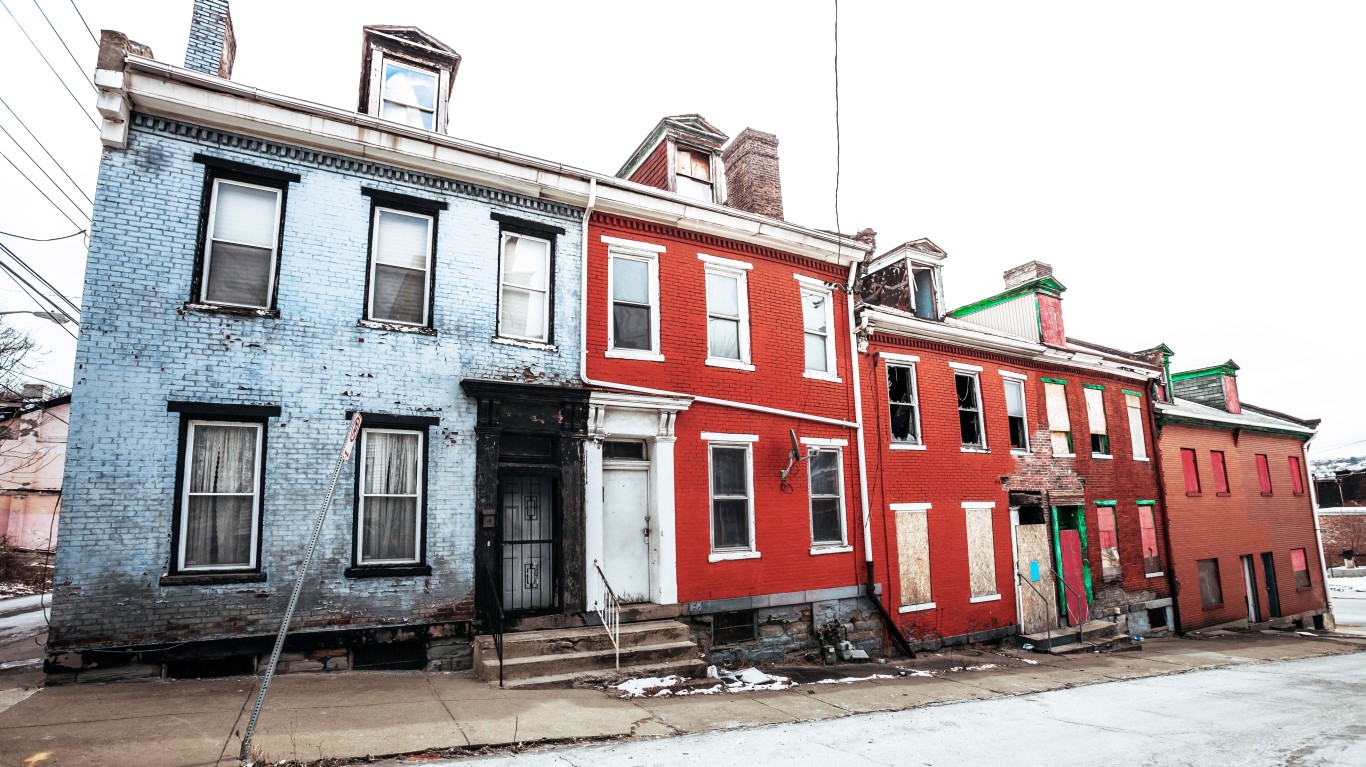
Source: Thinkstock
Read: The 10 Markets with the Most Empty Houses
But a less-watched indicator called vacancy rates speaks volumes about a housing market’s long-term condition. A home that sits idle does not merely diminish the value of other homes on the market, it also discourages investment in an entire neighborhood. High home vacancy rates can be toxic to real estate prices.
Based on vacancy data provided by Trulia, a leading aggregator of real estate listings, 24/7 Wall St. reviewed the housing markets with the lowest and the highest vacancy rates.
Strong housing markets can maintain a low vacancy rate even during busts, explains Jed Kolko, chief economist at Trulia. Overall, the nation’s supply of unoccupied homes — defined as homes where no one receives mail — decreased by 5% this year compared to last, according to Trulia. The San Francisco-based company reports that this year’s national vacancy rate is 3.4%.
A lack of space to build new homes contributes to scarcity in densely populated areas, which in turn helps to bolster home prices. San Jose, Calif., Bethesda, Md., and Middlesex County in New Jersey are examples of housing markets that maintain low vacancy rates “mostly because they can’t build new houses,” Kolko says. “They’re expensive and difficult to build in.”
At the other extreme, areas with the highest level of housing vacancies — i.e., oversupply — grapple with serious maladies such as high unemployment, population decreases, high numbers of foreclosures and, perhaps worst of all, overbuilding, Kolko adds.
Detroit is arguably America’s most famous example of oversupply due to abandoned properties. Detroit may have 33,000 vacant homes, give or take a few thousand that have already been demolished. Michigan Gov. Rick Snyder forwarded a plan to demolish abandoned homes in Detroit. The plan would augment similar initiatives by Mayor Dave Bing, which have already led to the demolition of 4,200 homes in the past three years, according to the Detroit Free Press.
Among areas with high vacancy rates are metropolitan areas such as Tucson, Ariz., South Florida and Las Vegas, Nev. that experienced significant overbuilding during the housing bubble, up until it burst in 2008. It takes years to work through an abundant supply of homes, particularly when high unemployment keeps some potential homeowners out of the market.
Not surprisingly, these areas with an oversupply of homes also tended to experience steep drops in home prices in the past four years. Home values in West Palm Beach, Fla., for example, plunged a whopping 48.4% during this period. But even that steep decline feels like a speed bump compared to the 60.4% cliff that has engulfed Las Vegas.
Las Vegas, of course, found a place on a list supplied by Trulia of American housing markets with the 10 highest vacancy rates as of October, 2012. The vacancy rate data are based on unoccupied residences data from the United States Postal Service. Trulia also provided median asking price per square foot, change in asking price for the past 12 months and the peak-to-trough price change. 24/7 Wall St. also identified unemployment rates for September, 2012 for these metropolitan areas.
These are 10 U.S. housing markets with the highest vacancy rates
10) Las Vegas, Nev.
> Vacancy rate: 5.8%
> Median price per square foot: $73
> Unemployment: 11.5%
It is not surprising that Las Vegas, the poster child of the housing downturn, adds high vacancy rates to its litany of problems with overbuilding and high foreclosure rates. Between peak and trough, Las Vegas housing prices plummeted by 60.4%. This decline in home values in Las Vegas and other housing markets in the state have contributed to Nevada being the only state in the country where the total worth of homes is less than the total amount owed on these homes.
9) Palm Bay-Melbourne-Titusville, Fla.
> Vacancy rate: 6.1%
> Median price per square foot: $83
> Unemployment: 9.1%
The vacancy rate in Palm Bay-Melbourne-Titusville in October climbed 8.3% from last year, the highest of all increases on this list. Homes in Palm Bay specifically are going very cheaply these days — the median sale price between Aug. and Oct. 2012 dropped by 2.6% from the previous year to only $76,000. In Palm Bay Colony, which Trulia notes is among the most popular (i.e., most searched) neighborhood in that city, the current average listing price is just $58,704.
Also Read: The Only Housing Markets to Drop This Year
8) Cleveland, Ohio
> Vacancy rate: 6.2%
> Median price per square foot: $78
> Unemployment: 6.5%
Unlike metropolitan areas in Florida and Nevada, the housing market crash was not nearly as bad in Ohio. In Cleveland, the price drop from peak to trough was 17.6%, a far more modest decline compared to cities such as Las Vegas. Despite faring better than many markets, Cleveland is not yet showing many signs of turning a corner. On top of high vacancy rates, the average price per square foot is unchanged on a year-over-year basis, and the number of sales have dropped by nearly 20% in the same period. Further, while 1,754 resale and new homes are for sale in Cleveland, as per Trulia’s site, another 5,451 homes are in some phase of the foreclosure process.
7) Toledo, Ohio
> Vacancy rate: 6.5% (tied for 4th highest)
> Median price per square foot: $69
> Unemployment: 7.2%
There are some encouraging signs in the Toledo housing market despite its high vacancy rate. The median price per square foot is up about 60% on a year-over-year basis, according to Trulia. Another measure, however, points to an inventory problem: for each new or resale home listed on Trulia, there are two homes in the foreclosure pipeline that are either vacant or will enter the market at some point. The peak-to-trough price decline of 18.2% remains a challenge in a market that saw just a 4.6% price increase on a year-over-year basis.
6) Dayton, Ohio
> Vacancy rate: 6.6% (tied for 4th highest)
> Median price per square foot: $72
> Unemployment: 6.9%
If Dayton is starting to blossom into a rosier housing market, it is not yet evident in the area’s housing statistics. In addition to high vacancy rates, the data show a decrease in housing prices per square foot on a year-over-year basis along with a drop in the median sales price. Sales volume in the city climbed just 2.6% in the same period. The 11.8% peak-to-trough drop in the area was not the worst in Ohio, but that is not much to cheer about. Still, for homebuyers, a median sale price of $73,658 must have a certain appeal.
5) Gary, Ind.
> Vacancy rate: 6.6% (tied for 4th highest)
> Median price per square foot: $85
> Unemployment: 8.8% (Michigan City-LaPorte Ind.)
Of all metropolitan areas on this list, Gary’s was hit the least by the housing downturn. Home prices fell just 10.2% between the market’s peak and its trough. Although prices did not drop massively during the downturn, the asking price in Gary fell 3.5% from the previous year, worse than all but two metro areas. The average listing price in Gary is just $59,939.
4) Fort Lauderdale, Fla.
> Vacancy rate: 6.6% (tied for 4th highest)
> Median price per square foot: $115
> Unemployment: 8.4%
While about seven in 10 markets Trulia analyzed showed increases in vacancy rates, the vacancy rate in Fort Lauderdale actually decreased by almost 1%, indicating a strengthening housing market. And although the 4.4% increase in asking price is far from the strongest growth of all the metro areas measured, it is among the top third. One concern is that the average price per square foot has dropped 59.3% on a year-over-year basis.
Also Read: America’s Most Expensive Neighborhoods
3) West Palm Beach, Fla.
> Vacancy rate: 6.7%
> Median price per square foot: $109
> Unemployment: 8.4% (Miami-Fort Lauderdale)
Like most markets in Florida, the West Palm Beach market took a major hit during the housing downturn, falling 48.4% during the recession. Fortunately, recovery is taking hold. The average asking price in the area is up 11.3%, compared to the year-earlier period, the fifth-largest increase of all metro areas measured. Also, the average price per square foot is up an impressive 63.7% compared to a year ago.
2) Tucson, Ariz.
> Vacancy rate: 6.9%
> Median price per square foot: $92
> Unemployment: 7.0%
Similar to markets in Nevada and Florida, the Tucson, Ariz., area was hit very hard by the housing downturn. Housing prices fell 37.3% between its peak and trough. While asking prices grew 8.1% year-over-year, the growth in listing price is not nearly as strong as in neighboring Phoenix, which grew by almost 25% in the same period. Still, the average price per square foot in Tucson is up a healthy 56.6% on a year over year basis, suggesting that the market is bouncing back.
1) Detroit, Mich.
> Vacancy rate: 12.3%
> Median price per square foot: $47
> Unemployment: 10.0%
Detroit’s housing market has taken a larger hit than most in recent years due to problems in the automobile industry. Between its highest and lowest point, homes prices dropped 39%. The median price per square foot of just $47 is the lowest out of all 100 metropolitan areas measured. For every one new or resale home listing on Trulia, nearly another three are in some phase of the foreclosure process. A troubling thought for anyone contemplating selling a home in this oversaturated market is that despite low home prices (the average listing is under $48,000), the number of sales has actually decreased by more than 27% on a year-over-year basis.
Rusty Weston and Samuel Weigley
Also Read: The Best Cities to Flip a House
Take This Retirement Quiz To Get Matched With A Financial Advisor (Sponsored)
Take the quiz below to get matched with a financial advisor today.
Each advisor has been vetted by SmartAsset and is held to a fiduciary standard to act in your best interests.
Here’s how it works:
1. Answer SmartAsset advisor match quiz
2. Review your pre-screened matches at your leisure. Check out the
advisors’ profiles.
3. Speak with advisors at no cost to you. Have an introductory call on the phone or introduction in person and choose whom to work with in the future
Take the retirement quiz right here.
Thank you for reading! Have some feedback for us?
Contact the 24/7 Wall St. editorial team.
Editors' Picks