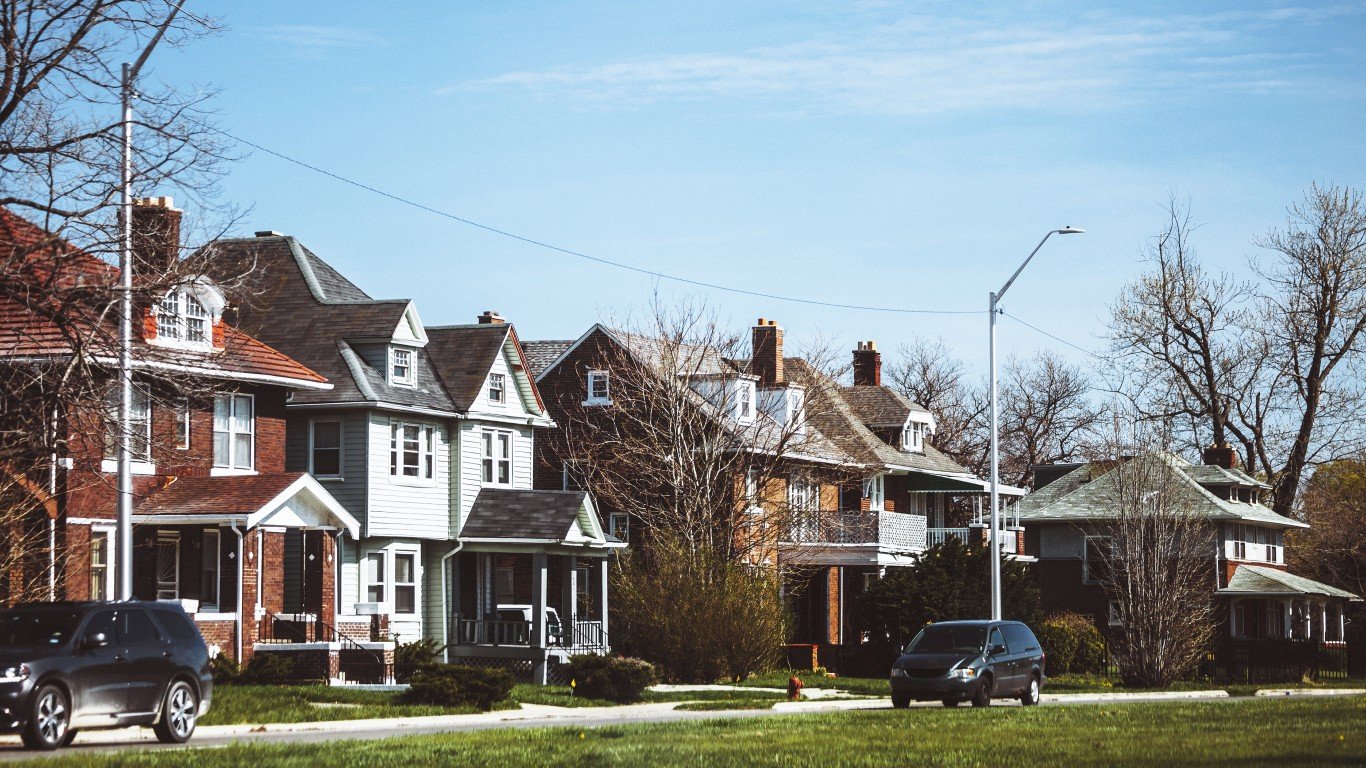

Nearly 30 million Americans moved in the past year, and most of them did so to improve their standard of living in some way. People may choose to move to a more affordable area, where they can buy a bigger home. Or they may consider safety and crime, schools or the local job market. Where we live matters.
Of course, there are nearly 30,000 cities, towns, villages and neighborhoods in the United States, and while each has something to offer, only a handful stand out as exceptional, with a wide range of qualities that have almost universal appeal.
Using over two dozen metrics related to affordability, economy, standard of living and community, 24/7 Wall St. identified the 50 best cities to live in the United States. From those, 24/7 Wall St. picked the top city overall. In order to ensure geographic diversity, we only considered the highest-ranking city in each county. Data came from a number of sources, including the U.S. Census Bureau, the Federal Bureau of Investigation and the Centers for Disease Control and Prevention.
While household income was not itself a factor in the index, many of the cities and towns on this list are relatively wealthy. This is likely not a coincidence, as income is closely tied to several other measures used to create this list, including low crime, low unemployment and better health outcomes.
Population growth can be a sign that an area is attractive to new residents and families, and, not surprisingly, most cities on our list are home to more people today than five years ago. A little over half of the cities on the list reported greater population growth than the United States as a whole between 2013 and 2018. This is the fastest-growing place in every state.
Visit here for the best 50 cities to live in America.
Out of America’s 50 best cities to live in, Palo Alto, California, topped the list. It has a population of 66,573, which has risen nearly 1% over the past five years. The median household income is $158,271. The five-year average unemployment rate is 3.2%
Palo Alto is located in the heart of Silicon Valley. The city and the surrounding area are home to a high concentration of tech companies, including giants such as Facebook and Google, as well as startups. Jobs in the area tend to by high paying, as most households in the city earn over $158,000 a year, and about 40% of households earn over $200,000. In part because the area has become a tech industry hub, unemployment is low, averaging about 3.2% over the past five years. That is well below the comparable 5.3% national figure.
24/7 Wall St. methodology:
To identify the best cities to live in, 24/7 Wall St. created a weighted index of 25 measures that fall into one of four categories: affordability, economy, quality of life and community.
In the affordability category, the ratio of the median home value to the median income (i.e., the housing affordability ratio) was given full weight. More affordable cities were ranked higher. Property taxes, which also affect housing affordability, are largely levied at the local level, and those cities where residents pay more in property taxes as a percentage of their home value were penalized. Property taxes were given a one-quarter weighting.
In the economy category, the unemployment rate was given full weight. We used five-year average unemployment due to lack of comparable annual data at local levels. Five-year employment growth was given full weight, and the share of the total working-age population with a job (labor force participation) was given a half weight, favoring areas with greater employment and growing job opportunities.
The quality of life category includes several socioeconomic and health-related measures. The poverty rate was given full weight, penalizing cities where poverty is more common. The share of the population that struggles to put food on the table due to distance from a grocery store (the food insecurity rate) was given full weight. A city’s mortality rate, calculated as the number of people who died while in hospital care per hospital by city, also was given full weight. In cases where city-level data was not available, mortality rates were imputed from county-level data.
The drug overdose mortality rate was given a one-half weighting. The hospital readmission rate, or the share of those who were released from the hospital and readmitted within 30 days, was given a one-fourth weight. Distance from the center of the city to the nearest hospital was given half weight.
The number of hospitalizations that would have been prevented by regularly scheduled doctor visits for every 1,000 Medicare enrollees (the preventable hospitalization rate) was given half weighting.
Measures used in the community category include the average travel time to work, which was given full weight. The violent crime rate, or the total number of rapes, robberies, murders and aggravated assaults per 100,000 residents per year, was given full weight. So too was the property crime rate, which is the total number of burglaries, larcenies, motor vehicle thefts and incidents of arson per 100,000 residents per year.
The share of commuters walking, cycling or taking public transit to work was given half weight. The total number of restaurants, bars, museums, theater companies, movie theaters, libraries and parks per capita were each given a one-quarter weighting.
To avoid geographic clustering, we only listed the top-ranking city in a given county. Our list includes cities, towns, villages, boroughs and Census-designated places. We did not include places with fewer than 8,000 residents in our analysis.
Median household income, median home value, average travel time to work, poverty rate, population, employment-to-population ratio, median property taxes paid and average unemployment rate are all five-year estimates from the U.S. Census Bureau’s American Community Survey for the 2015 to 2019 period.
The population-adjusted number of entertainment and cultural venues like restaurants and museums comes from the Census Bureau’s County Business Patterns data set and is for 2018.
Violent and property crime rates are from the FBI’s 2019 Uniform Crime Report. Drug overdose mortality rates are from the Centers for Disease Control and Prevention and are for the years 2016 to 2018. Mortality rates and hospital readmission rates are from the Centers for Medicare and Medicaid Services and are as of June 2019. Preventable hospitalizations are from the latest release of County Health Rankings & Roadmaps, a Robert Wood Johnson Foundation and University of Wisconsin Population Health Institute joint program.
Essential Tips for Investing: Sponsored
A financial advisor can help you understand the advantages and disadvantages of investment properties. Finding a qualified financial advisor doesn’t have to be hard. SmartAsset’s free tool matches you with up to three financial advisors who serve your area, and you can interview your advisor matches at no cost to decide which one is right for you. If you’re ready to find an advisor who can help you achieve your financial goals, get started now.
Investing in real estate can diversify your portfolio. But expanding your horizons may add additional costs. If you’re an investor looking to minimize expenses, consider checking out online brokerages. They often offer low investment fees, helping you maximize your profit.
Thank you for reading! Have some feedback for us?
Contact the 24/7 Wall St. editorial team.


