Private Equity Better Than Stocks for Your Money (APO, BX, CG, KKR)
December 20, 2012 by Jon C. Ogg
A report on Thursday from the Private Equity Growth Capital Council is showing just how private equity has outperformed the broader S&P 500 Index over the last ten years. We would make a note that based upon the name of the group and its membership that the report is almost certainly going to hold the sector of private equity in the best light that it can.
Members of this group include Apollo Global Management LLC (NYSE: APO), The Blackstone Group (NYSE: BX), The Carlyle Group (NASDAQ: CG), Kohlberg Kravis Roberts & Co. (NYSE: KKR), and many other private equity leaders. The annualized returns of 12.6% over the past 10 years outpaced portfolio target returns of 7% or 8%.
Over the past five years, the S&P 500 lost more than half of its value before doubling to get back to the starting point. This group’s report is showing that private equity investments continued to provide higher returns on an annualized basis for its pension funds, charitable foundations and endowments.
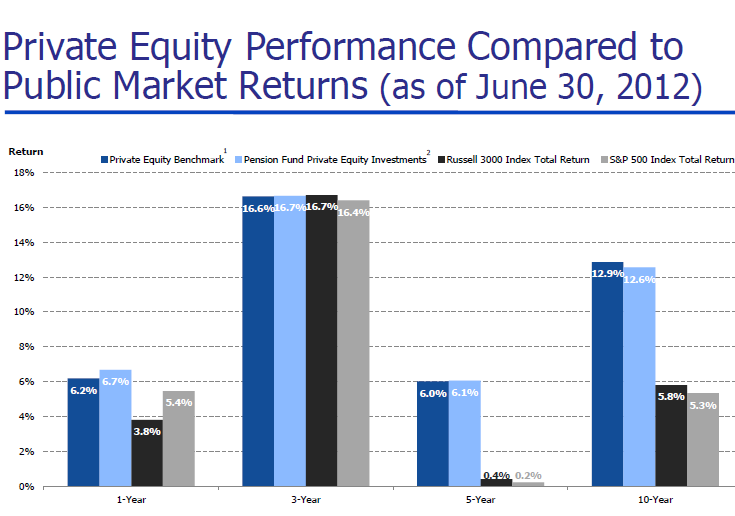
The group’s private equity returns outpaced the S&P 500 even including dividends and net of management fees for each of the featured return horizon. The gains were said to be 7.5 percentage points over a ten year horizon and by 5.8 percentage points over a five year horizon according to the quarterly PEGCC Private Equity Performance Update.
PEGCC’s analysis of recently published data from 15 pension funds that are among the 50 largest funds by assets shows median private equity returns exceeded the S&P 500 for 1-, 3-, 5-, and 10-year time horizons by 1.3, 0.3, 5.9, and 7.3 percentage points.
A chart from the group’s full presentation has been copied below to include in the report. Again, the group putting this together is in private equity showing relative returns. That full presentation is included here.
JON C. OGG
Sponsored: Find a Qualified Financial Advisor
Finding a qualified financial advisor doesn’t have to be hard. SmartAsset’s free tool matches you with up to 3 fiduciary financial advisors in your area in 5 minutes. Each advisor has been vetted by SmartAsset and is held to a fiduciary standard to act in your best interests. If you’re ready to be matched with local advisors that can help you achieve your financial goals, get started now.