Investing
10 Stocks That Have Ignored the Recent Massive Sell-Off
Published:
Last Updated:
The past month has been tough for many stock market bulls, but the past week added massive stress and losses to many stock market pros. Regardless of what you want to blame, the trading history has been ugly almost across the board. Almost, that is. Source: Jon Ogg
With the Dow and the S&P 500 both having now pulled back over 10% from their highs, the stock market went into official correction territory. This is also the first formal 10% pullback in about four years. What is amazing is that even though the stock market has tanked on fears out of China in recent days and over the past month, some stocks have almost managed to completely ignore the selling.
24/7 Wall St. wanted to review the companies that have ignored the stock market selling in the past week and month. We did not have an absolute market cap limit, but we prefer companies over $1 billion. We also did not include companies that were just recently announced takeover targets in order to avoid the noise that does not explain the big picture.
Included is a description, if needed, a reasonable explanation of why each company has avoided the carnage, and what the prospects are ahead. Also included are basic share price data, how much these have moved over the past month, and basic trading and valuation data.
Best Buy Co. Inc. (NYSE: BBY) has a chart that is honestly more dependent on recent post-earnings gains rather than a steady rise over the past month. This may skew the formal strength, but the new chart would now indicate that support should be in place shortly under the current prices. Ahead of Wednesday, Best Buy shares were up 1.6% over the past week and up about 3% in the past month, thanks to a 12% gain after earnings.
Best Buy shares were last seen up 2.2% at $33.66, with a $12 billion market cap. The stock has a consensus analyst price target of $41.00 and a 52-week trading range of $28.32 to $42.00.
ALSO READ: Oppenheimer’s 7 Bull Market Leaders to Buy After the Sell-Off
Caesars Entertainment Corp. (NASDAQ: CZR) had been a big dog with fleas up until summer. It seems that the sell-off in this stock, which was way ahead of the stock market sell-off, may have become too extreme. Ahead of Wednesday, Caesars was up 15% over the past week and was up a whopping 72% over the past month. Still, it is not even quite half way back to its 52-week high. Caesars recently recovered handily due to a restructuring agreement its lenders.
Shares of Caesars were up 0.4% at $8.50, and the market cap is$1.2 billion. The stock has a consensus price target of $9.75 and a 52-week trading range of $3.30 to $17.39.
Calavo Growers Inc. (NASDAQ: CVGW) is one company many investors do not know, and it trades just over 100,000 shares per day. The company distributes avocados, fruit and many other prepackaged perishable foods, and the California-based company dates back to the 1920s. Its stock even hit a new high this week, up 2.4% over the past week and up over 4% in the past month, ahead of Wednesday’s gains.
Shares of Calavo Growers were up 4.5% at $58.09. The consensus analyst price target is $60.67, and the 52-week trading range is $37.50 to $58.12. The company has a market cap of $1 billion.
Neos Therapeutics Inc. (NASDAQ: NEOS) is a small-cap stock and a recent IPO, and it is focused on treating ADHD. Still, one has to wonder, because it hit a post-IPO high on Wednesday. It recently was given big upside by its analysts. Because it only recently became a public company, no color is being added. Ahead of Wednesday, its stock was up over 6.5% in the past week and up almost 20% in the past month.
Shares were last seen up 3.5% at $24.70 on Wednesday, in a post-IPO trading range of $17.10 to $25.17. The company has a total market cap of $358 million. This was a mere 4.8 million share IPO at $15.00 per share.
ALSO READ: Where Will Warren Buffett Put Money as Markets Collapse?
Oshkosh Corp. (NYSE: OSK) may be trading higher as a result of it winning a $6.7 billion contract to replace the Army’s Hummers, but this stock was hanging in there ahead of the news. Before the news broke, it was down only about 2% over the past week and was still up over 4% in the past month. Oshkosh was still down about 20% so far this year ahead of the news pop.
Oshkosh shares were last seen up 5.4% at $40.61, thanks to that big contact announcement, and it has a market cap of $3.2 billion. The consensus price target is $43.19, and the 52-week range is $32.56 to $55.69.
Southwest Gas Corp. (NYSE: SWX) received an upgrade from Argus in late July, but it had less than awesome earnings in early August that had limited some gains. Since that time, shares have tried to hang on. Ahead of Wednesday, it was down 1.5% in the past week but up about 1% over the past month.
Shares of Southwest Gas were down 0.8% at $55.25, in its 52-week range of $48.23 to $64.20. The consensus price target is $60.50 and the market cap is $2.6 billion.
Tech Data Corp. (NASDAQ: TECD) seems interesting to have avoided the carnage, and much of that is after a big post-earnings pop a week earlier. The electronics distribution giant, ahead of Wednesday, was up almost 6% in the past week and up almost 8% in the past month, even though it was still down almost 6% so far in 2015.
Tech Data shares were up 1.9% at $61.09. The 52-week range is $52.22 to $70.09. The market cap is $2.2 billion and the consensus price target is $64.60.
ALSO READ: 4 Jefferies Top Value Stock to Buy as Market Recovers
United Natural Foods Inc. (NASDAQ: UNFI) may feel unloved because the natural foods distribution king had seen its shares gutted earlier this year. Earnings and the loss of a key client did not help matters at all. The stock was down almost 40% year to date. Ahead of Wednesday, it was up almost 2% in the past week and up almost 3% over the past month. Does this mean that the stock finally is trying to find a bottom, or is it just a resting place before going lower again?
Shares of United Natural Foods were relatively flat at $47.56, below its consensus price target of $58.53. The 52-week range is $44.05 to $83.91 and the market cap is $2.4 billion.
Virtu Financial Inc. (NASDAQ: VIRT) looks like a trading or brokerage firm on the surface, so some may wonder why it has risen. It is because this is a top high-frequency trading shop, and the market volatility probably has been like shooting fish in a barrel. It had a recent IPO and is worth under $1 billion. Still, it almost never loses money, according to its pre-IPO paperwork. Virtu’s IPO was at $19.00, and shares were actually down 7% in the past month but had recovered to be up 5.5% in the past five days.
Virtu Financial shares were last seen up 2% at $22.48, compared to its consensus price target of $23.50. The market cap is $771 million, and the post-IPO trading range is $19.98 to $24.77.
Windstream Holdings Inc. (NASDAQ: WIN) has been a controversial stock in telecom, Internet access and even in cloud and networking, but it turns out that earnings were very positive and may have broken what had been one massive down-slide in the stock this year. Windstream was up 2.6% over the past week, but it was up 42% in the past month, while still being down 45% this year.
Shares of Windstream were up 0.9% at $6.74 earlier in the day but then drifted into the red slightly. It has a consensus price target of $7.53. The market cap is $701 million. The stock has traded between $4.42 and $17.81 in the past 52 weeks.
ALSO READ: Merrill Lynch Says Move From Momentum to Yield and Growth Stocks
Any time you see statistics this bad, it makes you scratch your head a bit. Out of the S&P 500 Index, only two non-merger companies were up in the past week. Every single Dow stock was down last week, with a minimum drop being 6.5%. Over the past month, every Dow stock was in the red as well.
Some of these stocks had endured pain prior to this summer. It was impressive to see that perhaps investors are thinking the worst has been seen for some of these companies. If they did not get body slammed in the past week or the past month, you almost would have to wonder how well these would have done had the market not been in such a deep correction.
Below are charts from StockCharts.com on each in the past 60 days, compared to the Dow ETF and NASDAQ 100 ETF.
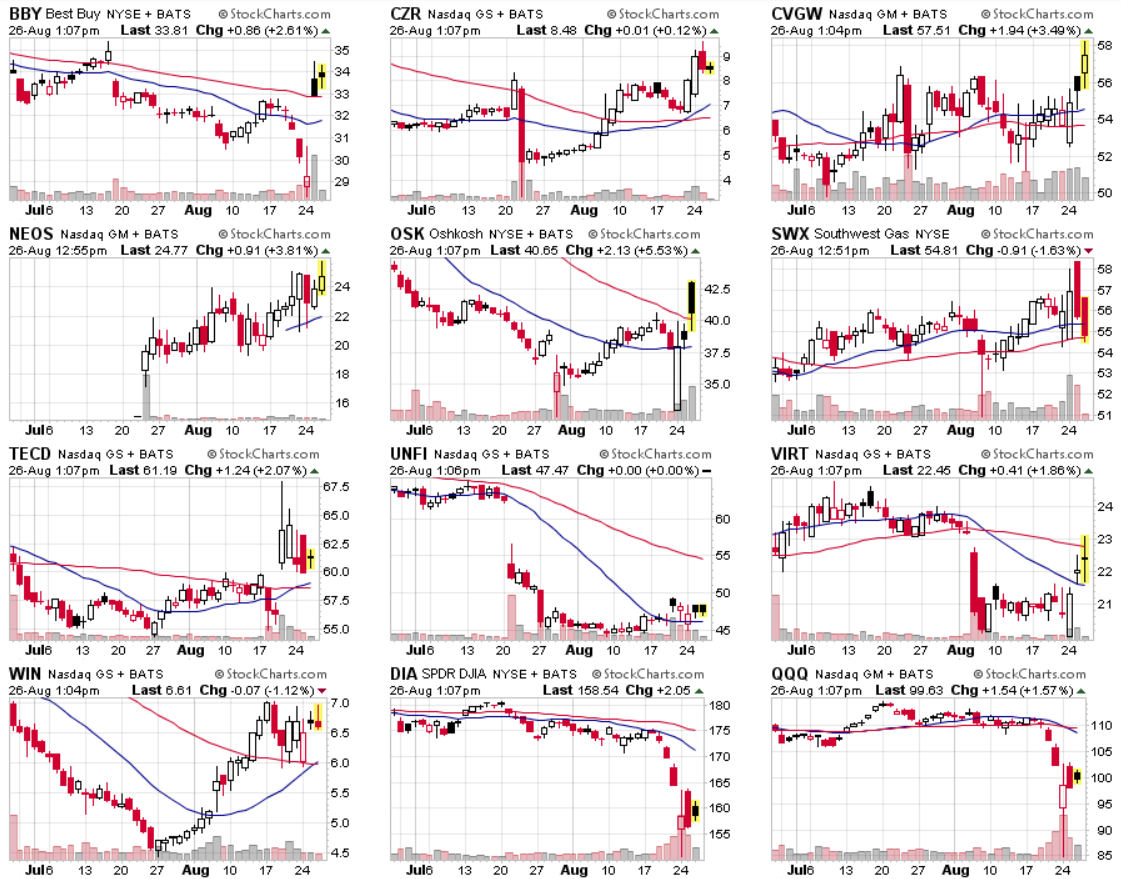 Source: Stockcharts.com
ALSO READ: RBC Has 3 Quality Tech Stocks to Buy Following Market Sell-Off
Finding a qualified financial advisor doesn’t have to be hard. SmartAsset’s free tool matches you with up to 3 fiduciary financial advisors in your area in 5 minutes. Each advisor has been vetted by SmartAsset and is held to a fiduciary standard to act in your best interests. If you’re ready to be matched with local advisors that can help you achieve your financial goals, get started now.
Thank you for reading! Have some feedback for us?
Contact the 24/7 Wall St. editorial team.


