
In 2018, hedge funds actually outperformed publicly traded stocks. According to Hedge Fund Research’s HFRI Asset Weighted Composite Index, hedge fund returns fell 0.7% last year while the S&P 500 dropped 4.4%.
That was the first time in six years that hedge funds outperformed the stock market. Over the preceding five years, the HFRI index showed a return of 6.7% compared to a return of 21.8% in the S&P 500. That’s not altogether a bad thing, according to some experts. After all, hedge funds are not supposed to post returns like those in a market rally. They are supposed to be hedges that help reduce exposure to risk.
That said, how do hedge funds actually hedge? Primarily through the use of exchange-traded funds (ETF), although there are some hedge funds that use their own long-short strategies. The goal of any long-short strategy is to reduce exposure to the equity market and make a profit from the price spread between the long and short positions. A selection of ETFs in a hedge fund portfolio makes this strategy easier to achieve. Holding ETFs also has the benefit of preventing some of the world’s biggest hedge funds from owning too much equity in a single company.
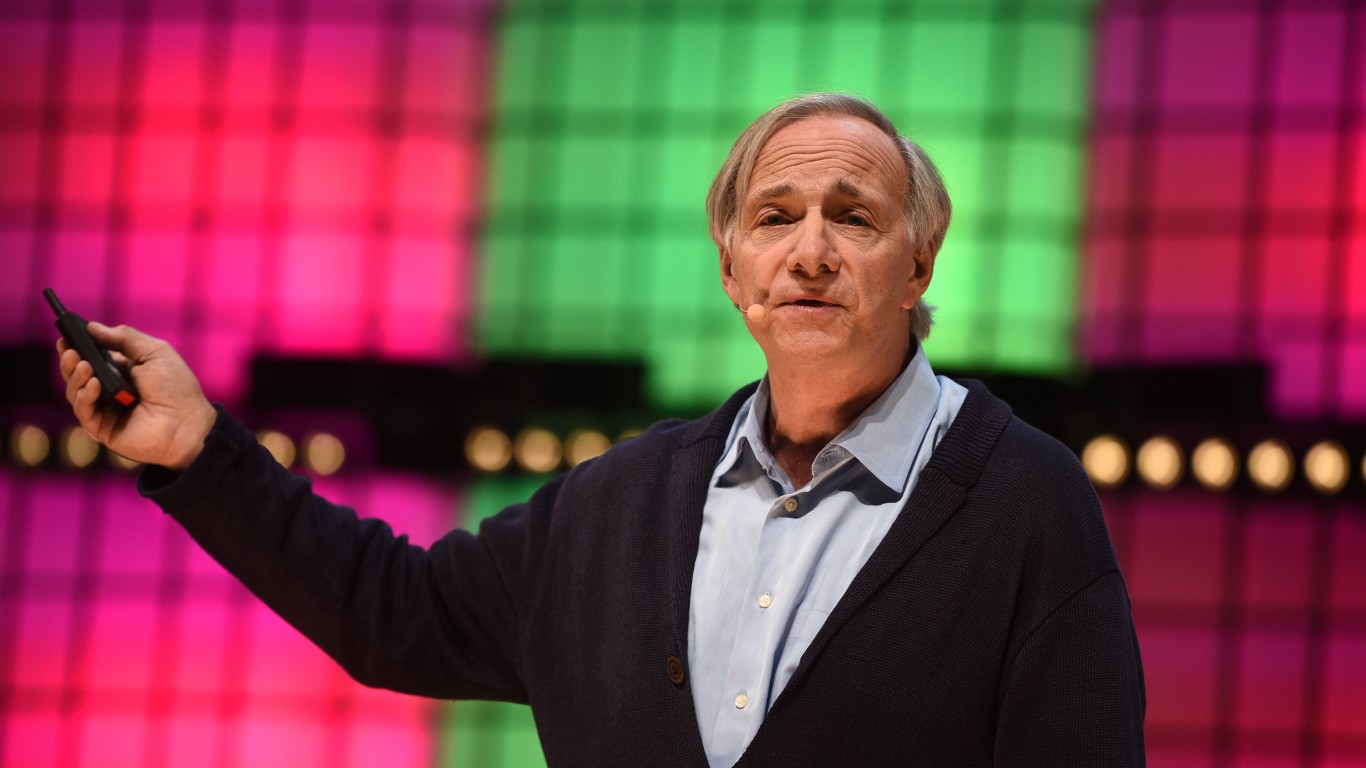
We looked at the latest Form 13F filing of world’s largest hedge fund, Ray Dalio’s Bridgewater Capital and noted 19 ETFs among the firm’s 303 holdings. Last year, Bridgewater returned 14.6% net of fees on its flagship Pure Alpha strategy. Here are five of the giant hedge fund’s largest ETF holdings.
The iShares MSCI Emerging Markets ETF (NASDAQ: EEM) tracks the results of the MSCI Emerging Markets Index and holds at least 90% of its assets in the stocks and depositary receipts of firms in the index. The fund’s assets under management (AUM) totaled $32.18 billion, and its top five holdings are Hong Kong-traded Tencent Holdings (5.30%), Alibaba (4.50%), Taiwan-traded Taiwan Semiconductor (3.83%), South Korea-traded Samsung (3.34%) and Japan-traded Naspers (2.00%).
The net asset value of the fund was $41.31 per share at the May 15 close, with 779.4 million shares outstanding. The 52-week range is $37.02 to $46.27. The fund was created in April 2003 and has an expense ratio of 0.67%. Since its inception, the fund had returned 10.64% as of March 31 and 7.79% over the past 10 years. For the year to March 31, the fund has returned 9.7%.
The Vanguard FTSE Emerging Markets ETF (NYSEARCA: VWO) tracks the FTSE Emerging Markets All Cap China A Inclusion Index. The fund’s AUM total is $62.12 billion, and its top holdings are Tencent (5.11%), Alibaba (4.04%), Taiwan Semiconductor (3.78%), Naspers (1.87%) and Hong Kong-traded China Construction Bank (1.33%).
The fund’s net asset value is $41.05, with 1.51 billion shares outstanding. The 52-week range is $36.03 to $44.86, and the fund’s expense ratio is 0.12%. It was created in March 2005, and since its inception it has returned 6.45%, and 7.16% in the past 10 years. For the year to date, the fund has returned 7.52%.
The Vanguard FTSE Developed Markets ETF (NYSEARCA: VEA) tracks the performance of the FTSE Developed All Cap (excluding the United States) market-cap weighted index. The fund’s AUM totaled $70.35 billion. Top five holdings are Nestle (1.61%), Roche Holding (0.99%), HSBC (0.96%), Novartis (0.95%) and Samsung (0.94%).
The fund’s net asset value is $40.62, with 1.73 billion shares outstanding. The 52-week range is $35.59 to $44.29, and the fund’s expense ratio is 0.05%. The fund was created in July 2007, and since its inception it had returned 1.55%, as of April 30, and 8.19% in the past 10 years. For the year to date, the fund has returned 10.01%.
The SPDR S&P 500 ETF (NYSEARCA: SPY) tracks the performance of the S&P 500 Index. This is the world’s largest ETF, with an AUM of more than $260 billion. The fund’s largest holdings are Microsoft (4.06%), Apple (3.59%), Amazon (3.24%), Facebook (1.87%) and Berkshire Hathaway (1.66%).
The fund’s net asset value is $284.99, with 914.18 million shares outstanding. The 52-week range is $232.74 to $294.95 and the fund’s expense ratio is 0.09%. The fund was created in January 1993, and since its inception it had returned 9.43%, as of March 31, and 15.76% in the past 10 years. For the year to date, the fund has returned 13.6%.
The SPDR Gold Trust (NYSEARCA: GLD) tracks the price of gold bullion. The fund’s AUM totals $30.62 billion, and 100% of assets are held in physical gold. Gold closed at $1,299.10 in London on Wednesday, May 15.
The fund’s net asset value is $122.63, with 249.7 million shares outstanding. The 52-week range is $111.06 to $127.21, and the fund’s expense ratio is 0.40%. It was created in November 2004, and since its inception, it had returned 7.34%, as of March 31, and 3.11% in the past 10 years. For the year to date, the fund has returned 0.98%.
Essential Tips for Investing: Sponsored
A financial advisor can help you understand the advantages and disadvantages of investment properties. Finding a qualified financial advisor doesn’t have to be hard. SmartAsset’s free tool matches you with up to three financial advisors who serve your area, and you can interview your advisor matches at no cost to decide which one is right for you. If you’re ready to find an advisor who can help you achieve your financial goals, get started now.
Investing in real estate can diversify your portfolio. But expanding your horizons may add additional costs. If you’re an investor looking to minimize expenses, consider checking out online brokerages. They often offer low investment fees, helping you maximize your profit.
Thank you for reading! Have some feedback for us?
Contact the 24/7 Wall St. editorial team.


