Investing
Record Assets and Net Inflows for Smart Beta ETFs and ETPs Listed Globally of US$1.24 Trillion and US$102.03 Billion Respectively at the End H1 2021

Published:
By ETFGI
ETFGI, an independent research and consultancy firm covering trends in the global ETFs/ETPs ecosystem, reports record assets and net inflows for Smart Beta ETFs and ETPs listed globally of US$1.24 trillion and US$102.03 billion respectively at the end H1 2021. Smart Beta ETFs and ETPs providing equity exposure listed globally gathered net inflows of US$14.27 billion during June, bringing year-to-date net inflows to a record US$102.03 billion which is higher than the US$12.36 billion gathered at this point last year. Year-to-date through the end of June 2021, Smart Beta Equity ETF/ETP assets have increased by 23.8% from US$999 billion to US$1.24 trillion, with a 5-year CAGR of 22.8%, according to ETFGI’s June 2021 ETF and ETP Smart Beta industry landscape insights report, a monthly report which is part of an annual paid-for research subscription service. (All dollar values in USD unless otherwise noted.)
“The S&P 500 gained 2.33% in June and are up 15.25% in the first half of 2021. Developed markets ex-U.S. lost 0.82% in June but are up 9.96% in the first half. Emerging markets are up 0.47% in June and are up 9.03% in the first half, “according to Deborah Fuhr, managing partner, founder and owner of ETFGI.
At the end of June 2021, there were 1,325 smart beta equity ETFs/ETPs, with 2,634 listings, assets of $1.24 Tn, from 194 providers listed on 45 exchanges in 37 countries.
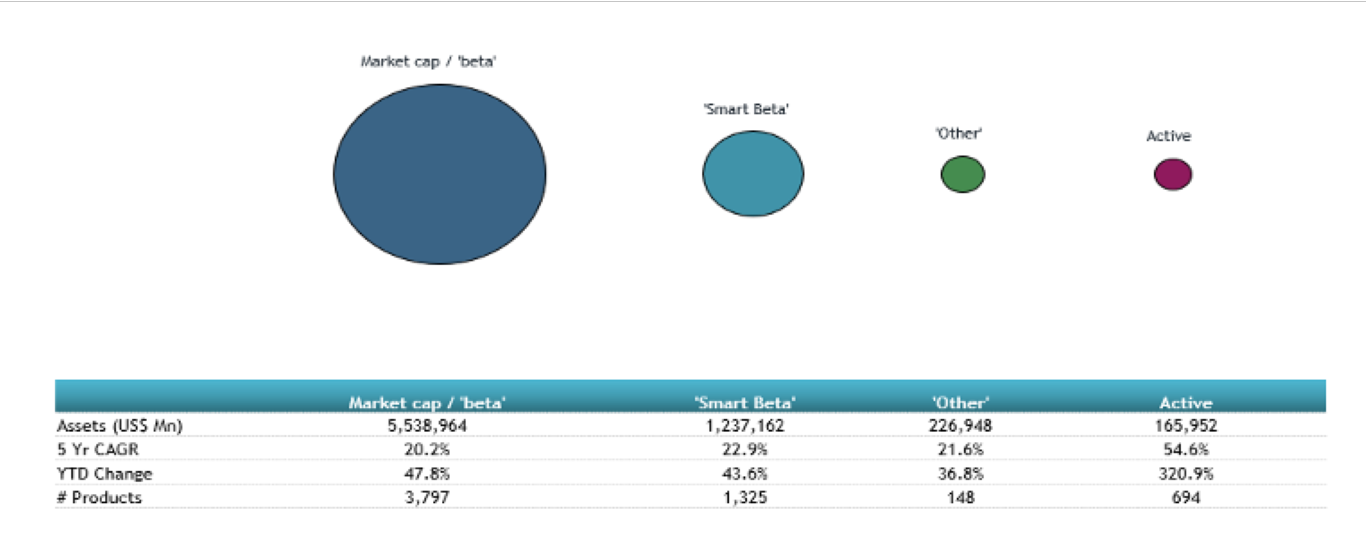
Comparison of Assets in Market Cap, Smart Beta, Other and Active Equity Products
Source: ETFGI data sourced from ETF/ETP sponsors, exchanges, regulatory filings, Thomson Reuters/Lipper, Bloomberg, publicly available sources and data generated in-house. Note: This report is based on the most recent data available at the time of publication. Asset and flow data may change slightly as additional data becomes available.
Following net inflows of $14.27 Bn and market moves during the month, assets invested in Smart Beta ETFs/ETPs listed globally increased by 1.64%, from $1.22 Tn at the end of May 2021 to $1.24 Tn. Fundamental ETFs and ETPs attracted the greatest monthly net inflows, gathering $10.16 Bn during June. Volatility ETFs and ETPs suffered the largest net outflows during the month at $433 Mn.
Substantial inflows can be attributed to the top 20 Smart Beta ETFs/ETPs by net new assets, which collectively gathered $11.60 Bn during June. Vanguard Value ETF (VTV US) gathered $1.25 Bn the largest net inflow.
Top 20 Smart Beta ETFs/ETPs by Net New Assets June 2021
| Name | Ticker | Assets (US$ Mn) June-21 | NNA (US$ Mn) YTD-21 | NNA (US$ Mn) June-21 |
|---|---|---|---|---|
| Vanguard Value ETF | VTV US | 81,704.88 | 10,234.10 | 1,245.16 |
| SPDR Portfolio S&P 500 Growth ETF | SPYG US | 12,378.48 | 1,405.25 | 1,221.76 |
| Schwab US Dividend Equity ETF | SCHD US | 26,038.71 | 6,554.07 | 1,117.53 |
| iShares Edge MSCI World Value Factor UCITS ETF – Acc | IWVL LN | 6,789.58 | 3,008.73 | 888.92 |
| iShares S&P Small-Cap 600 Value ETF | IJS US | 10,103.53 | 1,759.36 | 797.02 |
| Vanguard Growth ETF | VUG US | 78,864.17 | 1,600.61 | 622.91 |
| iShares Trust iShares ESG Aware MSCI USA ETF | ESGU US | 18,417.78 | 2,900.00 | 616.44 |
| iShares Edge MSCI USA Momentum Factor ETF | MTUM US | 15,305.22 | 1,121.41 | 521.02 |
| iShares MSCI EAFE Value ETF | EFV US | 14,368.53 | 6,327.90 | 493.18 |
| iShares Edge MSCI USA Quality Factor ETF | QUAL US | 21,575.91 | 2,744.46 | 467.48 |
| Invesco DWA Momentum ETF | PDP US | 2,170.35 | 105.48 | 407 |
| iShares Edge MSCI International Value Factor ETF | IVLU US | 1,336.07 | 706.78 | 404.47 |
| iShares Core Dividend Growth ETF | DGRO US | 19,207.03 | 2,531.45 | 387.81 |
| iShares ESG MSCI EM ETF | ESGE US | 7,991.97 | 1,384.70 | 373.97 |
| iShares Edge MSCI Europe Value Factor UCITS ETF | IEFV LN | 3,938.81 | 1,723.02 | 368.04 |
| First Trust Rising Dividend Achievers ETF | RDVY US | 4,781.71 | 2,416.12 | 363.72 |
| Goldman Sachs ActiveBeta U.S. Large Cap Equity ETF | GSLC US | 13,104.74 | 75.15 | 352.68 |
| BMO Equal Weight Banks Index ETF | ZEB CN | 1,651.23 | 245.17 | 331.06 |
| Vanguard Small-Cap Value ETF | VBR US | 24,590.70 | 2,585.94 | 313.67 |
| SPDR Portfolio S&P 500 High Dividend ETF | SPYD US | 4,666.57 | 1,789.30 | 304.44 |
Source: ETFGI data sourced from ETF/ETP sponsors, exchanges, regulatory filings, Thomson Reuters/Lipper, Bloomberg, publicly available sources and data generated in-house. Note: This report is based on the most recent data available at the time of publication. Asset and flow data may change slightly as additional data becomes available.
Contact [email protected] if you have any questions or comments on the press release or ETFGI events, research or consulting services.
Want retirement to come a few years earlier than you’d planned? Or are you ready to retire now, but want an extra set of eyes on your finances?
Now you can speak with up to 3 financial experts in your area for FREE. By simply clicking here you can begin to match with financial professionals who can help you build your plan to retire early. And the best part? The first conversation with them is free.
Click here to match with up to 3 financial pros who would be excited to help you make financial decisions.
Thank you for reading! Have some feedback for us?
Contact the 24/7 Wall St. editorial team.