
Source: Thinkstock
More than 43 million Americans still live in poverty. And while financial hardship exists in every city, some areas have much higher poverty rates than others.
24/7 Wall St. reviewed data from the U.S. Census Bureau to determine the cities with the highest poverty rates. The 56-city list consists of every U.S. metro area where more than one in five residents lives in poverty. The metro area with the highest poverty rate is Brownsville-Harlingen, Texas, with 32.4% of residents living below the poverty line.
Click here to see the cities with the highest poverty rates.
The income threshold that determines the poverty line for a family is determined by family size and composition. For example, the threshold for a family of four consisting of two adults and two children is $24,036 a year — if the household’s total income is below that threshold, it is considered to be living in poverty. For an individual younger than 65 years of age living alone, the poverty threshold drops to $12,331.
Due to many factors, including the pay gap between men and women, single mother households tend to have higher rates of poverty than other types of households. Nationwide, single mother families make up 6.8% of all families. In the most impoverished cities, single mother families are more common. In nine of the 10 cities with the highest poverty rates, the share of single mother households exceeds the national rate.
The poverty threshold does not account for factors like cost of living and is based on income levels before subsidies are received from government assistance programs like SNAP. Because it is cheaper to live in 54 of the 56 cities on this list than it is on average across the nation, the low incomes may be slightly more manageable. Programs like SNAP can provide further assistance by securing basic needs for low income individuals and families.
Yet, in many of these areas, there are a larger share of residents not only living in poverty, but living in extreme poverty. Nationwide, 4.3% of families earn less than $10,000 per year. In all but five of the 56 metros this percentage is higher, and in four cities, one in 10 families earns less than $10,000 annually.
To determine the cities with the highest poverty rates, 24/7 Wall St. reviewed data from the U.S. Census Bureau. The national poverty rate is from the Current Population Survey, and data for metropolitan statistical areas is from the American Community Survey. Household and family composition figures are also from the ACS. Single mother family refers to a single, female householder raising her own children. All data from the Census Bureau is from 2015. Unemployment rates are from July 2016 and are from the Bureau of Labor Statistics. Regional price parities (cost of living) in each metro area came from the Bureau of Economic Analysis and are as of 2014. All data is as of the most recently available period.
These are the cities with the highest poverty rates.

Source: Thinkstock
56. El Paso, TX
> Poverty rate: 20.1%
> July 2016 unemployment rate: 4.9%
> Households receiving SNAP benefits: 22.0%
> Households with income under $10,000: 5.4%
Source: Thinkstock
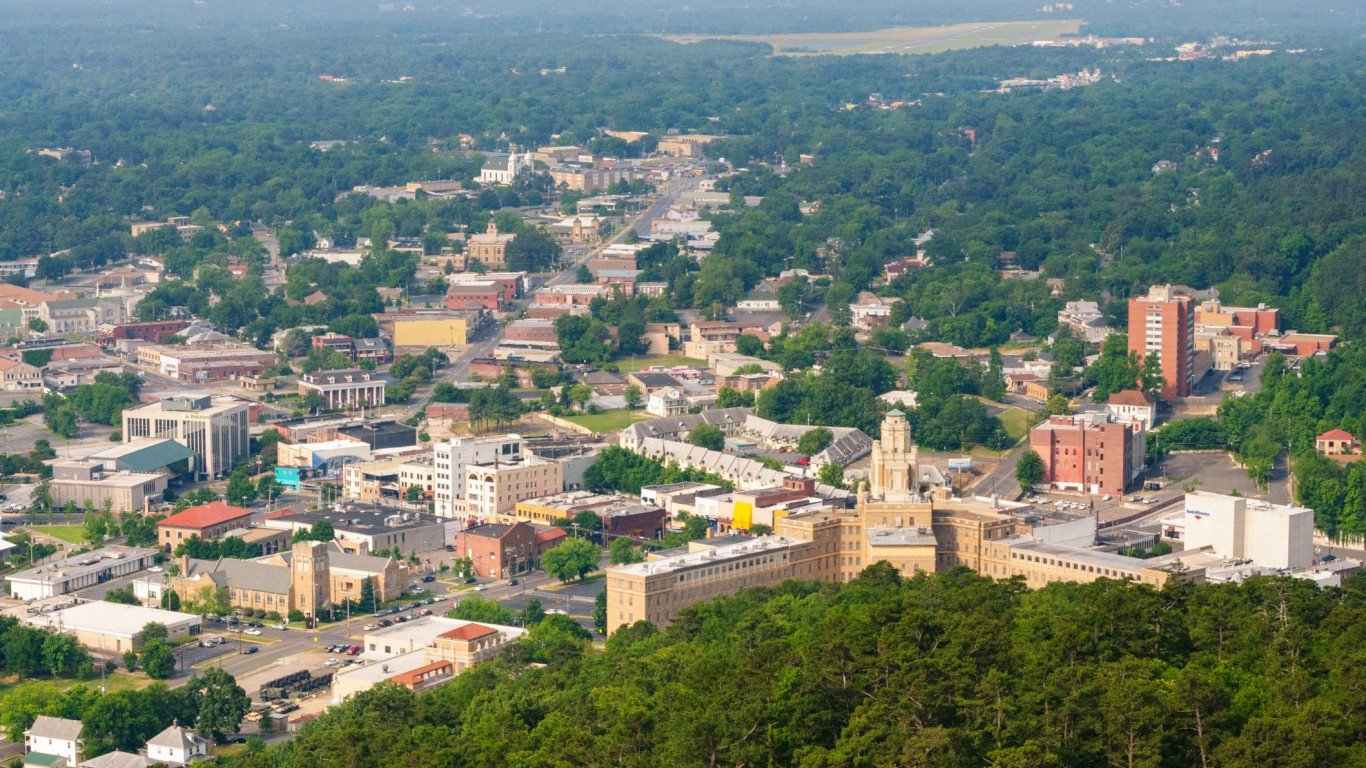
55. Hot Springs, AR
> Poverty rate: 20.1%
> July 2016 unemployment rate: 4.2%
> Households receiving SNAP benefits: 10.4%
> Households with income under $10,000: 4.9%

Source: Wikimedia Commons
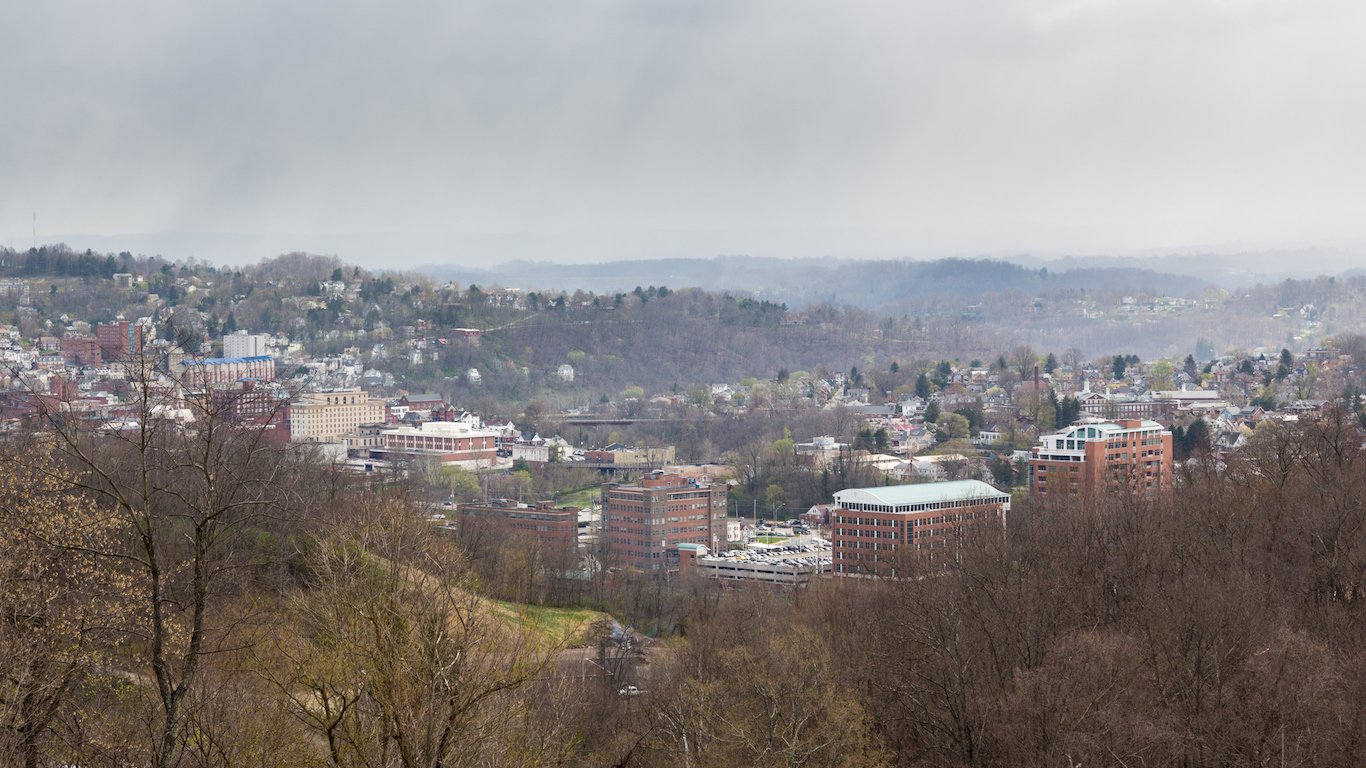
54. Huntington-Ashland, WV-KY-OH
> Poverty rate: 20.1%
> July 2016 unemployment rate: 5.8%
> Households receiving SNAP benefits: 18.0%
> Households with income under $10,000: 6.9%

Source: Thinkstock
53. Corvallis, OR
> Poverty rate: 20.1%
> July 2016 unemployment rate: 4.6%
> Households receiving SNAP benefits: 11.5%
> Households with income under $10,000: 3.7%

Source: Wikimedia Commons
52. Pueblo, CO
> Poverty rate: 20.1%
> July 2016 unemployment rate: 5.4%
> Households receiving SNAP benefits: 20.3%
> Households with income under $10,000: 7.6%

Source: Wikimedia Commons
51. Burlington, NC
> Poverty rate: 20.1%
> July 2016 unemployment rate: 4.3%
> Households receiving SNAP benefits: 17.0%
> Households with income under $10,000: 6.5%

Source: Thinkstock
50. Waco, TX
> Poverty rate: 20.3%
> July 2016 unemployment rate: 3.9%
> Households receiving SNAP benefits: 11.6%
> Households with income under $10,000: 5.5%
Source: Thinkstock
49. Morgantown, WV
> Poverty rate: 20.3%
> July 2016 unemployment rate: 4.3%
> Households receiving SNAP benefits: 10.0%
> Households with income under $10,000: 5.0%

Source: Wikimedia Commons
48. Harrisonburg, VA
> Poverty rate: 20.3%
> July 2016 unemployment rate: 3.9%
> Households receiving SNAP benefits: 9.2%
> Households with income under $10,000: 5.4%

Source: Wikimedia Commons
47. Medford, OR
> Poverty rate: 20.3%
> July 2016 unemployment rate: 6.6%
> Households receiving SNAP benefits: 23.0%
> Households with income under $10,000: 7.8%
Source: Wikimedia Commons
46. Johnson City, TN
> Poverty rate: 20.4%
> July 2016 unemployment rate: 5.0%
> Households receiving SNAP benefits: 14.7%
> Households with income under $10,000: 7.4%

Source: Thinkstock
45. Yuma, AZ
> Poverty rate: 20.5%
> July 2016 unemployment rate: 20.1%
> Households receiving SNAP benefits: 20.6%
> Households with income under $10,000: 6.7%
44. Fort Smith, AR-OK
> Poverty rate: 20.5%
> July 2016 unemployment rate: 4.8%
> Households receiving SNAP benefits: 17.4%
> Households with income under $10,000: 7.0%

Source: Wikimedia Commons
43. Flint, MI
> Poverty rate: 20.6%
> July 2016 unemployment rate: 4.4%
> Households receiving SNAP benefits: 20.7%
> Households with income under $10,000: 6.3%

Source: Wikimedia Commons
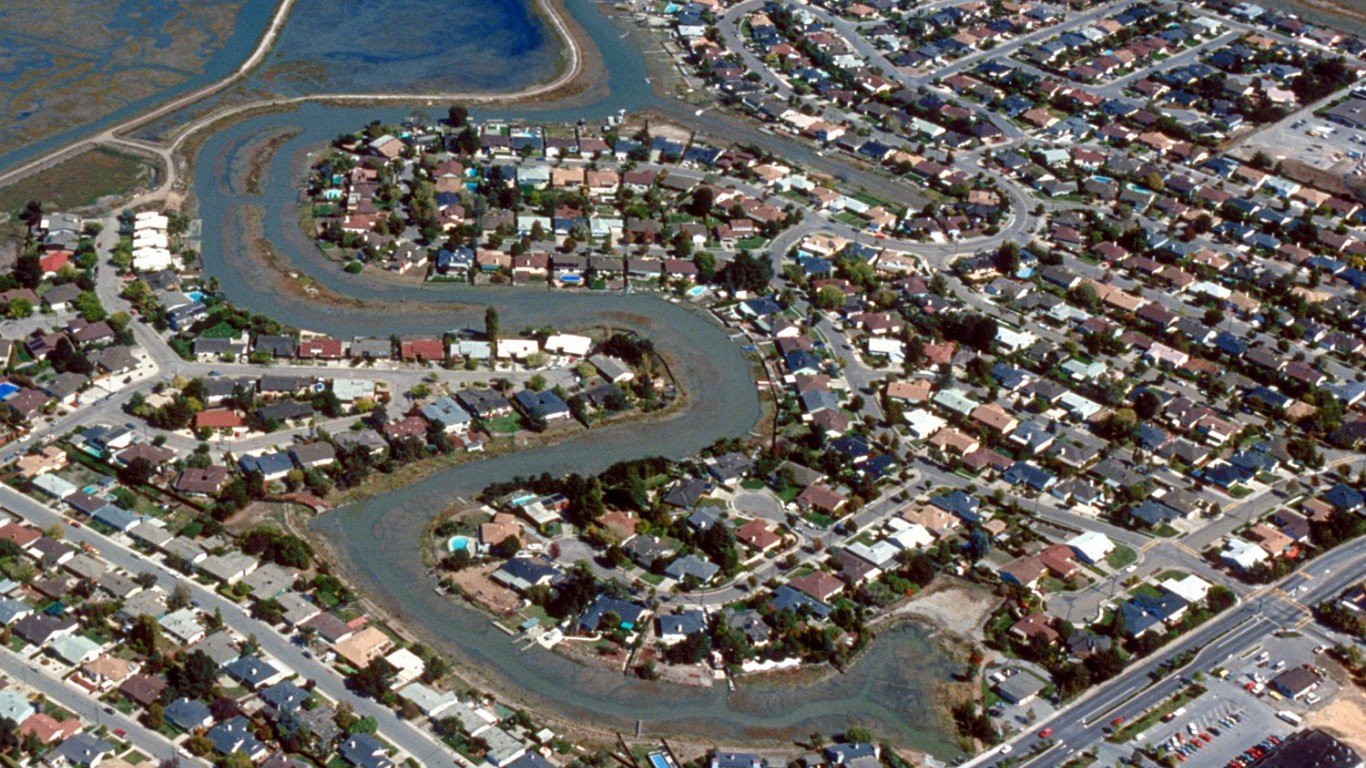
42. Yuba City, CA
> Poverty rate: 20.6%
> July 2016 unemployment rate: 9.4%
> Households receiving SNAP benefits: 15.0%
> Households with income under $10,000: 4.7%
Source: Wikimedia Commons
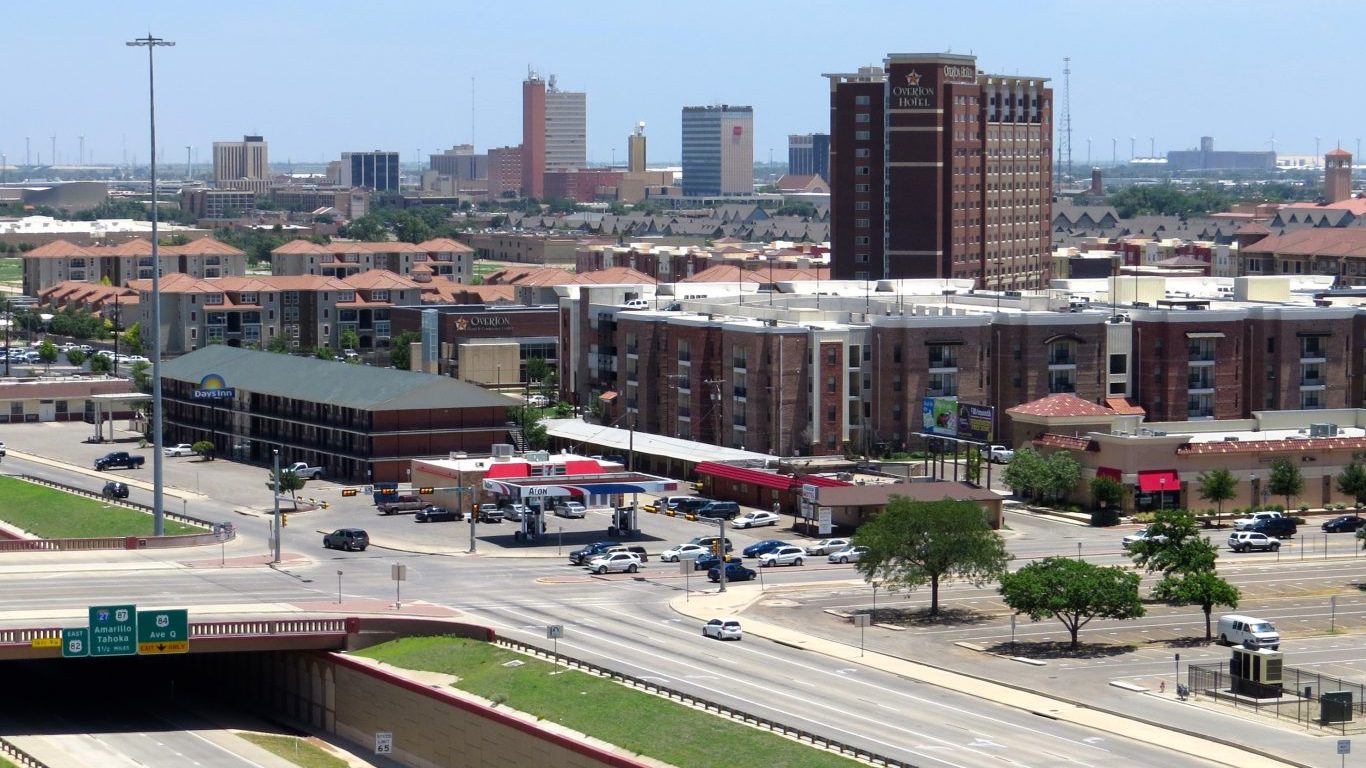
41. Lubbock, TX
> Poverty rate: 20.7%
> July 2016 unemployment rate: 3.4%
> Households receiving SNAP benefits: 12.5%
> Households with income under $10,000: 5.8%
Source: Wikimedia Commons
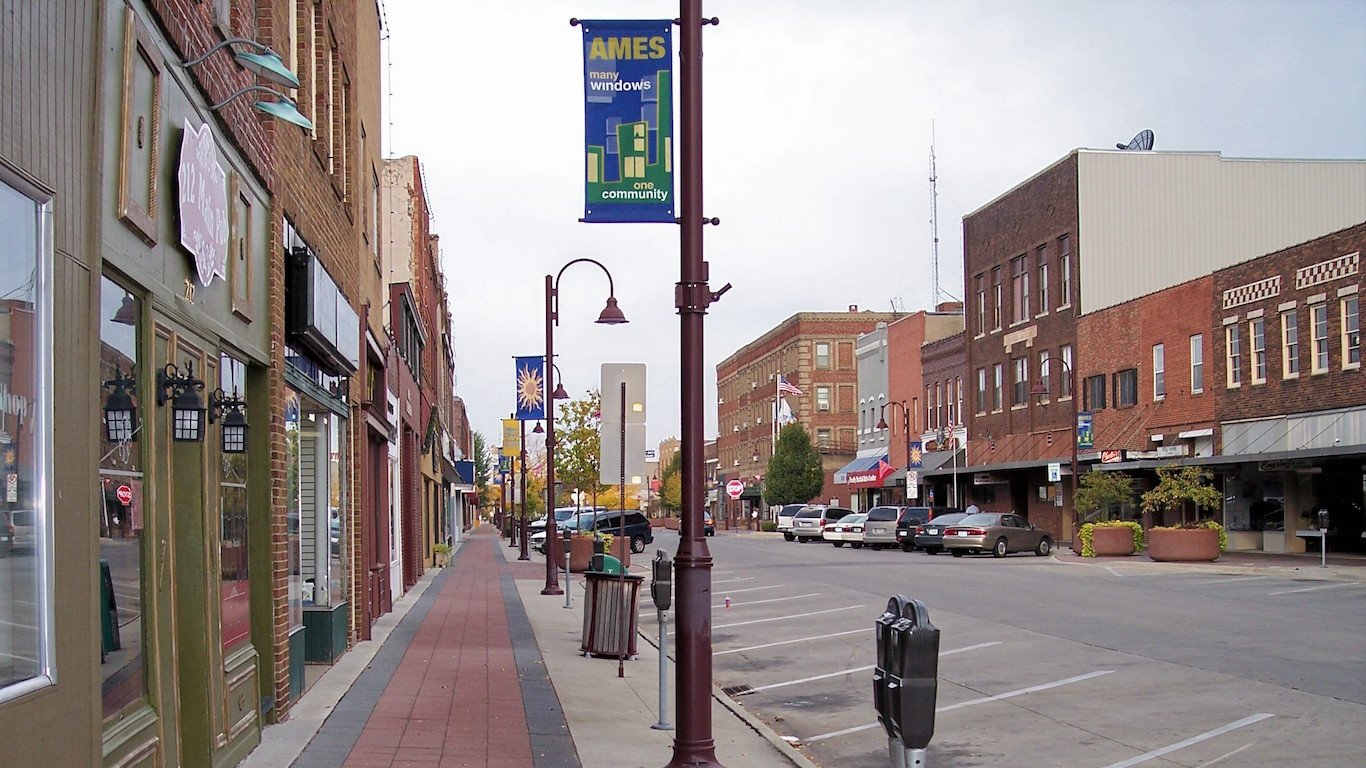
40. Ames, IA
> Poverty rate: 20.7%
> July 2016 unemployment rate: 2.5%
> Households receiving SNAP benefits: 7.9%
> Households with income under $10,000: 1.4%
Source: Wikimedia Commons
39. Manhattan, KS
> Poverty rate: 20.8%
> July 2016 unemployment rate: 3.3%
> Households receiving SNAP benefits: 6.3%
> Households with income under $10,000: 5.8%
 24/7 Wall St.
Source: Thinkstock
38. Tuscaloosa, AL
> Poverty rate: 21.0%
> July 2016 unemployment rate: 5.5%
> Households receiving SNAP benefits: 11.3%
> Households with income under $10,000: 6.3%

Source: Wikimedia Commons
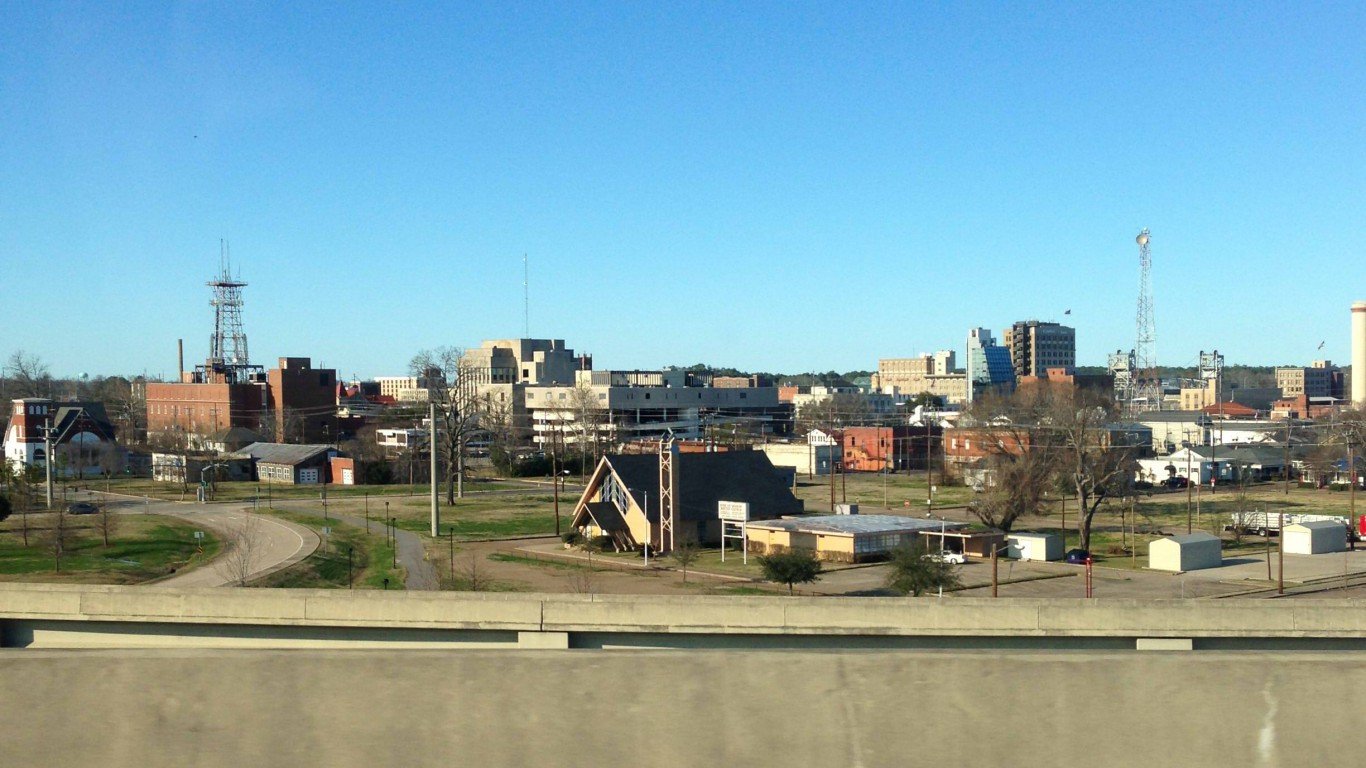
37. Shreveport-Bossier City, LA
> Poverty rate: 21.0%
> July 2016 unemployment rate: 6.7%
> Households receiving SNAP benefits: 16.1%
> Households with income under $10,000: 6.7%

Source: Thinkstock
36. Columbus, GA-AL
> Poverty rate: 21.1%
> July 2016 unemployment rate: 6.0%
> Households receiving SNAP benefits: 19.0%
> Households with income under $10,000: 5.9%

Source: Wikimedia Commons
35. Lawrence, KS
> Poverty rate: 21.3%
> July 2016 unemployment rate: 3.6%
> Households receiving SNAP benefits: 6.9%
> Households with income under $10,000: 3.4%

Source: Wikimedia Commons
34. Chico, CA
> Poverty rate: 21.8%
> July 2016 unemployment rate: 6.9%
> Households receiving SNAP benefits: 11.9%
> Households with income under $10,000: 4.1%

Source: Wikimedia Commons
33. Gainesville, FL
> Poverty rate: 21.9%
> July 2016 unemployment rate: 4.1%
> Households receiving SNAP benefits: 11.3%
> Households with income under $10,000: 5.1%
32. Auburn-Opelika, AL
> Poverty rate: 21.9%
> July 2016 unemployment rate: 4.9%
> Households receiving SNAP benefits: 15.0%
> Households with income under $10,000: 6.7%

Source: Wikimedia Commons
31. Bakersfield, CA
> Poverty rate: 21.9%
> July 2016 unemployment rate: 10.6%
> Households receiving SNAP benefits: 16.4%
> Households with income under $10,000: 6.3%

Source: Wikimedia Commons
30. Hinesville, GA
> Poverty rate: 22.0%
> July 2016 unemployment rate: 5.3%
> Households receiving SNAP benefits: 21.3%
> Households with income under $10,000: 6.1%
Source: Wikimedia Commons
29. Alexandria, LA
> Poverty rate: 22.0%
> July 2016 unemployment rate: 6.5%
> Households receiving SNAP benefits: 19.0%
> Households with income under $10,000: 6.5%

Source: https://www.flickr.com/photos/harriswalkerphotography/
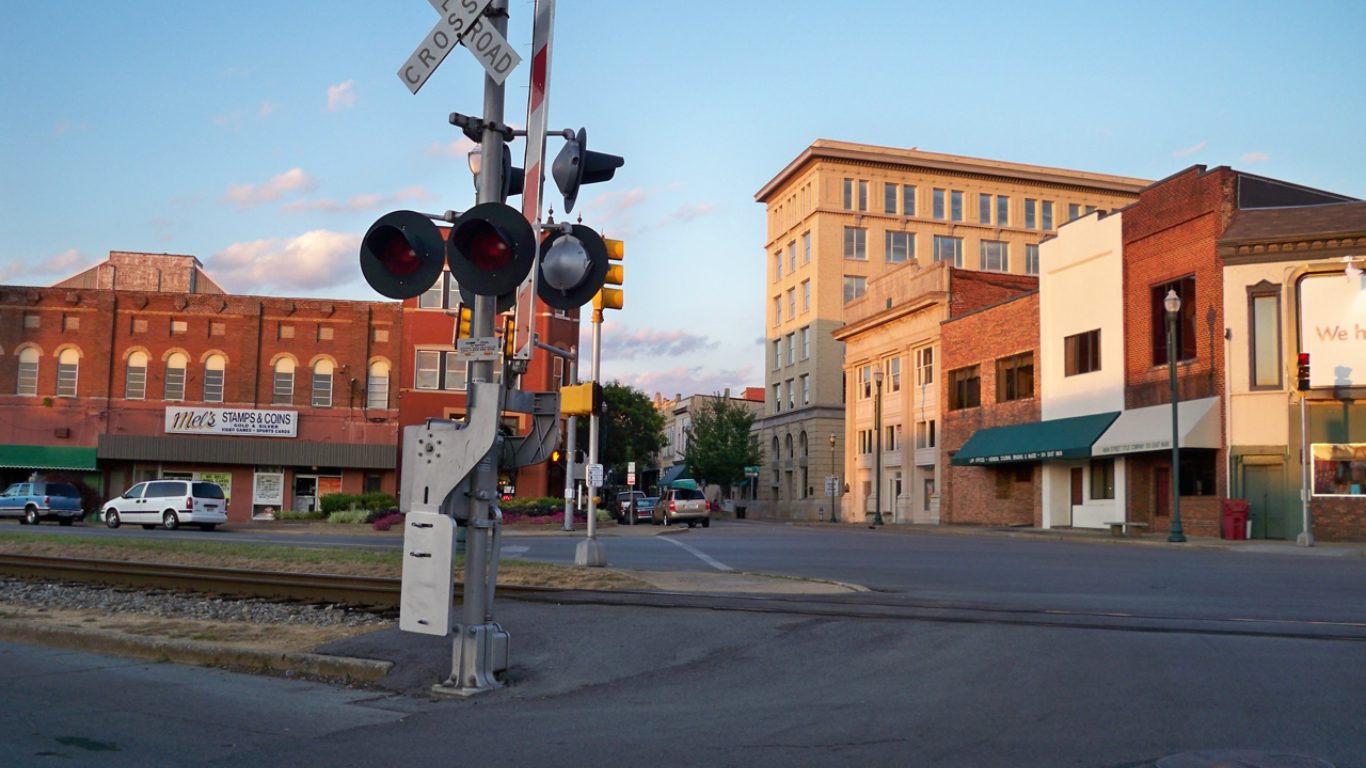
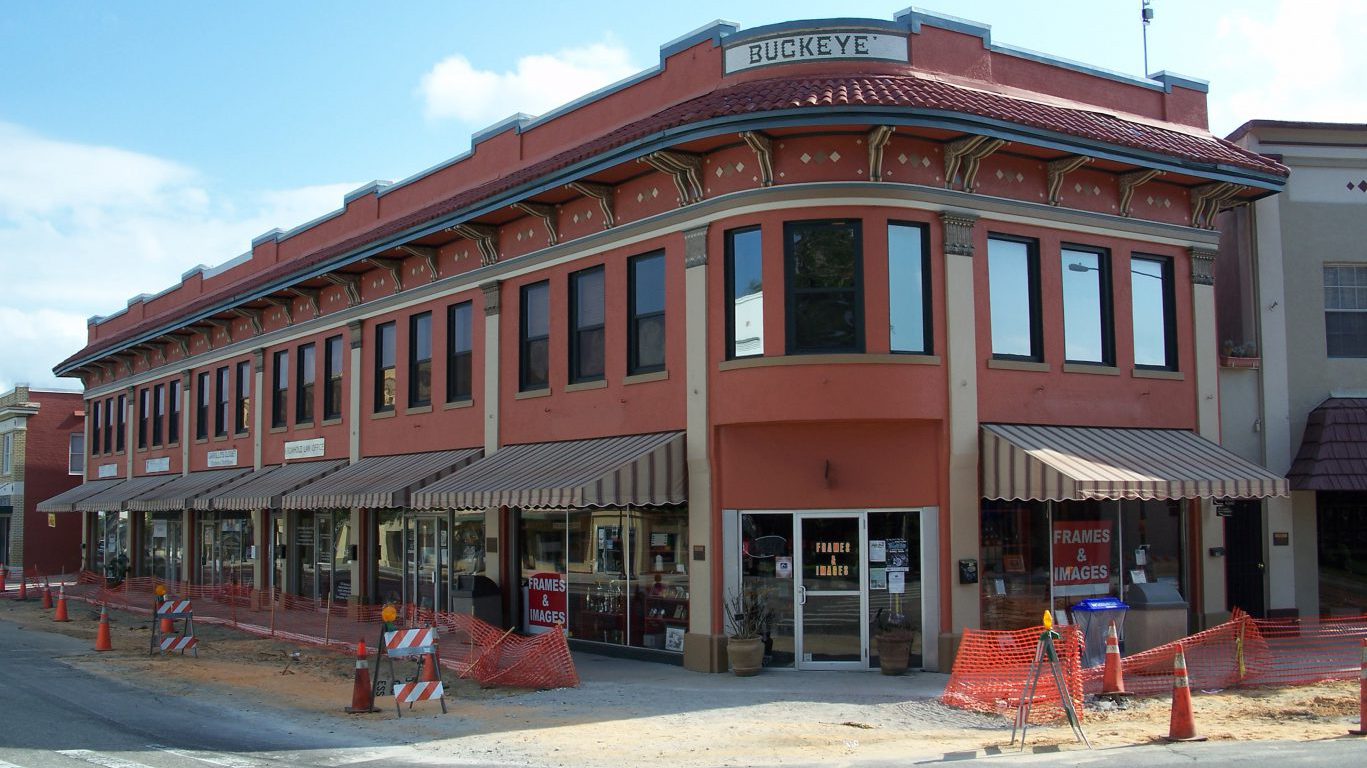
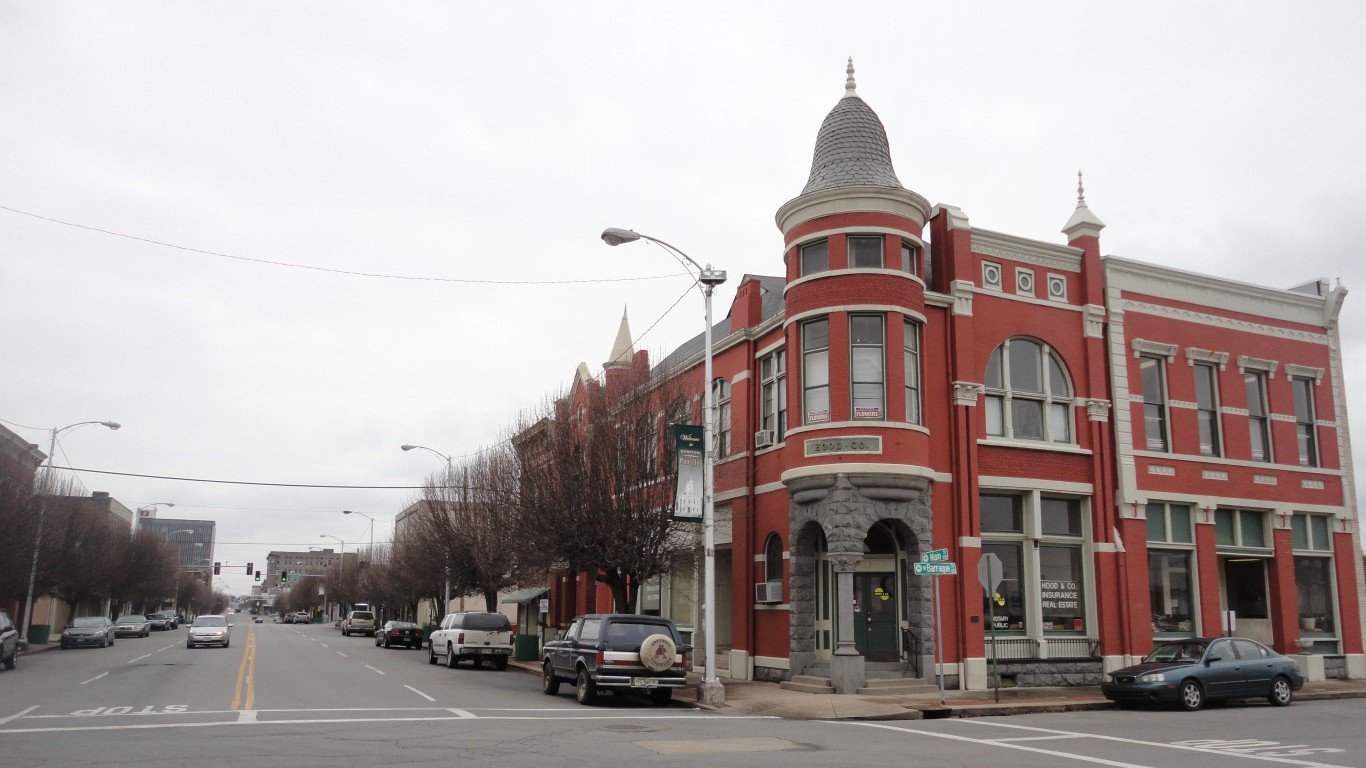
28. Rocky Mount, NC
> Poverty rate: 22.0%
> July 2016 unemployment rate: 6.8%
> Households receiving SNAP benefits: 23.3%
> Households with income under $10,000: 5.4%

Source: Wikimedia Commons
27. Ithaca, NY
> Poverty rate: 22.3%
> July 2016 unemployment rate: 3.5%
> Households receiving SNAP benefits: 6.8%
> Households with income under $10,000: 3.1%
 24/7 Wall St.
Source: Thinkstock
26. Tallahassee, FL
> Poverty rate: 22.4%
> July 2016 unemployment rate: 4.5%
> Households receiving SNAP benefits: 16.0%
> Households with income under $10,000: 5.3%

Source: Wikimedia Commons
25. Grants Pass, OR
> Poverty rate: 22.6%
> July 2016 unemployment rate: 7.4%
> Households receiving SNAP benefits: 24.5%
> Households with income under $10,000: 4.5%

Source: Thinkstock
24. College Station-Bryan, TX
> Poverty rate: 23.0%
> July 2016 unemployment rate: 3.5%
> Households receiving SNAP benefits: 8.1%
> Households with income under $10,000: 5.0%
Source: Wikimedia Commons
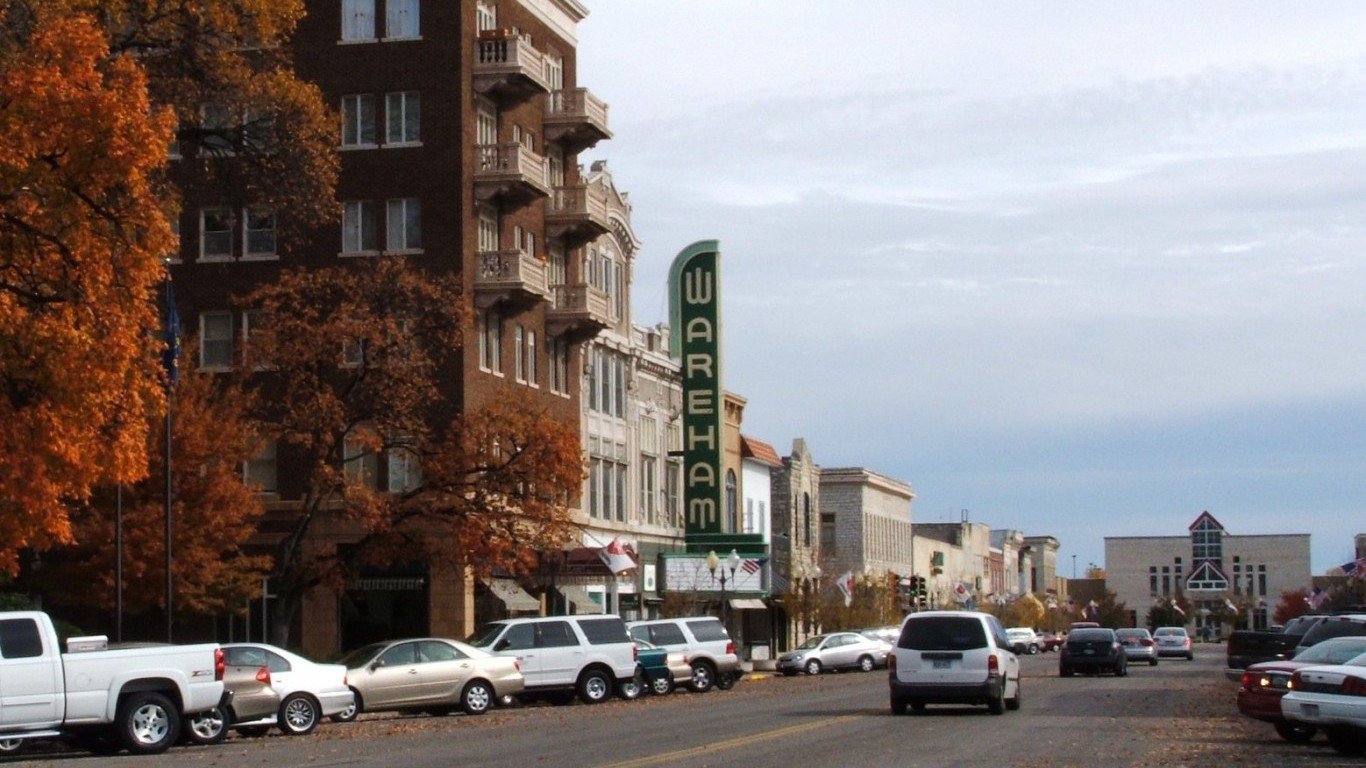
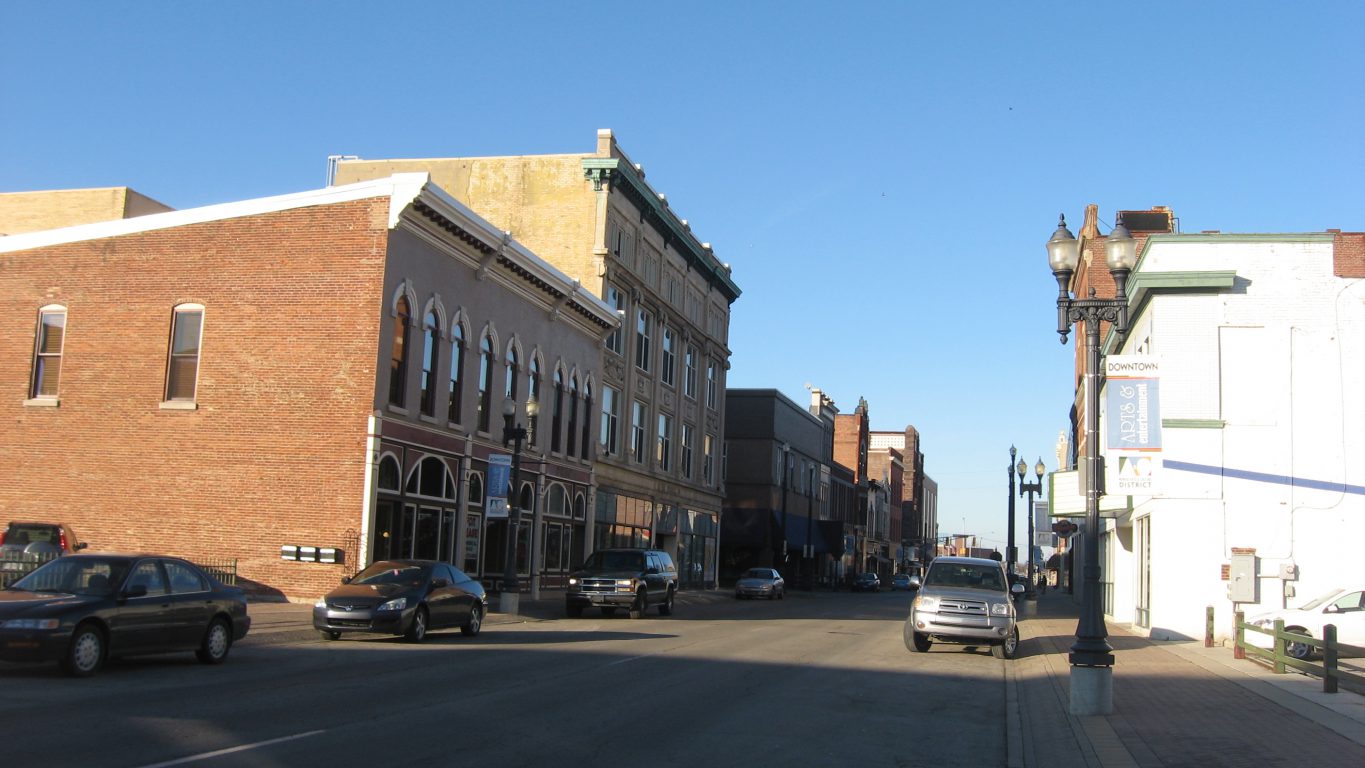
23. Muncie, IN
> Poverty rate: 23.4%
> July 2016 unemployment rate: 4.9%
> Households receiving SNAP benefits: 16.1%
> Households with income under $10,000: 8.6%
Source: Wikimedia Commons
22. Madera, CA
> Poverty rate: 23.4%
> July 2016 unemployment rate: 9.5%
> Households receiving SNAP benefits: 16.9%
> Households with income under $10,000: 6.6%

Source: Wikimedia Commons
21. Hattiesburg, MS
> Poverty rate: 23.5%
> July 2016 unemployment rate: 5.4%
> Households receiving SNAP benefits: 18.1%
> Households with income under $10,000: 8.1%

Source: Wikimedia Commons
20. Hanford-Corcoran, CA
> Poverty rate: 23.6%
> July 2016 unemployment rate: 10.1%
> Households receiving SNAP benefits: 18.0%
> Households with income under $10,000: 5.8%

Source: Thinkstock
19. Macon, GA
> Poverty rate: 23.7%
> July 2016 unemployment rate: 5.3%
> Households receiving SNAP benefits: 18.2%
> Households with income under $10,000: 8.8%
 24/7 Wall St.
Source: Thinkstock
18. Monroe, LA
> Poverty rate: 23.9%
> July 2016 unemployment rate: 6.2%
> Households receiving SNAP benefits: 16.5%
> Households with income under $10,000: 10.5%

Source: Thinkstock
17. Bloomington, IN
> Poverty rate: 24.2%
> July 2016 unemployment rate: 4.8%
> Households receiving SNAP benefits: 8.7%
> Households with income under $10,000: 5.2%

Source: Wikimedia Commons
16. Albany, GA
> Poverty rate: 24.6%
> July 2016 unemployment rate: 5.8%
> Households receiving SNAP benefits: 23.2%
> Households with income under $10,000: 12.9%
Source: Wikimedia Commons
15. Sebring, FL
> Poverty rate: 24.6%
> July 2016 unemployment rate: 6.2%
> Households receiving SNAP benefits: 14.8%
> Households with income under $10,000: 5.3%
Source: Wikimedia Commons
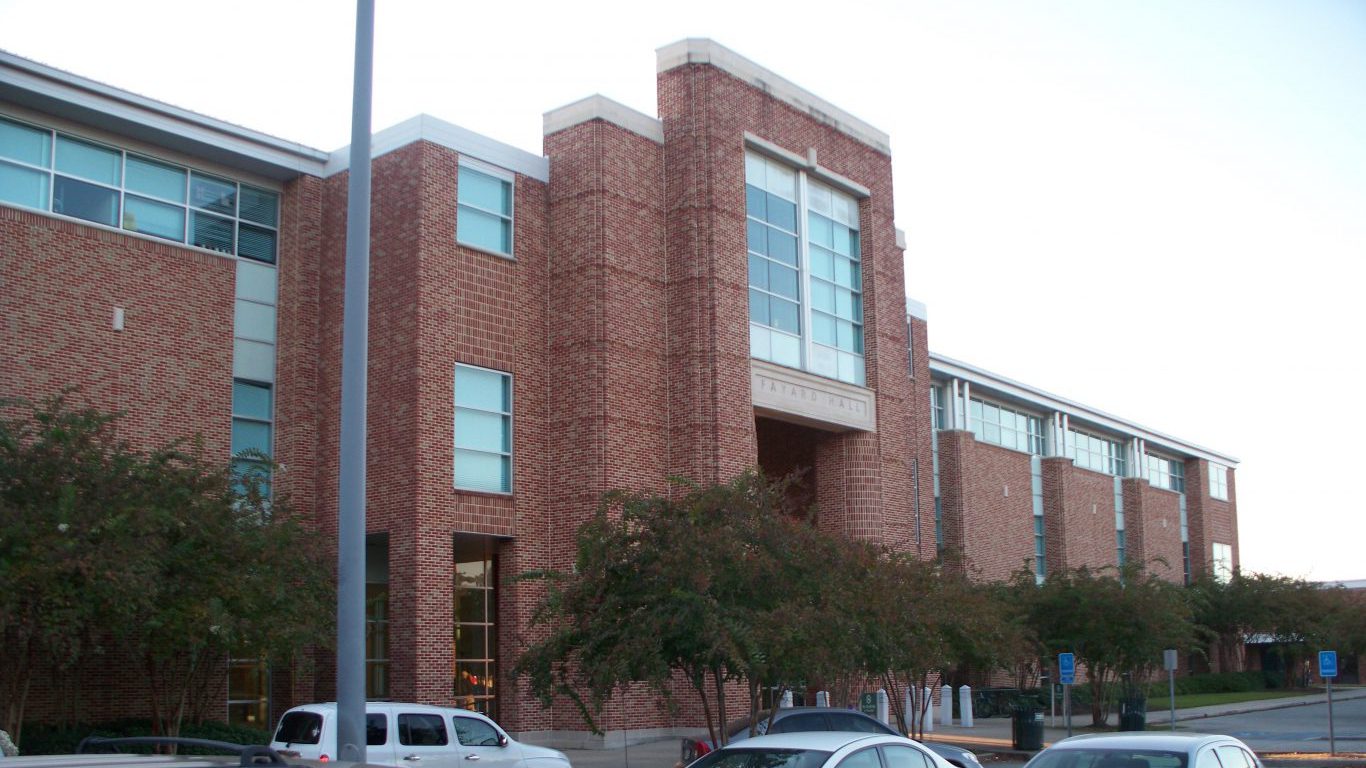
14. Hammond, LA
> Poverty rate: 24.6%
> July 2016 unemployment rate: 7.0%
> Households receiving SNAP benefits: 20.5%
> Households with income under $10,000: 6.7%
Source: Wikimedia Commons
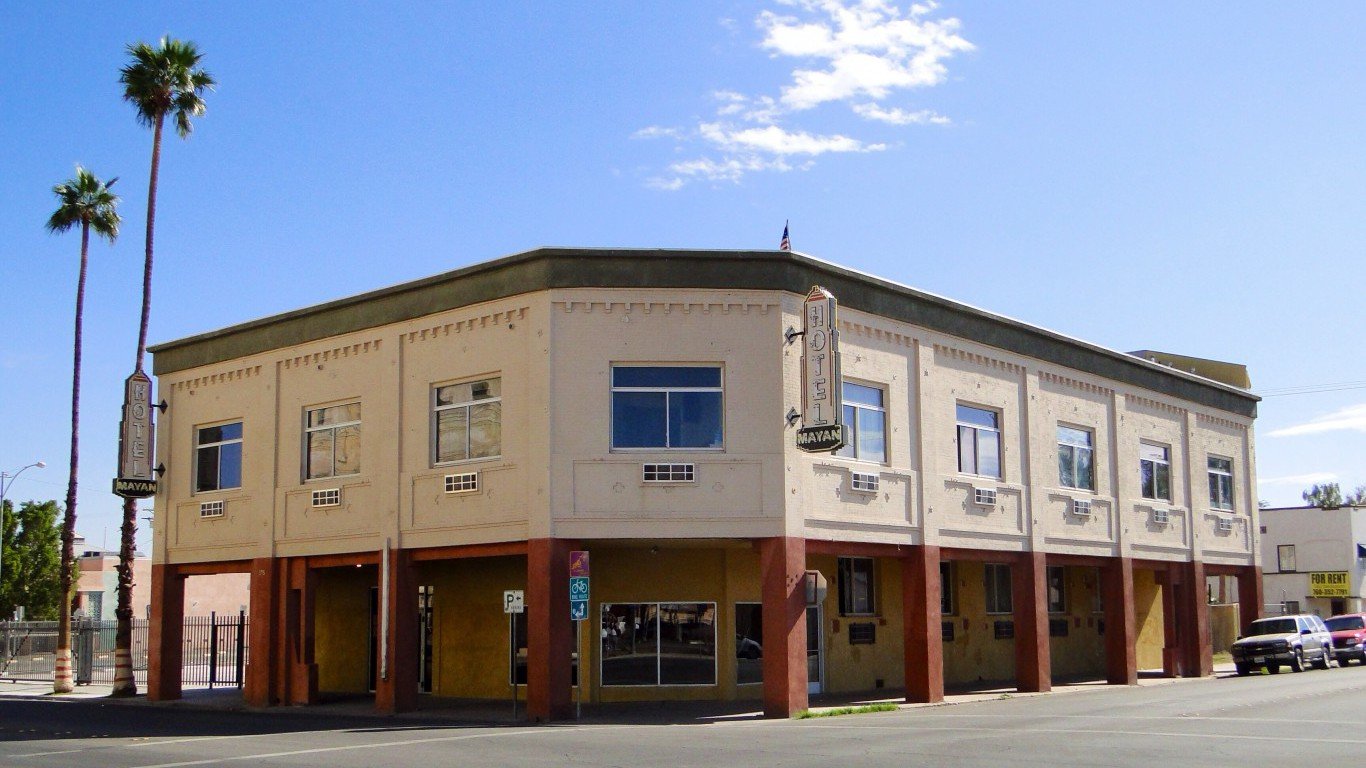
13. El Centro, CA
> Poverty rate: 25.1%
> July 2016 unemployment rate: 21.9%
> Households receiving SNAP benefits: 22.5%
> Households with income under $10,000: 8.1%

Source: Wikimedia Commons
12. Fresno, CA
> Poverty rate: 25.3%
> July 2016 unemployment rate: 9.6%
> Households receiving SNAP benefits: 21.0%
> Households with income under $10,000: 8.3%

Source: Wikimedia Commons
11. Pocatello, ID
> Poverty rate: 25.3%
> July 2016 unemployment rate: 3.6%
> Households receiving SNAP benefits: 15.6%
> Households with income under $10,000: 4.7%
Source: Wikimedia Commons
10. Pine Bluff, AR
> Poverty rate: 25.7%
> July 2016 unemployment rate: 5.2%
> Households receiving SNAP benefits: 21.0%
> Households with income under $10,000: 10.0%

Source: Wikimedia Commons
9. Valdosta, GA
> Poverty rate: 26.6%
> July 2016 unemployment rate: 4.9%
> Households receiving SNAP benefits: 18.1%
> Households with income under $10,000: 7.9%

Source: Wikimedia Commons
8. Merced, CA
> Poverty rate: 26.7%
> July 2016 unemployment rate: 10.7%
> Households receiving SNAP benefits: 21.5%
> Households with income under $10,000: 7.8%
Source: Wikimedia Commons
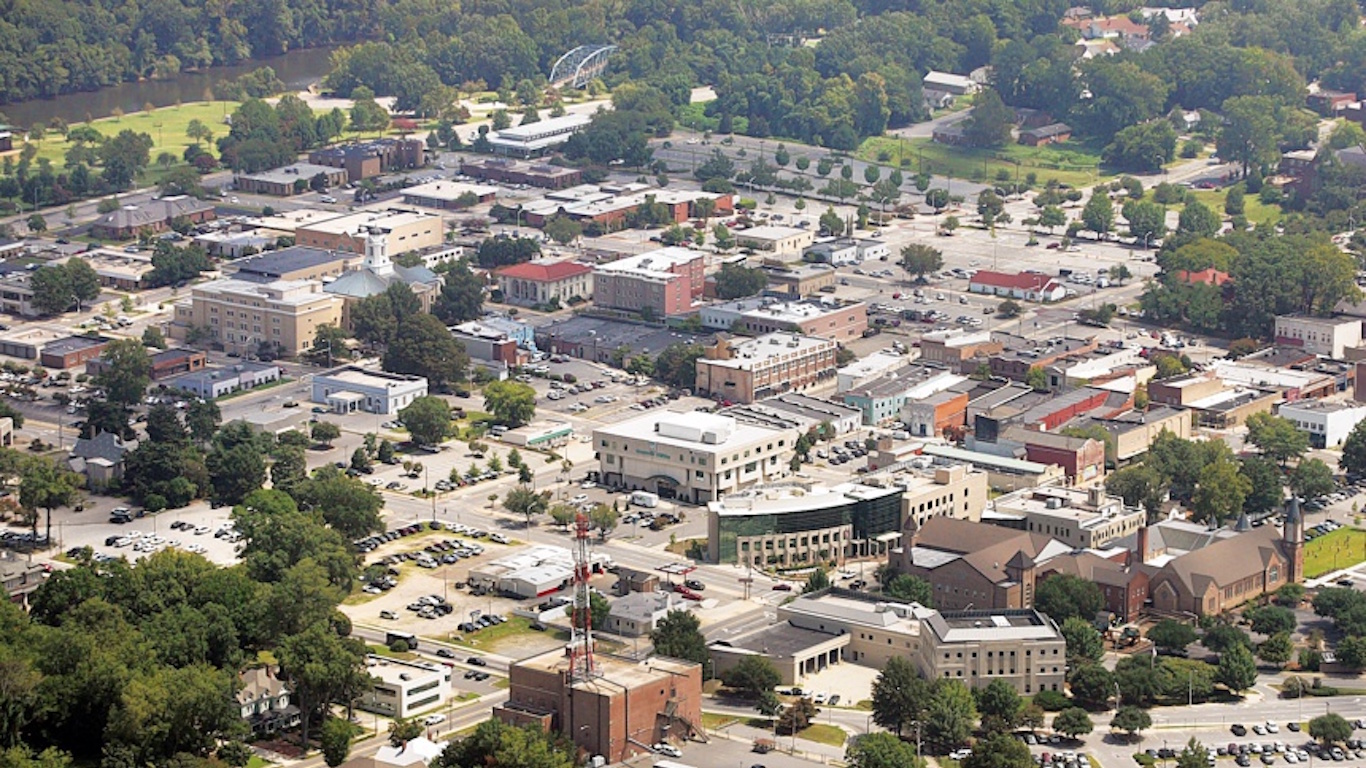
7. Greenville, NC
> Poverty rate: 26.8%
> July 2016 unemployment rate: 5.0%
> Households receiving SNAP benefits: 17.2%
> Households with income under $10,000: 6.6%
 24/7 Wall St.
Source: Thinkstock
6. Athens-Clarke County, GA
> Poverty rate: 27.1%
> July 2016 unemployment rate: 4.6%
> Households receiving SNAP benefits: 12.8%
> Households with income under $10,000: 7.0%
Source: Thinkstock
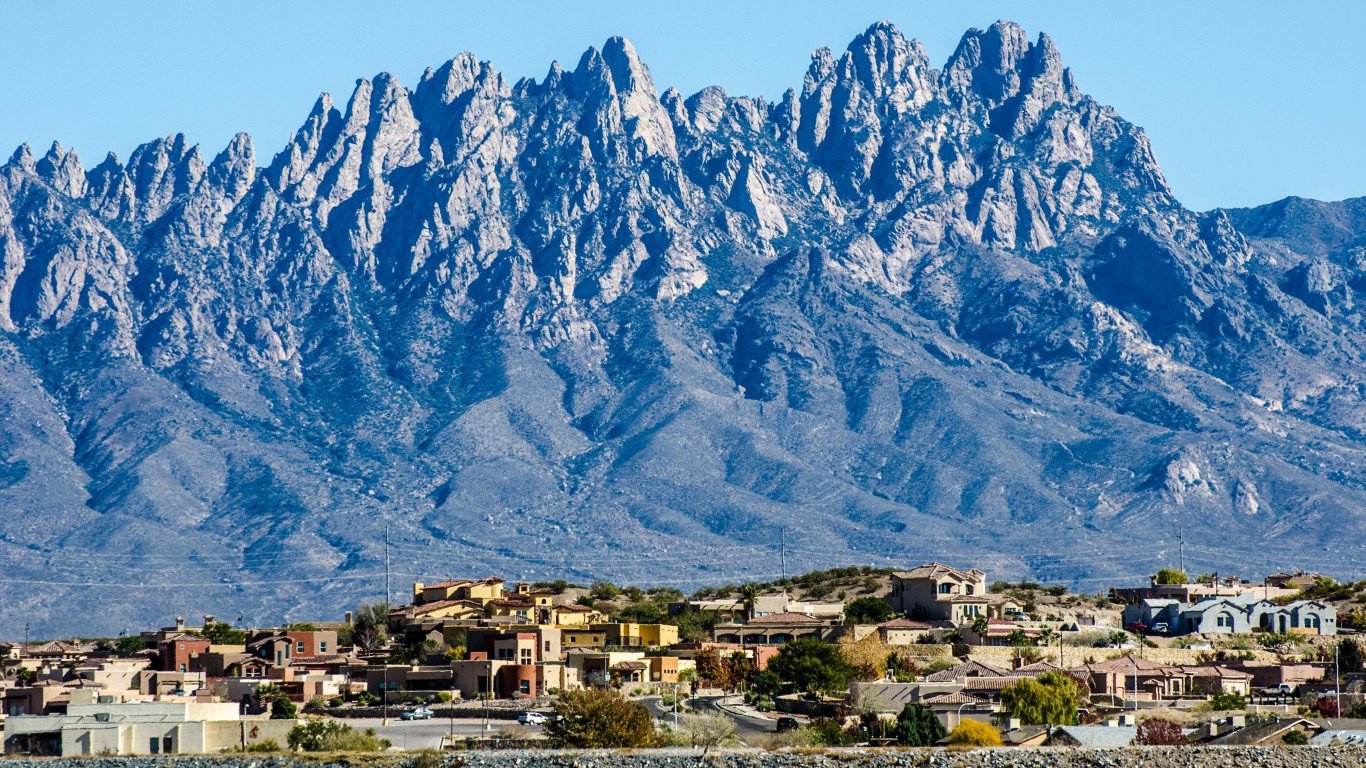
5. Las Cruces, NM
> Poverty rate: 27.1%
> July 2016 unemployment rate: 7.0%
> Households receiving SNAP benefits: 22.9%
> Households with income under $10,000: 7.7%

Source: Thinkstock
4. Visalia-Porterville, CA
> Poverty rate: 27.6%
> July 2016 unemployment rate: 11.2%
> Households receiving SNAP benefits: 24.4%
> Households with income under $10,000: 6.3%
Source: Wikimedia Commons
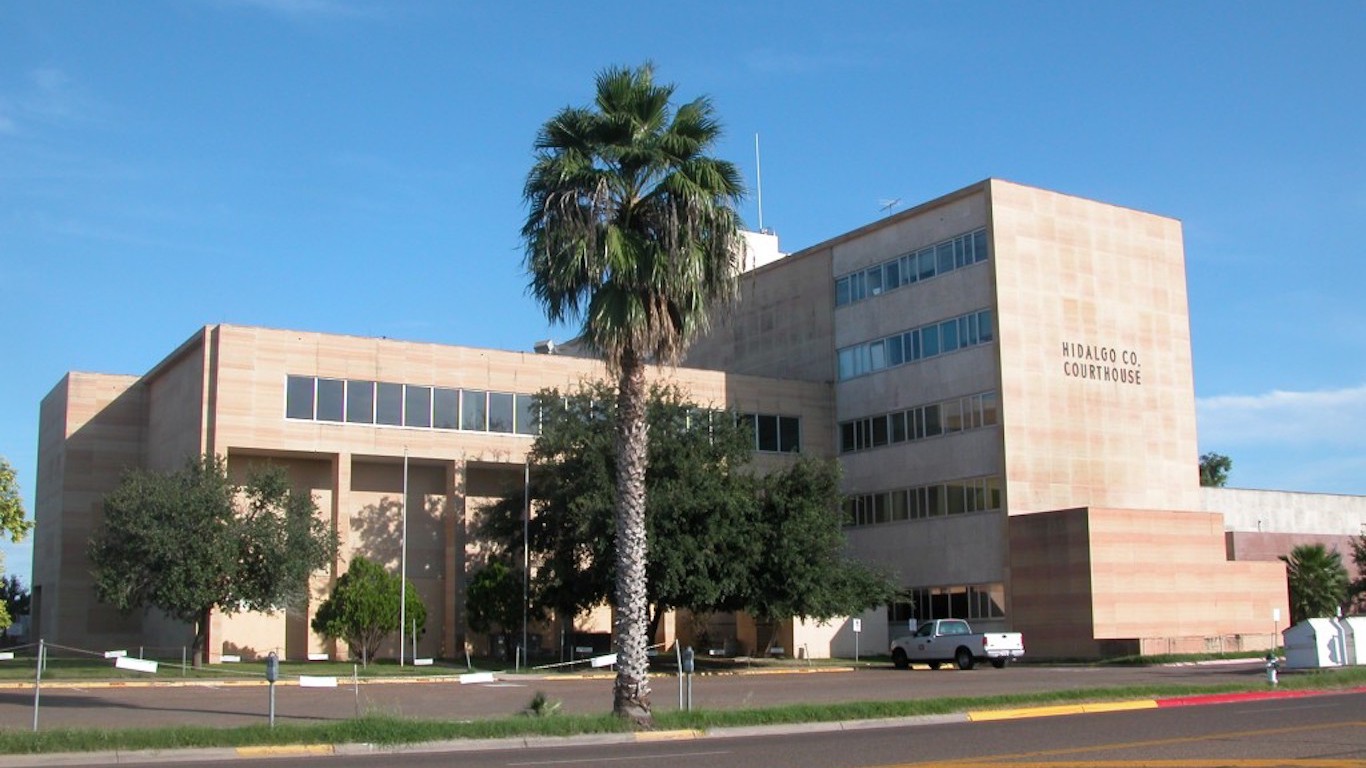
3. McAllen-Edinburg-Mission, TX
> Poverty rate: 31.5%
> July 2016 unemployment rate: 7.7%
> Households receiving SNAP benefits: 30.2%
> Households with income under $10,000: 8.8%
Source: Wikimedia Commons
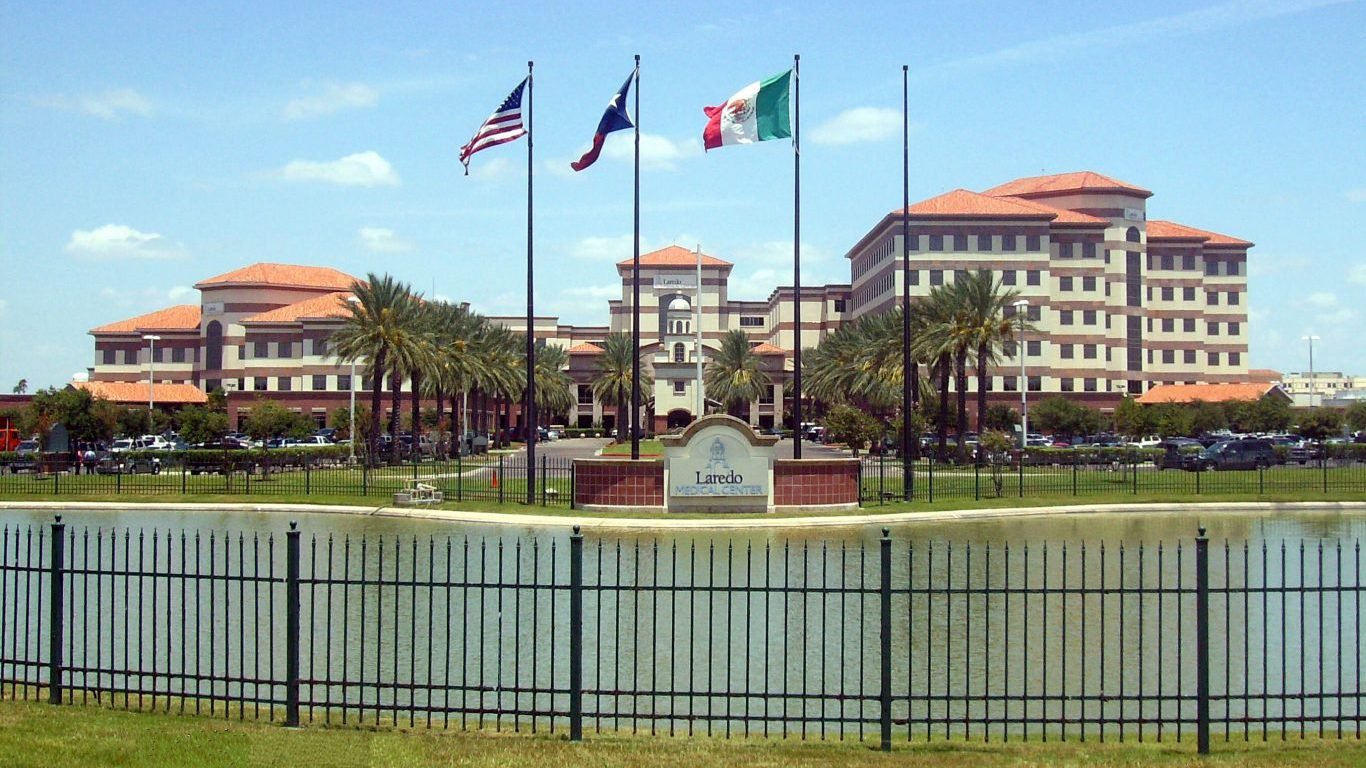
2. Laredo, TX
> Poverty rate: 31.8%
> July 2016 unemployment rate: 4.9%
> Households receiving SNAP benefits: 32.3%
> Households with income under $10,000: 9.3%

Source: Wikimedia Commons
1. Brownsville-Harlingen, TX
> Poverty rate: 32.4%
> July 2016 unemployment rate: 7.2%
> Households receiving SNAP benefits: 26.5%
> Households with income under $10,000: 10.6%
Sponsored: Want to Retire Early? Here’s a Great First Step
Want retirement to come a few years earlier than you’d planned? Or are you ready to retire now, but want an extra set of eyes on your finances?
Now you can speak with up to 3 financial experts in your area for FREE. By simply clicking here you can begin to match with financial professionals who can help you build your plan to retire early. And the best part? The first conversation with them is free.
Click here to match with up to 3 financial pros who would be excited to help you make financial decisions.
Thank you for reading! Have some feedback for us?
Contact the 24/7 Wall St. editorial team.
Editors' Picks

