Special Report
States With the Best (and Worst) Schools

Published:
Last Updated:
Few concerns facing the United States — or any nation — are more important than ensuring children receive a first-rate education. At her confirmation hearing on Tuesday, U.S. education secretary nominee Betsy DeVos answered questions about school proficiency. Policymakers and observers disagree as to how to spend public education funds and how exactly schools should be improved. At the very least, however, most agree that school proficiency must be measured.
The nation’s education system has remained steady through poor economic times as well as policy changes. But steady is not enough and there remains considerable room for improvement.
[in-text-ad]
24/7 Wall St. reviewed education data for each state from the 2017 edition of the Quality Counts report, released annually by Education Week. The report assessed metrics in three broad categories that can determine the strength of a school system: school finances, student achievement, and environmental factors. Massachusetts schools are rated best of all states, while Nevada’s school system has the lowest score.
Click here to see the states with the best and worst schools.
According to Sterling Lloyd, assistant director at the Education Week Research Center and coauthor of the Quality Counts report, the grading framework rewards states with a “well-rounded approach to education.” Broadly speaking, in states at the top end of the ranking, parents have the resources to support their children’s learning in well-funded schools; students report high academic achievement in the classroom; and graduates are able to pursue careers in an economy where opportunities are available to them.
Family income levels can play a major role in the quality of a child’s education. As Lloyd explained, “it certainly helps for parents to be able to provide stability and resources.” A child from a high-income family may enjoy greater access to books and a personal computer, as well as access to extracurricular activities that require some monetary investment. These educational tools and learning experiences are generally less available to poorer children.
In the United States, 57.2% of children are raised in households with incomes at least double the poverty level. In all but two of the states in the top half of the rankings, a larger share of children live in such households. Conversely, in only six of the 25 lower ranked states the share is greater.
Because school budgets are funded largely by property taxes as well as extensive private fundraising, a child from a high-income family is also more likely to attend school in a well-funded school district. Children attending such schools benefit from a range of additional advantages, including teachers with higher pay and greater qualifications.
By contrast, “children living in low-income areas [may not] have the resources to help them get off to a good start,” Lloyd said. Citing research indicating the benefits to all children of pre-K programs, Lloyd went on to say that “preschool can help to counteract certain disadvantages and is especially important for children in poverty.” Despite the higher stakes for low-income families, the likelihood of a child attending preschool is lower across states in which more families face financial instability.
Other socioeconomic measures, such as parental educational attainment and having fluent English speaking parents, can also have a significant bearing on a student’s chances for academic success.
To identify the states with the best and worst schools, 24/7 Wall St. used Education Week’s Quality Counts 2017 report. The report is based on three major categories: chance for success, finances, and K-12 achievement. The chance for success category includes data on family income, parent education and employment, child schooling, and employment opportunities after college. Graduation rates are defined as the percent of public high school students who graduated on time with a standard diploma for the 2014-2015 school year. All other data are for the most recent available year and are based on Education Week’s analysis of data from the U.S. Census Bureau, among other sources. The finance category incorporates metrics on cost-adjusted per-pupil spending and how equitably spending was distributed across school districts in the state in 2013. The K-12 achievement category uses 2015 test score data from the National Assessment of Educational Progress. Each category was weighted equally in determining the final ranking.
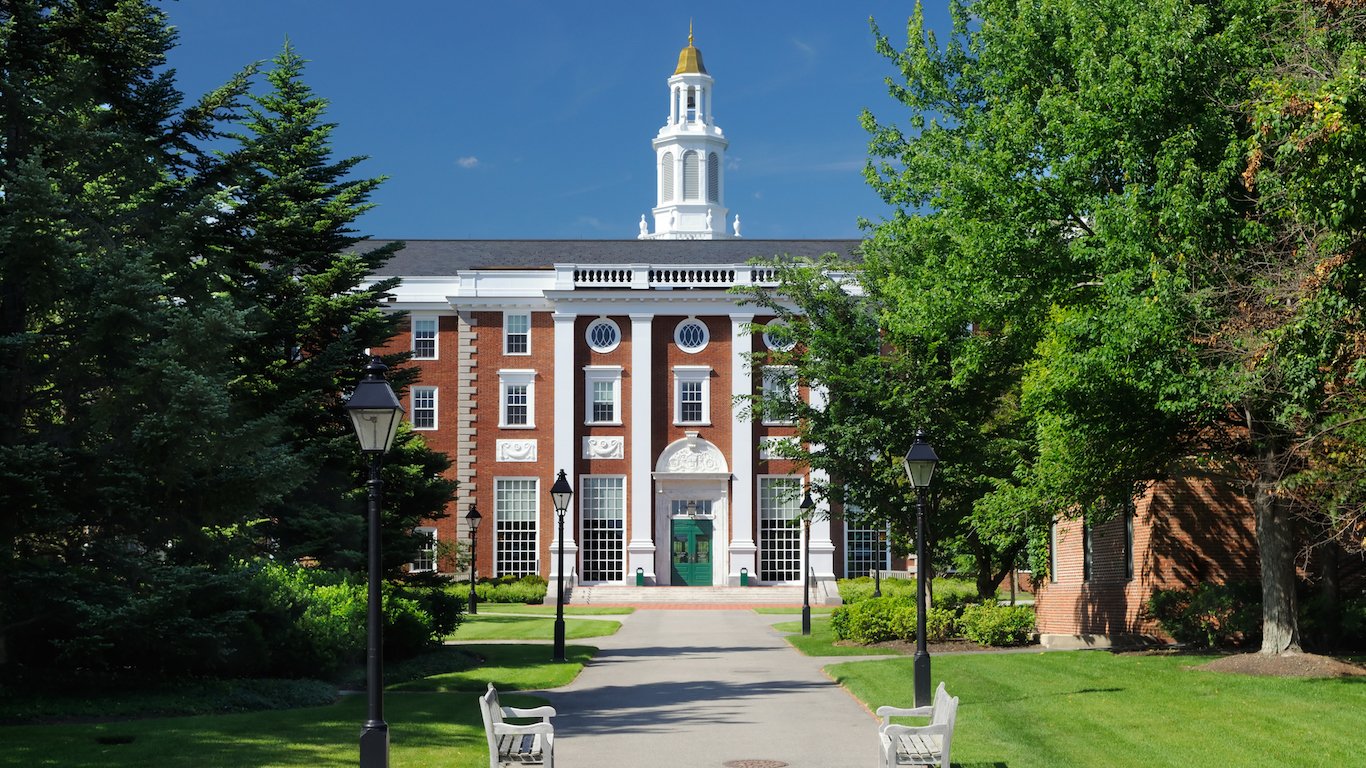
1. Massachusetts
> Overall grade: B
> Per pupil spending: $14,081 (11th highest)
> High school graduation rate: 87.3% (13th highest)
> Pct. 3 & 4 yr. olds enrolled in preschool: 57.8% (3rd highest)
Based on a variety of measures related to school funding and academic achievement, Massachusetts earns a better grade than any other state in Education Week’s Quality Counts report. Early childhood education is important for cognitive development, and in Massachusetts, 57.8% of three- and four-year olds are enrolled in preschool, one of the highest shares of any state. Perhaps due in part to a robust childhood education program, Massachusetts has the highest share of fourth and eighth graders who are proficient in math and reading.
The state’s successes, however, are not entirely attributable to its education system. Children living in poverty face a host of challenges that can hinder educational achievement, and children growing up in Massachusetts are far more likely to grow up in a financially secure environment than most youth. Additionally, children raised by educated parents are more likely to do better in school, and in Massachusetts, 61.7% of children have at least one parent with a post-secondary degree, well above the 48.8% national average.
[in-text-ad]
2. New Jersey
> Overall grade: B
> Per pupil spending: $15,946 (6th highest)
> High school graduation rate: 89.7% (2nd highest)
> Pct. 3 & 4 yr. olds enrolled in preschool: 63.7% (2nd highest)
Only three states report a higher median annual household income than New Jersey’s $72,222. Partially because of its strong tax base, New Jersey invests heavily in its public school system. The Garden State spends the equivalent of 4.8% of its taxable resources on its schools, second in the country only to Vermont. Each year, nearly $16,000 per student are spent on New Jersey schools — more than all but five other states.
While the connection between school spending and educational outcomes is complex, in New Jersey, high spending accompanies strong academic performance. The state has some of the largest shares both of math and english-proficient eighth graders, and about 38% of 11th and 12th grade advanced placement test scores in New Jersey are 3 or better — high enough to qualify for college credits — the sixth largest share of all states.
3. Vermont
> Overall grade: B
> Per pupil spending: $19,654 (the highest)
> High school graduation rate: 87.7% (11th highest)
> Pct. 3 & 4 yr. olds enrolled in preschool: 54.2% (5th highest)
Vermont is one of several New England states to have one of the highest rated education systems in the country. As is the case in most other states in the region, students in Vermont tend to do well in many standardized measures of academic achievement. About 45% of fourth graders and 44% of eighth graders are proficient in reading, each the third largest share of any U.S. state. Strong academic performance may be linked to Vermont’s relatively robust early childhood education program. Some 54% of three- and four-year olds in the Green Mountain State are enrolled in preschool, a larger share than in all but four other states.
Vermont spends $19,654 on its schools per pupil annually, more than any other state. The high per-pupil spending is largely due to higher costs resulting from the state’s many small, rural districts.

4. New Hampshire
> Overall grade: B
> Per pupil spending: $15,386 (7th highest)
> High school graduation rate: 88.1% (7th highest)
> Pct. 3 & 4 yr. olds enrolled in preschool: 53.1% (7th highest)
Children in New Hampshire are more likely to be raised in a financially secure household with college educated parents than children in any other state. Growing up in poverty can significantly hinder academic performance, and in New Hampshire, three-quarters of all children live in families earning at least twice poverty level income, a far higher share than the 57.2% of American children growing up in such households. Additionally, 63.9% of children in New Hampshire have at least one parent with a college degree, compared to less than half of all American children.
With so many children coming from backgrounds conducive to academic success, students in New Hampshire report better results in the classroom than is typical. The state is home to the second highest share of fourth and eighth graders proficient in reading than any other state in the country.
[in-text-ad-2]

5. Maryland
> Overall grade: B
> Per pupil spending: $12,922 (18th highest)
> High school graduation rate: 87.0% (16th highest)
> Pct. 3 & 4 yr. olds enrolled in preschool: 50.5% (10th highest)
The wealthiest state in the nation, a typical household in Maryland earns $75,847 a year. Despite a strong tax base, Maryland’s $12,922 annual per-pupil education spending is only a few hundred dollars higher than the average spending nationwide. Though school spending is not especially high in Maryland, it is equitable. No state in the country has more even funding distribution across districts than Maryland.
Ranking relatively well in school finance, Maryland also does better than the vast majority of states in student achievement. In Maryland 55.8% of 11th and 12th graders’ advanced placement tests earned scores of at least a 3 by far the largest share of any state in the country.
6. Connecticut
> Overall grade: B
> Per pupil spending: $16,637 (5th highest)
> High school graduation rate: 87.2% (14th highest)
> Pct. 3 & 4 yr. olds enrolled in preschool: 63.9% (the highest)
Connecticut allocates 4% of its total taxable resources to education, a larger share than in all but a few other states. Some of these funds go to the state’s pre-K program. Early childhood education can be crucial for social, emotional, and cognitive development. With 63.9% of three- and four-year olds enrolled in preschool, Connecticut is leading all states in an important measure for children’s chances for success.
While it is no guarantee of achievement, children who grow up in an economically secure household are more likely to find academic success. Nearly 72% of children in Connecticut are raised in households with incomes at least double the poverty rate, well above the 57% share of children nationwide.
[in-text-ad]

7. Wyoming
> Overall grade: B-
> Per pupil spending: $17,490 (4th highest)
> High school graduation rate: 79.3% (14th lowest)
> Pct. 3 & 4 yr. olds enrolled in preschool: 40.3% (12th lowest)
Wyoming is the only state west of the Mississippi River to have one of the best-rated education systems. While student achievement is just average in Wyoming, the state’s school system is one of the best-financed in the country. The state allocates 4.1% of its taxable resources to education spending, a larger share than all but five other states. With a relatively large budget, every public school student in the state benefits from per-pupil spending that exceeds the national average, and only two other states have more equitable distribution of funds between districts.
The relationship between per-pupil spending and educational outcomes is complex. Despite Wyoming’s considerable investment in public schools, fewer than 80% of high school students graduate on time, slightly below the 83.2% national high school graduation rate.

8. Pennsylvania
> Overall grade: B-
> Per pupil spending: $14,394 (10th highest)
> High school graduation rate: 84.8% (25th lowest)
> Pct. 3 & 4 yr. olds enrolled in preschool: 45.0% (25th highest)
Schools in Pennsylvania are funded relatively well and equitably. Some 93% of students in the Keystone State are educated in districts that receive higher than the U.S. average per-pupil funding, a far larger share than is typical.
While the relationship between funding and educational outcomes is a matter of debate, students in Pennsylvania tend to do better in several measures of achievement than children in other states. Pennsylvania ranks seventh in the country in both fourth and eighth grade reading proficiency.

9. New York
> Overall grade: B-
> Per pupil spending: $18,191 (3rd highest)
> High school graduation rate: 79.2% (13th lowest)
> Pct. 3 & 4 yr. olds enrolled in preschool: 57.3% (4th highest)
New York spends more per pupil on education than all but two other states. In many high-spending states, school funding is unevenly distributed. In New York, however, nearly every student is enrolled in a district with higher than average per pupil spending.
While the statewide high school graduation rate trails the comparable national figure by a few percentage points, it has improved substantially in recent years. From 2002 to 2012, the state’s graduation rate improved by 17.5 percentage points, the second highest increase of any state over that time period. Eleventh and 12th grade advanced placement students tend to do better in New York than elsewhere. Some 38% of advanced placement test scores are high enough to potentially earn college credit, a larger share than in all but half a dozen other states.
[in-text-ad-2]
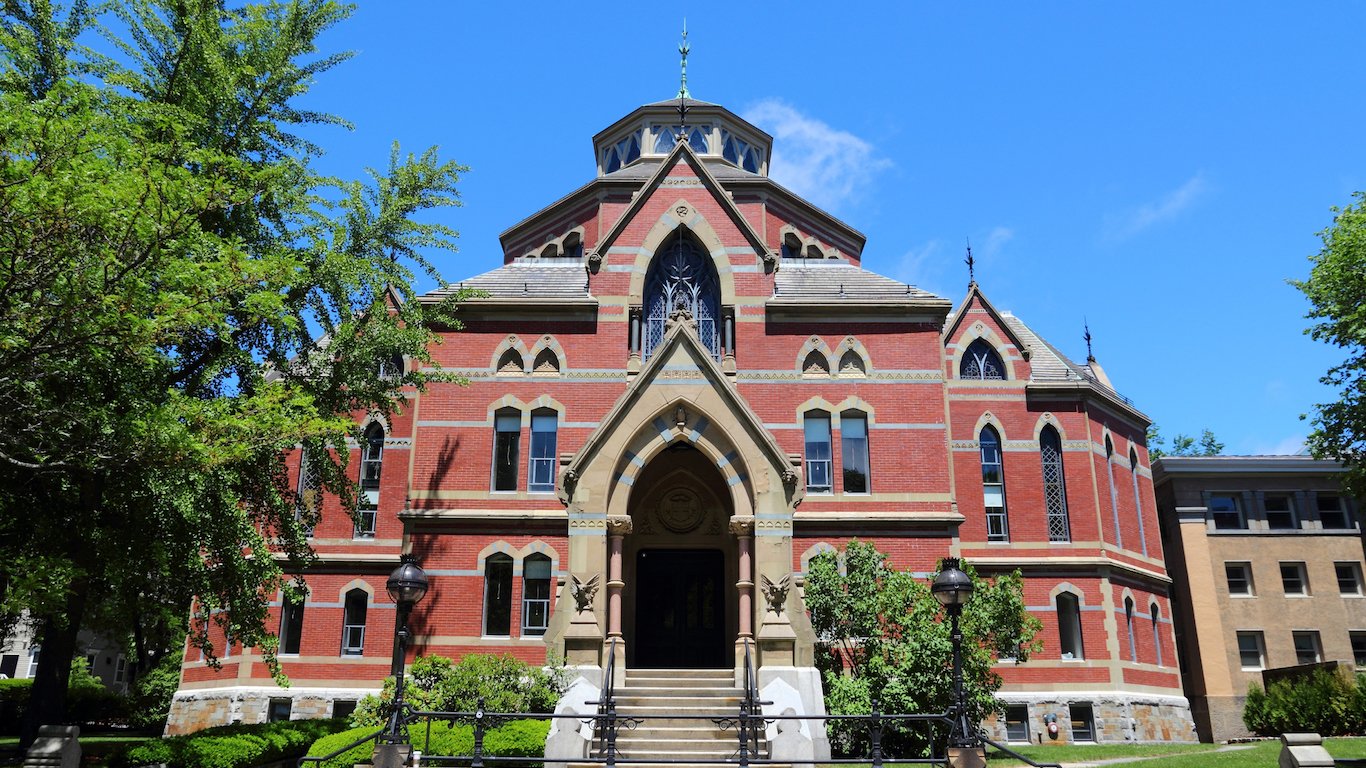
10. Rhode Island
> Overall grade: C+
> Per pupil spending: $14,601 (9th highest)
> High school graduation rate: 83.2% (22nd lowest)
> Pct. 3 & 4 yr. olds enrolled in preschool: 45.6% (22nd highest)
Rhode Island is one of only two New England states to earn less than a B grade from Education Week. Though it trails its neighbors, Rhode Island still ranks far better than most U.S. states.
Rhode Island received the best marks in its public school financing. The state allocates 3.8% of its taxable resources to education, one of the higher shares in the country. Partially as a result, every school district spends more than the national average on a per pupil basis. Higher spending is no guarantee of better academic performance, however, and fourth and eighth graders in Rhode Island are less likely to be proficient in math than their counterparts nationwide.
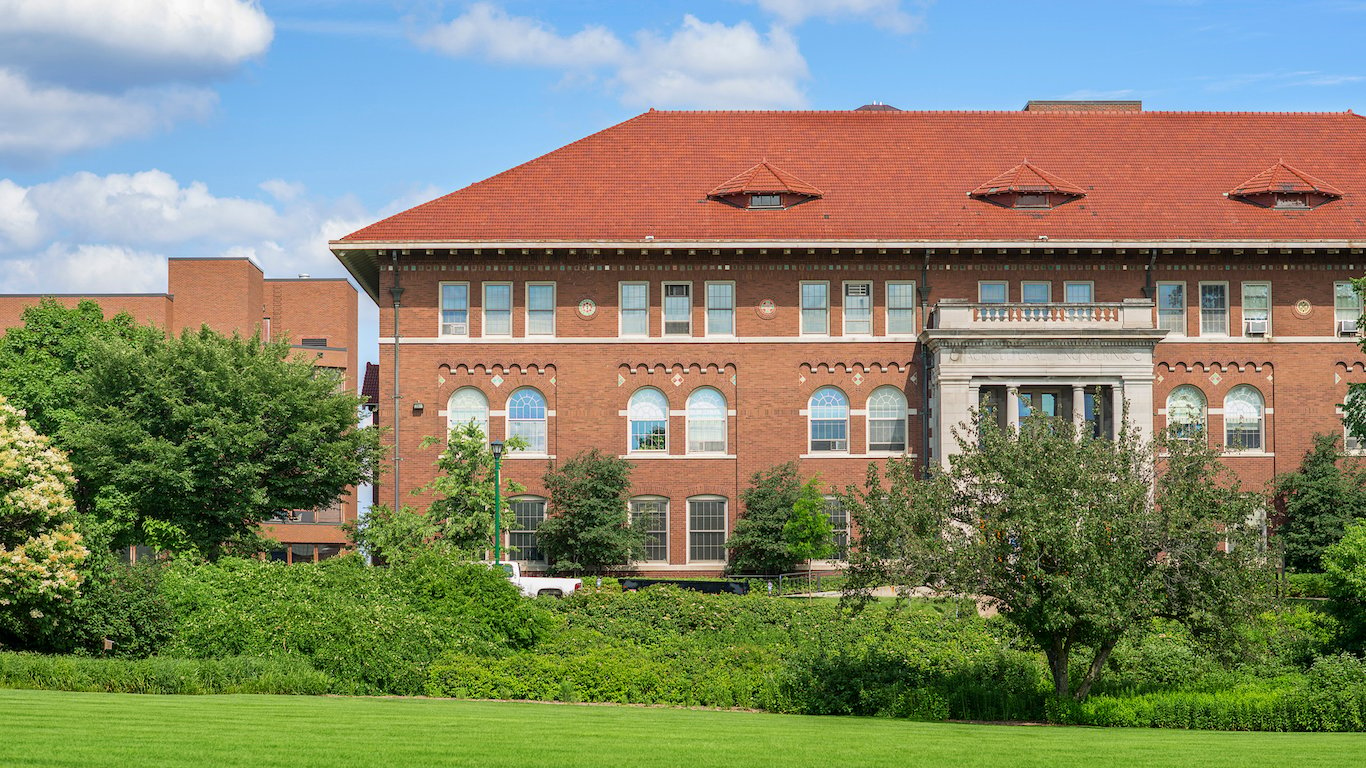
11. Minnesota
> Overall grade: C+
> Per pupil spending: $12,278 (22nd highest)
> High school graduation rate: 81.9% (19th lowest)
> Pct. 3 & 4 yr. olds enrolled in preschool: 45.6% (22nd highest)
Minnesota has one of the best statewide school systems in the nation. Most education researchers agree that children of parents with college degrees have a higher chance of succeeding in public school systems. These families tend to have both higher incomes and more parental involvement. In Minnesota, 63% of children have at least one parent with a postsecondary degree, the third highest percentage of all states. State households, with a median income of $63,488 a year, are among the wealthier in the country.
Public school students in Minnesota, whether due to greater resources at home or their higher-income school districts, also perform better on standardized tests. The percentages of fourth and eighth graders who are proficient in mathematics, at 53.4% and 47.8%, are each the second highest of all states.
[in-text-ad]
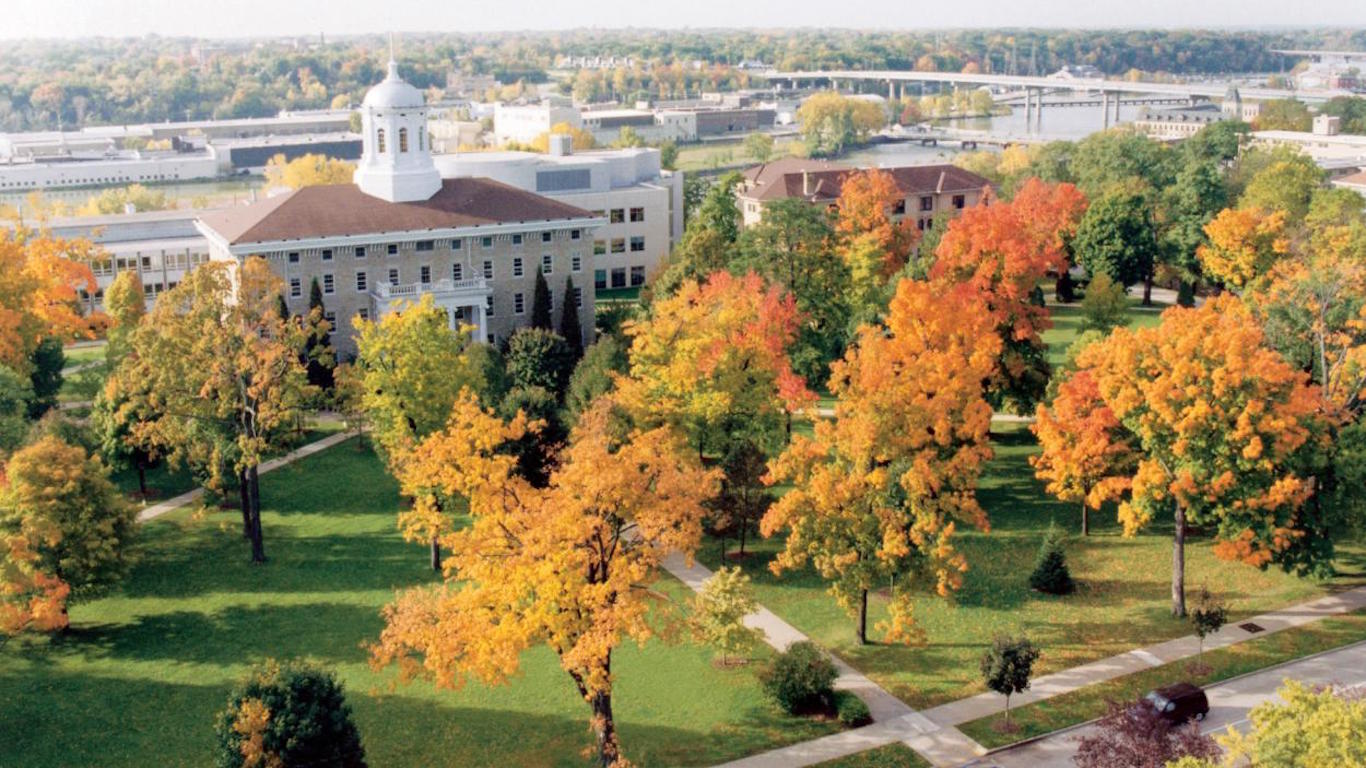
12. Wisconsin
> Overall grade: C+
> Per pupil spending: $12,206 (24th highest)
> High school graduation rate: 88.4% (6th highest)
> Pct. 3 & 4 yr. olds enrolled in preschool: 45.7% (20th highest)
In Education Week’s Quality Counts report, Wisconsin receives a C+, a slightly better grade than the nation as a whole. The state compares favorably to most states in several metrics, including graduation rates and core competency. While nationwide the high school graduation rate is 83.2%, it is 88.4% in Wisconsin, the sixth highest share among states. Wisconsin’s public school fourth and eighth graders are also more likely to be proficient in both math and reading than their counterparts nationwide.

13. Maine
> Overall grade: C+
> Per pupil spending: $15,193 (8th highest)
> High school graduation rate: 87.5% (12th highest)
> Pct. 3 & 4 yr. olds enrolled in preschool: 41.1% (16th lowest)
Maine’s school system appears to have improved at a faster rate than school systems in most other states. The state has a graduation rate of 87.5%, compared to the U.S.-wide graduation rate of 83.2%. While raw expenditure per student is not a guarantee of a quality education, school systems that spend more on students tend to have better outcomes. Maine’s system spends $15,193 a year per pupil, the eighth highest among states.

14. Virginia
> Overall grade: C+
> Per pupil spending: $10,078 (16th lowest)
> High school graduation rate: 85.7% (20th highest)
> Pct. 3 & 4 yr. olds enrolled in preschool: 47.1% (19th highest)
Students from wealthier, more educated families are more likely to be successful in school. Students are particularly poised for academic success in Virginia, where 56.9% of children have at least one parent with a college degree, far more than the 48.8% national figure. Similarly, the typical household in Virginia earns $66,262 a year, about $10,500 more than the national median household income.
Virginia’s students outperform many of their peers nationwide in a number of academic measures. An estimated 47.3% of fourth graders and 37.6% of eighth graders in the state are proficient in math, compared to 39.4% of fourth and 32.1% of eighth graders nationwide. In high school, 47.4% of advanced placement tests taken by 11th and 12th graders earn a 3 or above, the largest share of any state other than Maryland.
[in-text-ad-2]
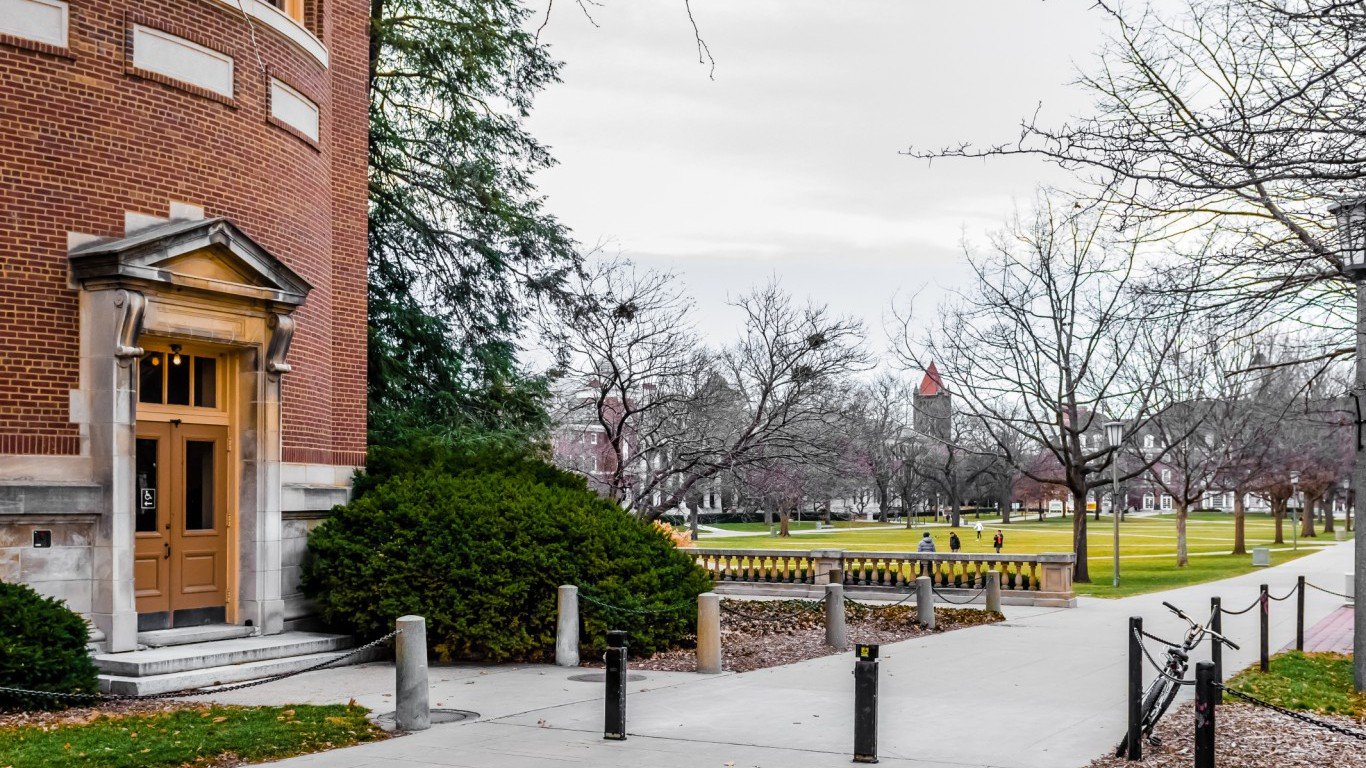
15. Illinois
> Overall grade: C+
> Per pupil spending: $12,753 (19th highest)
> High school graduation rate: 85.6% (22nd highest)
> Pct. 3 & 4 yr. olds enrolled in preschool: 53.4% (6th highest)
With an overall grade of C+, Illinois’ education system rates slightly better than that of the United States as a whole, which earned a C grade from Education Week’s Quality Counts 2017 survey. The state scores average or better than average in important measures. For example, Illinois has a preschool enrollment rate of 53.4%, which is sixth highest among states. Close to 35% of advanced placement tests taken in Illinois score a 3 or better, the ninth best share among states.
While wealthier districts nationwide tend to have higher revenues than poorer districts, Illinois’ low-income districts are even more poorly funded relative to the wealthiest districts than in other parts of the country.
16. North Dakota
> Overall grade: C+
> Per pupil spending: $13,513 (15th highest)
> High school graduation rate: 86.6% (17th highest)
> Pct. 3 & 4 yr. olds enrolled in preschool: 34.7% (4th lowest)
Preschool-age children have been shown to be much more susceptible to learning new information than their peers even a year or two older. Education policymakers point to this evidence as proof of the importance of preschool on a child’s development. In North Dakota, however, barely a third of three- and four-year old children are enrolled in preschool, compared to close to half of that age group nationwide. North Dakota also has one of the lowest kindergarten enrollment rates of any state.
Despite the low enrollment in early childhood education, the state’s high school graduation rate of 86.6% is above the national rate of 83.2%. Additionally, a very high share of students in the state have wealthy, educated families.
[in-text-ad]

17. Iowa
> Overall grade: C
> Per pupil spending: $12,689 (20th highest)
> High school graduation rate: 90.8% (the highest)
> Pct. 3 & 4 yr. olds enrolled in preschool: 48.5% (16th highest)
The quality of a school system can have a major impact on a student’s education and eventual career success. However, it is by no means the only factor influencing education outcomes. A student’s home environment can make a big difference. Students with at least one college educated parent are much more likely to be successful in school than those without. In Iowa, 58.4% of children have at least one parent with a postsecondary degree, sixth most among all states. Iowa also has the highest graduation rate in the country, with 90.8% of the state’s high school class of 2014-2015 graduating on time, compared to a national graduation rate of 83.2%.
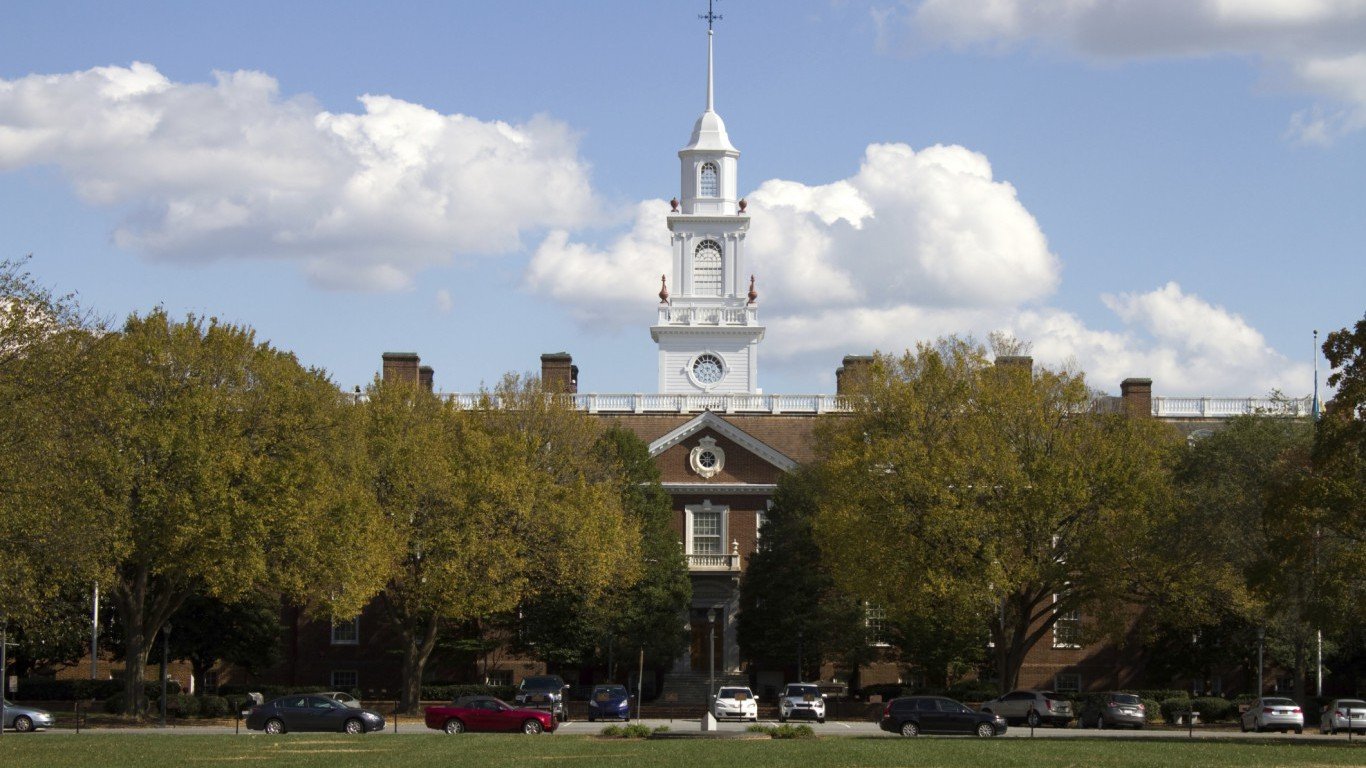
18. Delaware
> Overall grade: C
> Per pupil spending: $13,895 (13th highest)
> High school graduation rate: 85.6% (22nd highest)
> Pct. 3 & 4 yr. olds enrolled in preschool: 47.3% (18th highest)
Delaware’s education system is notable for a relatively equal distribution of funds across its districts. Not only are Delaware schools fairly well funded, but also 91.6% of all students attend school in districts where per-pupil spending is above the U.S. average. Overall, state schools spend $13,895 per student on average, roughly $1,700 more than the nationwide per-pupil spending of $12,156.
Despite above average funding, Delaware students underperform students nationwide in many tests. An estimated 36.8% of fourth graders and 29.5% of eighth graders are proficient in mathematics, smaller shares than the 39.4% of fourth graders and 32.1% of eighth graders nationwide. Delaware is also one of just a handful of states in which reading scores among fourth and eighth graders have worsened over the past decade.

19. Nebraska
> Overall grade: C
> Per pupil spending: $13,982 (12th highest)
> High school graduation rate: 88.9% (5th highest)
> Pct. 3 & 4 yr. olds enrolled in preschool: 40.7% (15th lowest)
Nebraska has a near nation-leading 88.9% high school graduation rate, compared to the nationwide rate of 83.2%. While the state has a high rate of students successfully completing high school, it has a relatively low share of children getting a jumpstart on their education. Only 40.7% of three- and four-year olds are enrolled in preschool, compared to a national share of 47.0%. Similarly, just 71.1% of kindergarten-eligible children are enrolled, the second-lowest share of all states and well below the national share of 78.0%.
[in-text-ad-2]

20. Washington
> Overall grade: C
> Per pupil spending: $9,908 (14th lowest)
> High school graduation rate: 78.2% (10th lowest)
> Pct. 3 & 4 yr. olds enrolled in preschool: 40.4% (13th lowest)
Children from wealthier, more educated families are far more likely to do well in school than children who live in poverty, and many Washington students are well positioned for academic success. The typical Washington household earns $64,129 a year, roughly $8,400 more than the national median household income of $55,775. Additionally, 45% of Washington working-age adults have a college degree, a larger share than in a majority of states.
Washington’s students tend to do better than their peers on national standardized tests. An estimated 46.9% of fourth graders and 39.3% of eighth graders in the state test proficient in math, each the seventh largest share nationwide. Additionally, 40.4% of fourth graders and 37.4% of eighth graders tested as proficient in reading, each among the larger shares in the country.

21. Indiana
> Overall grade: C
> Per pupil spending: $11,087 (21st lowest)
> High school graduation rate: 87.1% (15th highest)
> Pct. 3 & 4 yr. olds enrolled in preschool: 39.0% (9th lowest)
Indiana’s per-pupil expenditure of $11,087 a year, and median household income of $50,532 a year are each lower than the respective national amounts of $12,156 and $55,775. School funding and family wealth can be reliable predictors of student achievement. However, Indiana is one of just a handful of states where per-pupil spending and household income are below average, yet students score better on standardized tests than their peers in most other states. Fourth and eighth grade students in Indiana are far more likely to score well on reading and mathematics proficiency exams than those in most other states.
[in-text-ad]

22. Ohio
> Overall grade: C
> Per pupil spending: $12,208 (23rd highest)
> High school graduation rate: 80.7% (17th lowest)
> Pct. 3 & 4 yr. olds enrolled in preschool: 45.2% (24th highest)
With an overall score of C on Education Week’s Quality Counts report, the Ohio school system is fairly average in comparison to the country as a whole. Schools in the state spend an average of $12,208 per student a year, roughly in line with the $12,156 per-pupil expenditure nationwide. Funding is fairly equal across the state, and 36.9% of students attend school in districts with above average per-pupil expenditure, roughly the same as the 38.6% national figure.
Students living with wealthy, educated, English-speaking parents are often more likely succeed academically than those without. One of Ohio’s notable demographic features is that only 4.7% of children have parents who do not speak fluent English, compared to 16.9% nationwide.
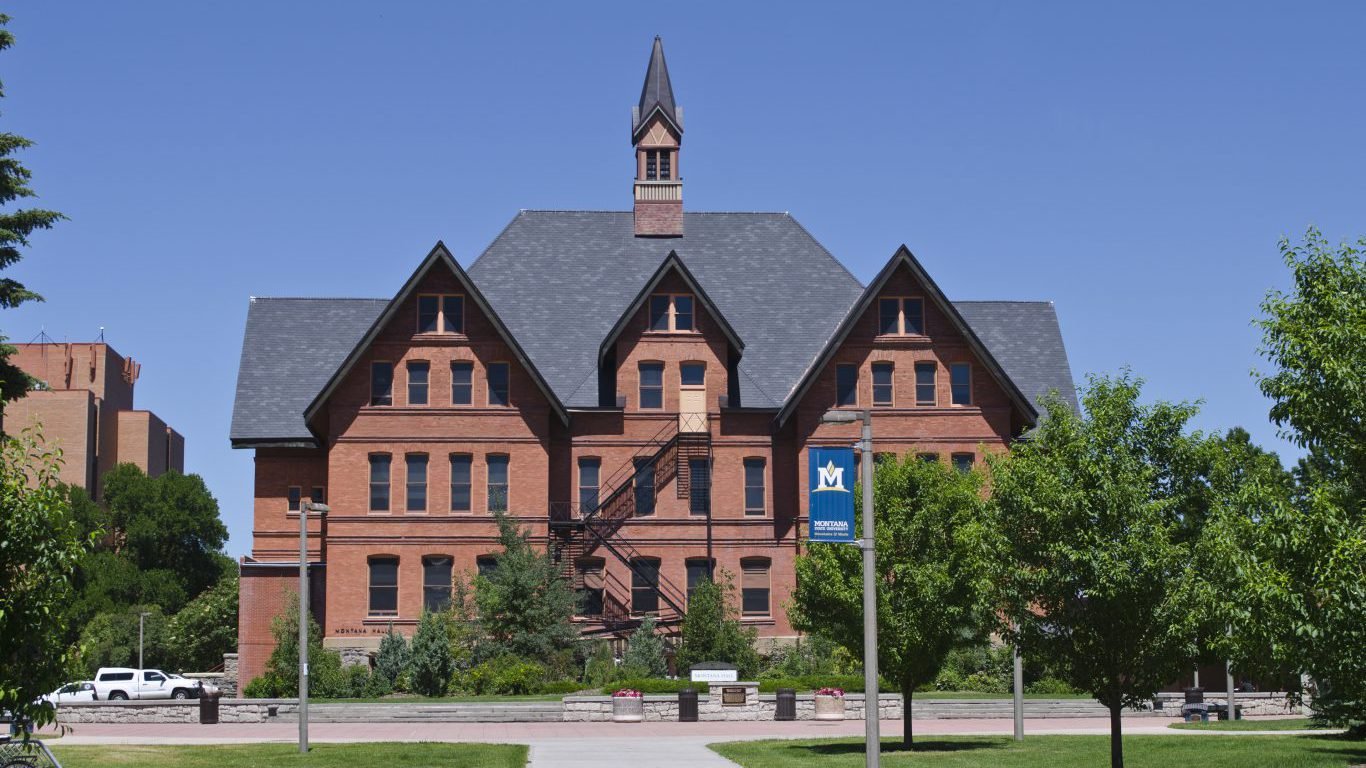
23. Montana
> Overall grade: C
> Per pupil spending: $13,800 (14th highest)
> High school graduation rate: 86.0% (19th highest)
> Pct. 3 & 4 yr. olds enrolled in preschool: 37.0% (5th lowest)
Early childhood education — kindergarten and pre-K — can be valuable to cognitive development. It can also help fight some of the disadvantages faced by children in low-income families. Montana has very low enrollment rates for both. Just 37.0% of Montana’s preschool-age children and 73.4% of kindergarten-eligible children are enrolled in the respective systems, each the fifth lowest share in the country.
State children may be more likely to get the help and support they need at home when they do start school. About 60% of Montana’s students have at least one parent with a college degree, the 10th highest share among states.

24. Alaska
> Overall grade: C
> Per pupil spending: $19,000 (2nd highest)
> High school graduation rate: 75.6% (5th lowest)
> Pct. 3 & 4 yr. olds enrolled in preschool: 37.7% (8th lowest)
More is spent on education per student in Alaska than in every other state except for Vermont. State schools spend $19,000 per student per year, far higher than the $12,156 average expenditure nationwide. Because of the state’s climate and vast size, transportation and facility costs are high, largely explaining the state’s high per-pupil school spending.
In Alaska, fourth grade students are far less likely to be proficient in math and reading than fourth graders nationwide. Though this achievement gap in reading and math improves significantly by eighth grade, students in Alaska are still less likely to be proficient in the subjects than students nationwide.
[in-text-ad-2]
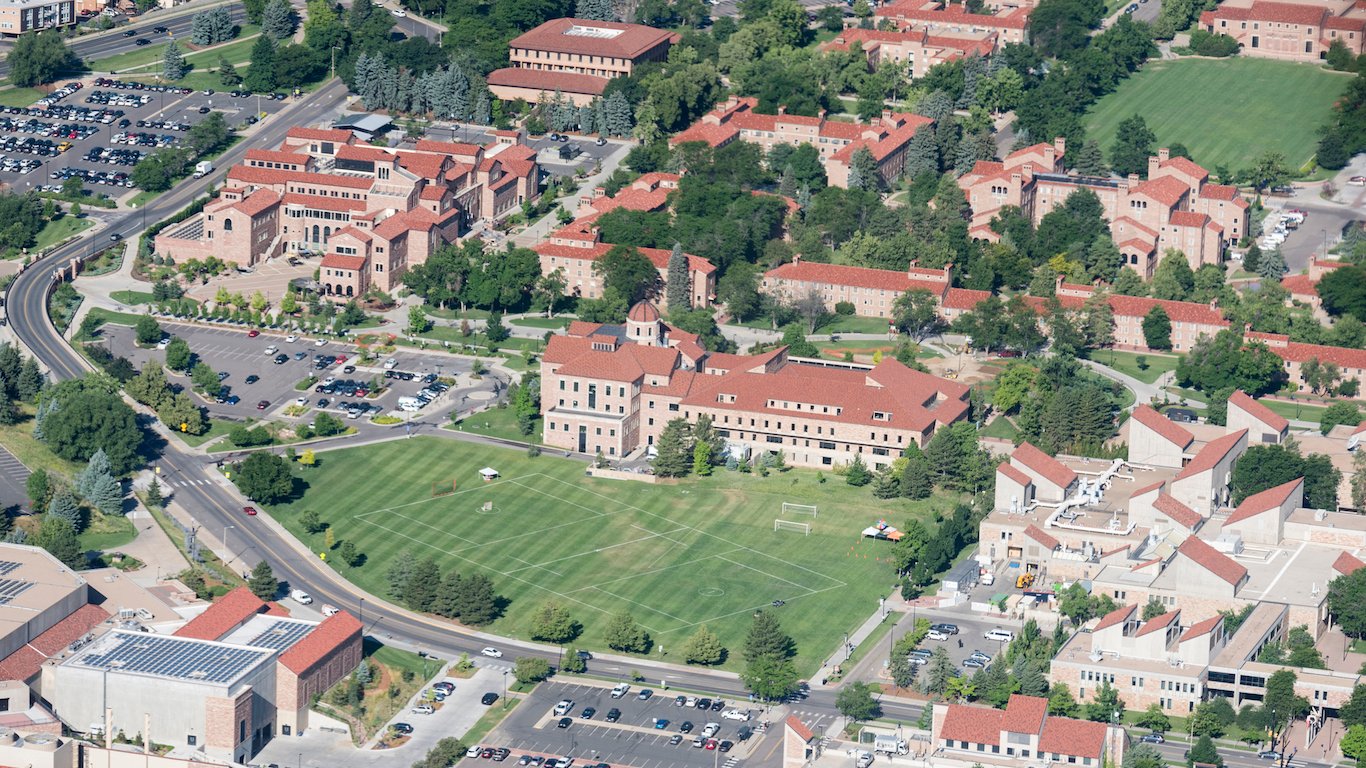
25. Colorado
> Overall grade: C
> Per pupil spending: $9,471 (11th lowest)
> High school graduation rate: 77.3% (6th lowest)
> Pct. 3 & 4 yr. olds enrolled in preschool: 52.6% (8th highest)
Children whose parents have a higher education are more likely to succeed academically. While less than half of children nationwide have at least one parent with a college degree, 57.3% of Colorado children have at least one college-educated parent. Spending more on students does not guarantee a quality education, but states where less is spent per student tend to have worse educational outcomes. Colorado allocates relatively little to its students compared to other states. Total per-pupil expenditure in the state comes to $9,471 per year, compared to the national per-pupil expenditure of $12,156.
Educational outcomes in Colorado are mixed. More than a third of all 11th and 12th grade advanced placement test results in the state are high enough to earn college credit, far more than the 29% national average. While some students are high achieving, a relatively large share are not. Colorado’s 77.3% graduation rate is one of the lowest in the country.

26. Hawaii
> Overall grade: C
> Per pupil spending: $13,100 (16th highest)
> High school graduation rate: 81.6% (18th lowest)
> Pct. 3 & 4 yr. olds enrolled in preschool: 49.5% (13th highest)
With only one school district, the Hawaii Department of Education is the only statewide public education system in the United States with no smaller governing bodies. Hawaii also does not use property taxes to fund public education. Nevertheless, Hawaii spends an average of $13,100 per student on education annually, roughly $1,000 more than the national per-pupil expenditure of $12,156.
Children from wealthy, educated homes tend to be more academically successful than children living in poverty. While Hawaii’s $73,486 median annual household income is the second highest in the country, students in the state fall short in some measures of academic ability. Just 29.1% of fourth graders and 25.7% of eighth graders in Hawaii are proficient in reading, among the smallest shares of any state.
[in-text-ad]
27. Kansas
> Overall grade: C
> Per pupil spending: $11,628 (25th lowest)
> High school graduation rate: 85.7% (20th highest)
> Pct. 3 & 4 yr. olds enrolled in preschool: 43.6% (23rd lowest)
By most measures, the health of the Kansas public school system is average compared with other states. In other measures, however, it stands out as either considerably better, or struggling. While the most recent cohort of seniors in Kansas reported a modest graduation rate of 85.7%, for example, the state’s graduation rate rose by 11.9 percentage points over the 10 years through 2012, seventh best improvement of all states. By contrast, the national high school graduation rate improved by 8.4 percentage points over that period.
On the other hand, standardized test scores in Kansas schools are not improving. Math and reading proficiency among fourth and eighth grade students is slightly better than average. But between 2003 and 2015, fourth and eighth grade math scores worsened — making Kansas one of only a few states to post a decline.
28. Kentucky
> Overall grade: C
> Per pupil spending: $10,560 (17th lowest)
> High school graduation rate: 88.0% (8th highest)
> Pct. 3 & 4 yr. olds enrolled in preschool: 40.3% (12th lowest)
Kentucky’s education system has begun reporting more favorable outcomes in recent years. The state’s high school graduation rate has improved by 12.2 percentage points between 2002 and 2012, better than the 8.4 percentage points increase in the national graduation rate. Among seniors for the 2014-2015 school year, 88% graduated on time, the eighth highest proportion among states. Kentucky’s school system spends $10,560 per student, less than in most states and about $1,600 less than the national per-pupil expenditure. Spending is relatively evenly distributed between districts, however, as the state has one of the smallest gaps between per pupil expenditures at the highest and lowest spending districts.

29. Florida
> Overall grade: C
> Per pupil spending: $9,585 (12th lowest)
> High school graduation rate: 77.9% (9th lowest)
> Pct. 3 & 4 yr. olds enrolled in preschool: 50.8% (9th highest)
Florida’s school system spends an average of just $9,585 per student annually, roughly $2,600 less than the national per-pupil expenditure of $12,156. Though spending is low, it is relatively evenly distributed. The difference in per-pupil spending between the highest and lowest spending districts is the second smallest funding gap of any state.
Over the past two decades, Florida has implemented significant education reform. What followed were some of the best improvements in test scores in the country. Between 2003 and 2015, reading test results among fourth graders increased more in Florida than in all but two other states. There has also been a dramatic increase in the share of students who take advanced placement classes, as well as in the proportion of students scoring well on advanced placement exams. Today, both are among the highest such percentages in the nation.
[in-text-ad-2]
30. Missouri
> Overall grade: C-
> Per pupil spending: $11,226 (22nd lowest)
> High school graduation rate: 87.8% (10th highest)
> Pct. 3 & 4 yr. olds enrolled in preschool: 44.6% (25th lowest)
Not an especially wealthy state, the typical Missouri household earns $50,238 a year, about $5,500 less than the national median income. Lower incomes often mean lower property values, which can translate to lower property tax revenues — revenues which are used to fund Missouri schools. Possibly as a result, Missouri spends less annually per student than the majority of states. About 89% of students in the state live in districts where per pupil spending is below the national average of $12,156 a year.
The relationship between spending and educational outcomes is a matter for debate, and in Missouri, academic achievement outcomes are mixed. Both fourth and eighth graders in the state are more likely to be proficient in reading than the typical American student. However, the same cohorts are slightly less likely to be proficient in math.
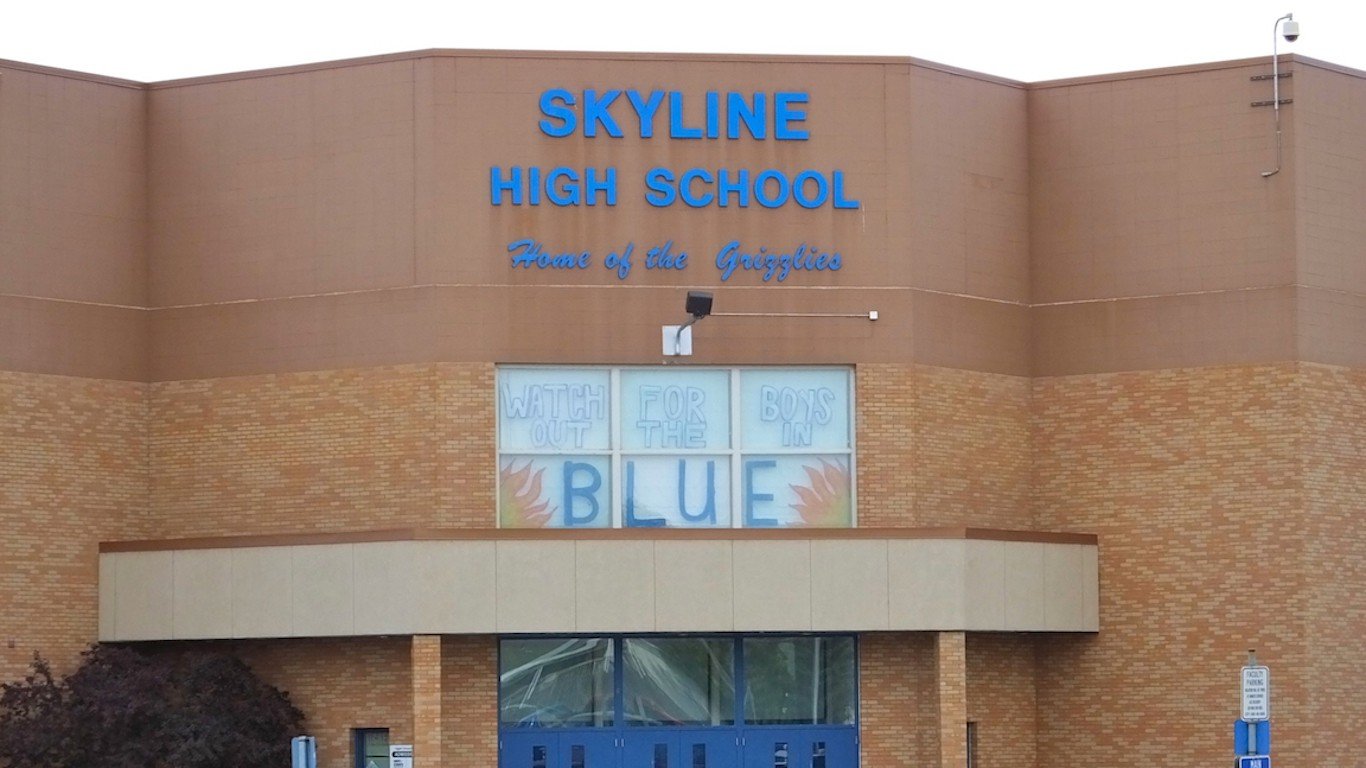
31. Utah
> Overall grade: C-
> Per pupil spending: $7,038 (the lowest)
> High school graduation rate: 84.8% (25th lowest)
> Pct. 3 & 4 yr. olds enrolled in preschool: 43.1% (21st lowest)
There are an average of 3.17 people per household in Utah, the most of any state. With so many children per parent in Utah, the state has relatively few taxpayers per student. School systems in Utah spend an average of $7,038 per pupil, the least of any state. Not even 2% of students attend school in districts with above average per-pupil expenditure, compared to 39% of students nationwide.
Despite low funding, Utah students outperform most states in a variety of measures of academic achievement. An estimated 40.1% of fourth graders and 38.0% of eighth graders are proficient in reading, compared to 34.8% of fourth and 32.7% of of eighth graders nationwide.
[in-text-ad]
32. Georgia
> Overall grade: C-
> Per pupil spending: $9,403 (9th lowest)
> High school graduation rate: 78.8% (11th lowest)
> Pct. 3 & 4 yr. olds enrolled in preschool: 49.7% (12th highest)
Preschool and kindergarten can be vital to cognitive development, and Georgia’s children are more likely to be enrolled in both than those in the majority of states. An above-average share of three- and four-year olds attend preschool in the state, and about 80% of five- and six-year olds attend kindergarten, the fourth highest share of all states.
While a large share of children get a jumpstart on school, a relatively small number of students actually finish school on time. Just 78.8% of the senior class of 2014-2015 graduated on time, 11th worst among all states.

33. Michigan
> Overall grade: C-
> Per pupil spending: $12,440 (21st highest)
> High school graduation rate: 79.8% (15th lowest)
> Pct. 3 & 4 yr. olds enrolled in preschool: 45.7% (20th highest)
Michigan’s school system spends an average of $12,440 per student annually, in line with the national per-pupil expenditure of $12,156 across all states. While Michigan’s education expenditure closely matches that of the nation as a whole, the academic performance of the state’s students has fallen over the past decade and remains lower than in most of the country.
In just five states, including Michigan, the standardized reading test scores among fourth graders fell between 2003 and 2015. Similarly, Michigan is one of only three states where standardized eighth grade math scores did not improve over the same time period. Today, an estimated 28.6% of Michigan fourth graders are considered proficient in reading, and 34.0% are proficient in math — both among the smallest shares of any state.
34. West Virginia
> Overall grade: C-
> Per pupil spending: $13,075 (17th highest)
> High school graduation rate: 86.5% (18th highest)
> Pct. 3 & 4 yr. olds enrolled in preschool: 34.1% (3rd lowest)
West Virginia’s school system spends $13,075 per student annually, or about $900 more than the national average expenditure. Further, school spending per student is relatively evenly distributed across all districts. However, above average spending alone does not necessarily translate to better outcomes. The shares of fourth and eighth graders receiving proficient scores on math and reading exams are each among the lowest of any state.
There are a number of factors working against West Virginia’s students. Students with higher-income parents who have a college education are more likely to be successful in school than those without. In West Virginia, just 38.0% of children have at least one parent with a postsecondary degree, compared to 48.8% of children nationwide. Similarly, only 68.7% have at least one parent who works full time, year round, compared to 75.4% of all children nationwide.
[in-text-ad-2]
35. Tennessee
> Overall grade: C-
> Per pupil spending: $9,421 (10th lowest)
> High school graduation rate: 87.9% (9th highest)
> Pct. 3 & 4 yr. olds enrolled in preschool: 37.6% (7th lowest)
Tennessee’s school system is one of the most poorly funded in the country. The state allocates only 2.7% of taxable resources to education, one of the smallest shares of any state. Partially as a result, annual per-pupil spending in the state is only $9,421, well below the $12,156 national average expenditure.
Despite minimal public school investment, Tennessee’s graduation rate is better than in most states. The state’s 88% graduation rate is nearly 5 percentage points higher than the national graduation rate. Tennessee’s graduation rate increased by 23.4 percentage points between 2002 and 2012, the greatest improvement of any state in the country.
36. South Carolina
> Overall grade: C-
> Per pupil spending: $10,909 (19th lowest)
> High school graduation rate: 80.3% (16th lowest)
> Pct. 3 & 4 yr. olds enrolled in preschool: 44.2% (24th lowest)
South Carolina’s school system spends 4% of its taxable resources on education, considerably more than is typical. Despite allocating a larger share of tax dollars to education, the $10,909 average per pupil spending in the state is still below the $12,156 national average. The lower per-pupil spending is largely explained by the state’s weaker than average tax base. The typical South Carolina household earns only $47,238 a year, well below the $55,775 national median income. Lower incomes often translate to lower property values and lower property taxes, the revenue from which much of the school system derives its budget.
Throughout nearly every age range, students in South Carolina lag behind their peers nationwide in some measures of academic achievement. Fourth and eighth graders in the state are less likely to be proficient in math and reading than the typical American student in that age group, and 11th and 12th graders in South Carolina are less likely outperform their counterparts in many other states on advanced placement exams.
[in-text-ad]
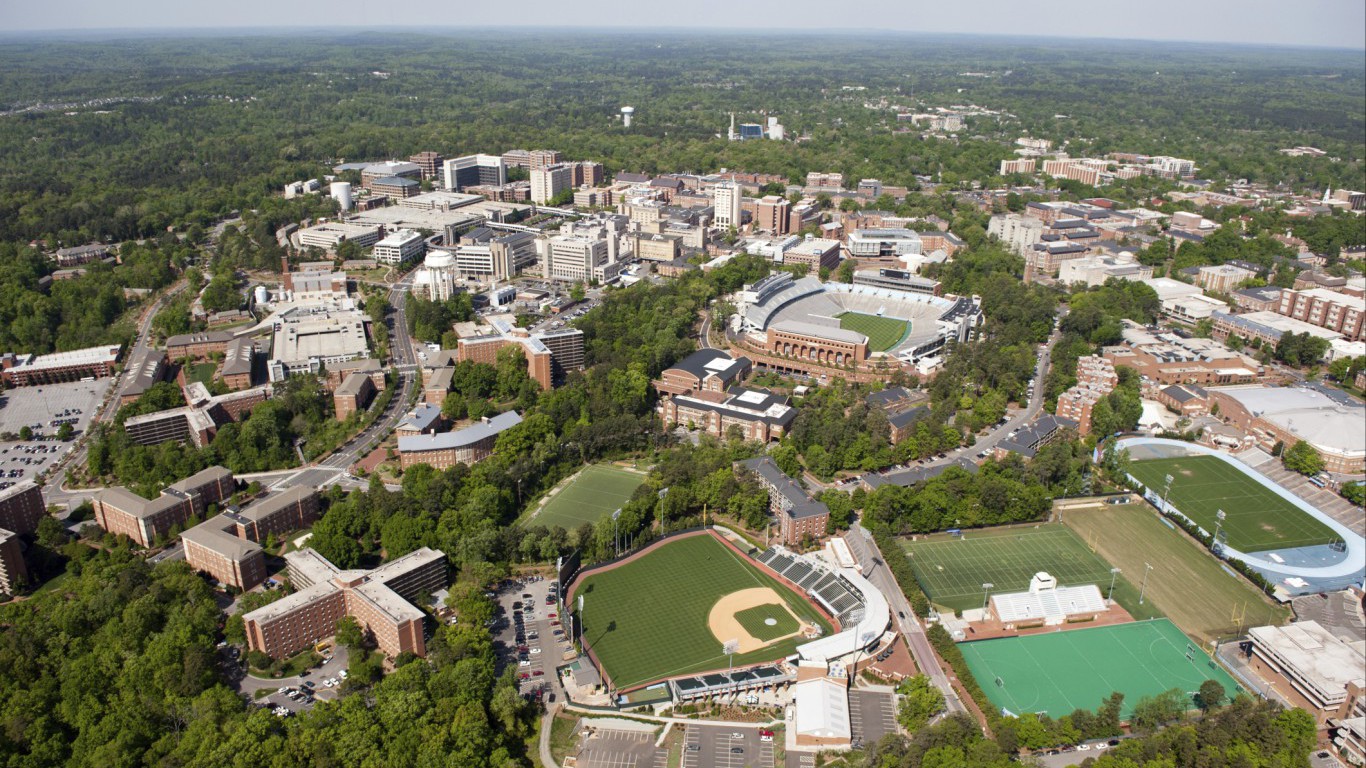
37. North Carolina
> Overall grade: C-
> Per pupil spending: $9,004 (8th lowest)
> High school graduation rate: 85.6% (22nd highest)
> Pct. 3 & 4 yr. olds enrolled in preschool: 42.9% (19th lowest)
Fourth graders in North Carolina outperform fourth graders in a majority of states on standardized math and reading exams. Some 44.4% of North Carolina fourth graders test as proficient in math, and 38.5% are proficient in reading. By comparison, 39.4% of fourth graders nationwide are proficient in math, and 34.8% in reading. Still, 10-year improvement in standardized reading and math test scores in the Tar Heel State trails the national average improvement.
Since the GOP took control of the state government in 2010, North Carolina has enacted comprehensive education system reform while also cutting the education budget. Today, the state spends just 2.5% of taxable resources on education, less than any state other than North Dakota. Additionally, the roughly $9,000 per-pupil spending is about $3,200 less than the national average.

38. South Dakota
> Overall grade: C-
> Per pupil spending: $11,287 (23rd lowest)
> High school graduation rate: 83.9% (23rd lowest)
> Pct. 3 & 4 yr. olds enrolled in preschool: 40.2% (10th lowest)
The quality of a state’s education system can affect a student’s chances of success, as can a student’s home environment. Students who grow up in more affluent households with college-educated parents are more likely to excel. South Dakota’s children are among the most likely in the country to have parents who work full time, year round and have a college education. They are also more likely than children in most states to be financially secure.
Despite these advantages, the state’s student achievement records are subpar. Between 2003 and 2015, fourth grade math scores improved slower than the nation while fourth grade reading scores in the state went down. South Dakota is also the only state where the share of eighth graders proficient in math and the share proficient in reading each declined in the last decade.

39. Oregon
> Overall grade: C-
> Per pupil spending: $10,963 (20th lowest)
> High school graduation rate: 73.8% (3rd lowest)
> Pct. 3 & 4 yr. olds enrolled in preschool: 43.1% (21st lowest)
Academic achievement among Oregon’s younger public school students lags behind that of their peers across the country. Of Oregon’s fourth graders, 37.1% are proficient in math and 33.9% in reading, slightly below the corresponding 39.4% and 34.8% national shares. However, by eighth grade, Oregon’s public school students have more than made up the lost ground. Of the state’s eighth graders, 33.7% are proficient in math and 35.7% in reading, slightly higher than the comparable 32.1% and 32.7% national shares.
Despite the larger than typical share of eighth grade Oregon students able to grasp fundamental academic concepts, the state’s graduation rate is among the worst in the country. At 73.8%, Oregon’s graduation rate is the third lowest of all states and well below the 83.2% national graduation rate.
[in-text-ad-2]
40. Texas
> Overall grade: C-
> Per pupil spending: $8,265 (4th lowest)
> High school graduation rate: 89.0% (4th highest)
> Pct. 3 & 4 yr. olds enrolled in preschool: 41.9% (17th lowest)
A relatively large share of students in Texas face additional academic challenges beyond what many of their peers nationwide face. Only 72.3% of children in Texas are raised by fluent English speakers, well below the 83.1% national share. The state’s students raised in non-English speaking households are more likely to struggle academically. They may also place an additional burden on Texas’ education budget by necessitating ESL instruction.
Additional financial burdens may meaningfully impact students in the Lone Star State as Texas schools are among the most poorly funded in the country. The state education system allocates only 2.9% of taxable resources to schools, less than the 3.3% average across all states. Also, only 8.2% of Texas students live in districts that receive greater per-pupil funding than the $12,592 national average.

41. California
> Overall grade: C-
> Per pupil spending: $8,694 (6th lowest)
> High school graduation rate: 82.0% (20th lowest)
> Pct. 3 & 4 yr. olds enrolled in preschool: 48.3% (17th highest)
Only about 64% of children in California are raised by English-speaking households, the smallest share of any state in the country. The disproportionate number of students raised speaking a foreign language likely adds additional barriers to academic performance, especially in earlier years. California ranks very low in certain fourth grade benchmarks. Only 29.2% of California fourth graders are proficient in math and 27.8% are proficient in reading, each the third lowest share of any state in the country.
However, older, high-achieving students in California tend to do better than their counterparts nationwide. Of all 11th and 12th grade advanced placement test scores in the state, 35.3% are high enough to earn college credit, a larger share than the 29.3% national average.
[in-text-ad]
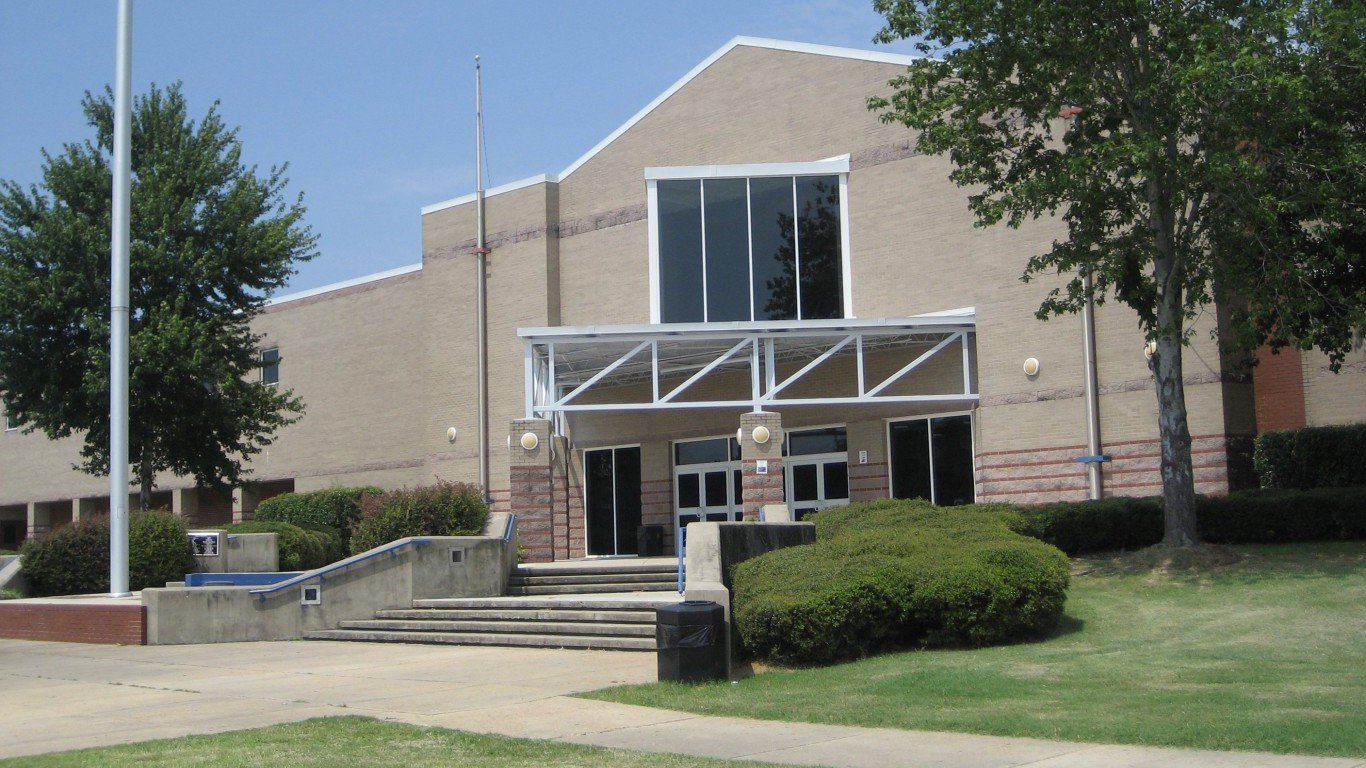
42. Arkansas
> Overall grade: C-
> Per pupil spending: $11,587 (24th lowest)
> High school graduation rate: 84.9% (25th highest)
> Pct. 3 & 4 yr. olds enrolled in preschool: 49.1% (14th highest)
Because household incomes play such a large role in the health of school systems and student performance, the low incomes in Arkansas largely explain the state school system’s low ranking. The typical Arkansas household earns $41,995 annually, second lowest after only Mississippi. With lower incomes come lower property values, which in turn yield lower property tax revenue — often the principal source of public school funding. Despite this, per-pupil expenditure in Arkansas, at $11,587, is only slightly below the nationwide average. This could be because the state spends a 3.8% share of taxable resources on education, unusually high compared with other poorly ranked state education systems.
Like other states on the low end of this list, however, Arkansas students are considerably less likely than their peers nationwide to achieve proficiency or advanced levels on standardized tests. For instance, while close to a third of eighth grade students nationwide are proficient in mathematics, less than one-quarter demonstrate mathematics proficiency in Arkansas.

43. Arizona
> Overall grade: D+
> Per pupil spending: $8,125 (3rd lowest)
> High school graduation rate: 77.4% (7th lowest)
> Pct. 3 & 4 yr. olds enrolled in preschool: 37.1% (6th lowest)
According to Education Week research, just as income disparities between states can explain the differences in state school systems, income gaps among students often mirror achievement differences.
Test results suggest the income-based achievement gap is especially problematic in Arizona. The difference in test scores between Arizona’s fourth grade students eligible for subsidized school lunch programs (a common approximation of financial need) and ineligible students is larger in Arizona than in any other state. Different test scores across Arizona fourth and eighth grade students of all income levels are slightly above average at best. Fewer than 30% of state fourth graders are proficient in reading, one of the lowest percentages nationwide.
44. Alabama
> Overall grade: D+
> Per pupil spending: $10,038 (15th lowest)
> High school graduation rate: 89.3% (3rd highest)
> Pct. 3 & 4 yr. olds enrolled in preschool: 42.4% (18th lowest)
Trailing most states in most education measures, Alabama’s school system was graded seventh worse of all states. Not all data, however, point to poor school performance. Alabama’s high school graduation rate of 89.3% is third highest. Similarly, over the decade through 2012, the state’s graduation rate increased by 12.9 percentage points, the fifth best.
Test scores in Alabama are also improving much faster than in most states. While this is a very good sign for the state, it is also generally the case in states where scores were low to begin with. And often, as is the case in Alabama, achievements remain relatively low despite the improvement. On the most recent round of standardized tests, just 26.1% of fourth graders and just 17.2% of eighth graders demonstrated proficiency in mathematics, each dead last compared with other states.
[in-text-ad-2]

45. Louisiana
> Overall grade: D+
> Per pupil spending: $11,774 (25th highest)
> High school graduation rate: 77.5% (8th lowest)
> Pct. 3 & 4 yr. olds enrolled in preschool: 50.1% (11th highest)
One of the best predictors of children’s future academic success is the education level of their parents. In Louisiana, just 38.2% of children have at least one parent with a college degree, the third lowest proportion of all states. Likely due in part to relatively low adult educational attainment, a large share of children live in low income households, which can hinder student development and achievement. Less than half of children in Louisiana grow up in families with incomes at least double the poverty level, close to the lowest such proportion in the nation.
Educational outcomes in Louisiana are not good. Only 29.6% of fourth graders in the state, and 17.9% of eighth graders, are proficient in math, each among the smallest share of any state in the country. In addition, 11th and 12th graders in Louisiana are far less likely to score well on advanced placement exams than their counterparts in the vast majority of other states.
46. Oklahoma
> Overall grade: D+
> Per pupil spending: $8,929 (7th lowest)
> High school graduation rate: 82.5% (21st lowest)
> Pct. 3 & 4 yr. olds enrolled in preschool: 43.2% (22nd lowest)
There is no consensus among researchers that higher education spending leads to better educational outcomes. While the relationship is complex, a certain amount of resources is needed to attract high quality teachers and provide adequate access to education technology such as computers, among other costly learning materials. This could explain the correlation between spending and outcomes across states.
Per-pupil spending in Oklahoma averages just $8,929 a year, the seventh lowest expenditure of all states. Like many other states with relatively low education expenditure, state students score poorly on standardized tests. Just 2.7% of eighth graders achieve advanced scores in math, nearly the worst standardized test performance of all states.
[in-text-ad]
47. Idaho
> Overall grade: D+
> Per pupil spending: $8,066 (2nd lowest)
> High school graduation rate: 78.9% (12th lowest)
> Pct. 3 & 4 yr. olds enrolled in preschool: 29.6% (the lowest)
In Idaho, annual education spending is $8,066 per student, the second lowest of all states after only Utah. According to Education Week researchers, a certain level of funding equity across school districts is critical to the health of a state’s education system. In a addition to low per pupil funding, education spending in Idaho is also poorly distributed across districts.
Preschool enrollment is often a positive experience for children, and can be especially beneficial to working mothers and low-income families. As such, it is a key component of a healthy state education system. In Idaho, less than 30% of three- and four-year-old children are enrolled in preschool, the lowest percentage of all states.

48. New Mexico
> Overall grade: D
> Per pupil spending: $10,714 (18th lowest)
> High school graduation rate: 68.6% (the lowest)
> Pct. 3 & 4 yr. olds enrolled in preschool: 40.7% (15th lowest)
New Mexico’s 68.6% high school graduation rate is the lowest rate of all states. Mirroring the poor graduation rate across the state, New Mexico’s standardized test scores also trail those of most states. For example, the percentage of fourth grade students who demonstrate proficiency in reading, at 22.9%, is also the lowest in the country. Nationwide, 34.8% of fourth grade students demonstrate reading proficiency. Such poor outcomes are likely at least partially tied to various socioeconomic factors. Because the source of school budgets is largely property tax revenue, low incomes can help explain low funding. New Mexico’s per pupil expenditure is below average, and the typical state household earns a modest $45,382 a year, sixth lowest compared with other states.
49. Mississippi
> Overall grade: D
> Per pupil spending: $9,656 (13th lowest)
> High school graduation rate: 75.4% (4th lowest)
> Pct. 3 & 4 yr. olds enrolled in preschool: 49.0% (15th highest)
Children from wealthier families are far more likely to attend well-funded schools, where for a variety of reasons the quality of education is often substantially higher than in poorer schools. With a median household income of $40,593 a year, Mississippi is the poorest state in the nation. State schools spend $9,656 per pupil annually, well below the national average per-pupil spending of $12,156. Further, just 1.7% of students attend school in districts that report spending levels that exceed the U.S. average, versus 38.6% of students across the nation. According to Education Week, the poverty gap between rich and poor Mississippi school districts, particularly for eighth graders, is getting worse, and faster than in the vast majority of states.
By many measures of achievement, students in Mississippi are trailing their counterparts across much of the country. For example, only 4.0% of advanced placement test scores among 11th and 12th graders in the state are high enough to earn college credit, the lowest share in the country, and well below the 29.3% national average.
[in-text-ad-2]
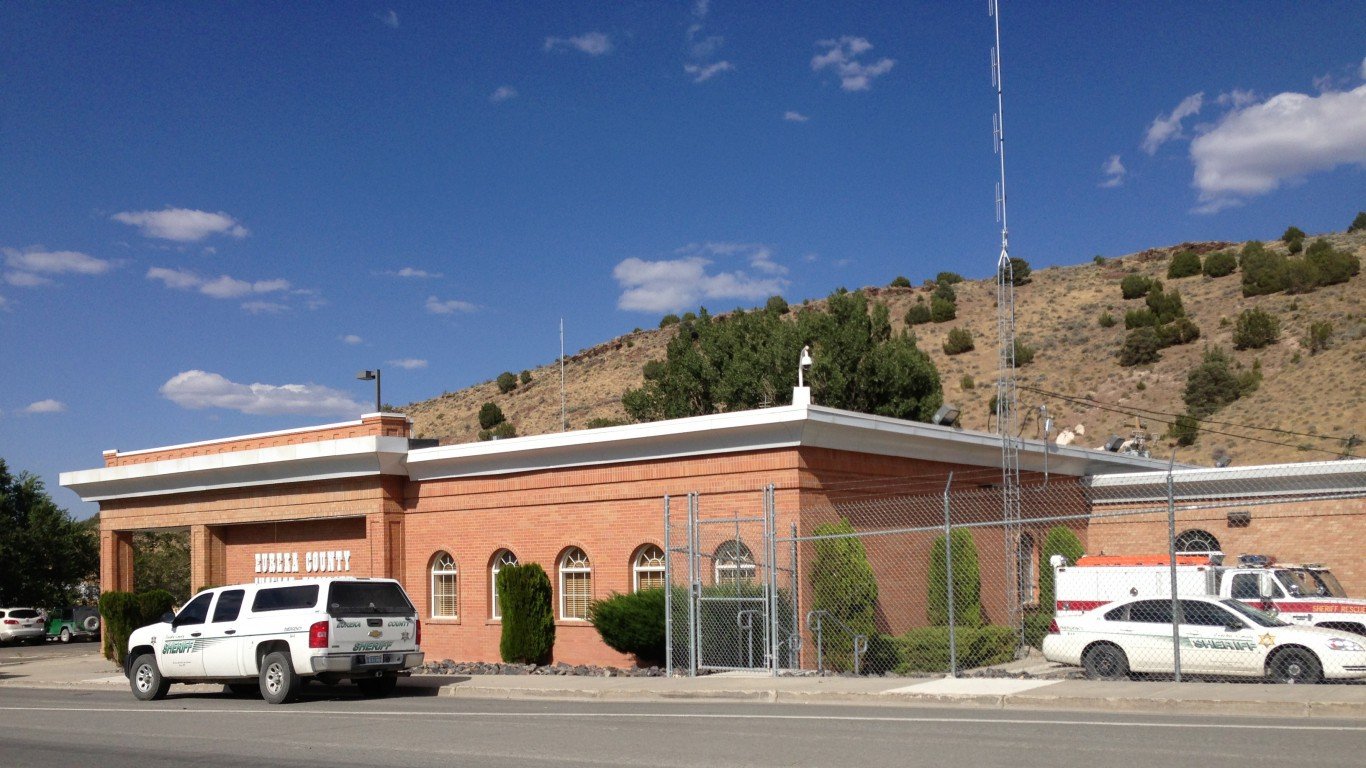
50. Nevada
> Overall grade: D
> Per pupil spending: $8,441 (5th lowest)
> High school graduation rate: 71.3% (2nd lowest)
> Pct. 3 & 4 yr. olds enrolled in preschool: 33.5% (2nd lowest)
No state’s school system is rated worse than Nevada’s. The state’s high school graduation rate declined by nearly 12 percentage points over the decade through 2012. This was the largest decline of all states, the vast majority of which reported graduation rate increases. Just 71.3% of seniors graduate high school, lower than in all states except for New Mexico.
High preschool enrollment is an indication of a healthy education system as it is frequently beneficial to both families and children. In Nevada, just one-third of eligible children are enrolled in preschool, the second lowest proportion of states and in stark contrast to the national share of nearly half of preschool-aged children.
Finding a qualified financial advisor doesn’t have to be hard. SmartAsset’s free tool matches you with up to 3 fiduciary financial advisors in your area in 5 minutes. Each advisor has been vetted by SmartAsset and is held to a fiduciary standard to act in your best interests. If you’re ready to be matched with local advisors that can help you achieve your financial goals, get started now.
Thank you for reading! Have some feedback for us?
Contact the 24/7 Wall St. editorial team.


 24/7 Wall St.
 24/7 Wall St.
 24/7 Wall St.
 24/7 Wall St.