Special Report
Cities Hit Hardest by Extreme Poverty
Published:
Last Updated:
The American economy has been recovering from the Great Recession for nearly eight years. As the U.S. has added jobs and wages have risen steadily, a troubling trend has emerged. As incomes have risen throughout the country, so too has poverty. In 2015, 14.6% of Americans lived in poverty, compared to the 12.4% who did in 2009.
Not only has poverty risen across the country, but the likelihood of living in an extremely poor, economically distressed neighborhood as a low-income individual has also gone up. In 2009, 11.7% of all Americans living below the poverty line resided in neighborhoods where at least 40% of residents were poor. In 2015, that share increased to 14.1%. People of all incomes living in extremely poor neighborhoods face greater obstacles to living healthy, safe, and prosperous lives. But for people earning poverty wages and who often struggle to provide basic necessities, the challenges of living in such neighborhoods are even greater.
[in-text-ad]
In some major metropolitan areas, the growth of extremely poor neighborhoods far outpaced the national trend. In Bakersfield, California, over one in every three poor residents now live in concentrated poverty. 24/7 Wall St. reviewed the 20 cities hit hardest by extreme poverty.
Click here to see the cities hit hardest by extreme poverty.
The national rise in concentrated poverty — the increase in the share of people living in high-poverty neighborhoods — coincided with a substantial increase in the number of high-poverty neighborhoods. The number of such neighborhoods nationwide rose from about 1,900 in 2009 to roughly 2,700 in 2015.
In an exchange with 24/7 Wall St., Natalie Holmes, research analyst at the Brookings Institution’s Metropolitan Policy Program, explained that concentrated poverty can rise, and neighborhoods can tip into extreme poverty for many reasons. “Existing residents of the neighborhood could see their incomes fall below the poverty line; lower-income people could move into the neighborhood; and/or higher-income people could move out of the neighborhood. One or more of these could push the neighborhood’s poverty rate higher.” Holmes explained.
Regardless as to where poor Americans live, they face a number of disadvantages their peers do not. When they must live in areas where they are surrounded by poverty, these problems are exacerbated, and others arise as well. Holmes noted that these challenges include “worse physical and mental health outcomes; worse schools and lower graduation rates; and lower inter-generational economic mobility—meaning children who grow up in these neighborhoods may have a harder time climbing the economic ladder in adulthood.”
Americans living in high-poverty neighborhoods are more likely to be exposed to higher crime rates and are less likely to be mentally and physically healthy. Less affluent neighborhoods are less likely to provide gainful employment opportunities, healthy eating and exercise opportunities, adequate health facilities, and more.
While the presence of high-poverty neighborhoods can partially be explained by normal market forces and by the presence of government low-income housing projects in some communities, these alone do not fully explain why so many poor people live in areas surrounded by poverty. The United States has a history of policies and practices that grouped low-income residents together. Frequently, these policies were racially motivated, such as the so-called “redlining” of neighborhoods that can be traced in part to the Federal Housing Act of 1934, although these practices were going on informally long before then, and long after. Housing discrimination remains a problem in many major cities .
A history of housing segregation along racial lines helps explain why concentrated poverty so disproportionately affects racial minorities in the United States. While 5.7% of poor white Americans live in high-poverty neighborhoods, 16.8% of poor Hispanics live in these communities. Nearly one in every four poor African Americans live in concentrated poverty.
To identify the major metropolitan areas where poverty is concentrating the fastest, 24/7 Wall St. reviewed U.S. Census Bureau American Community Survey data on poverty rates at the tract level. The concentrated poverty rate is the share of a metropolitan area’s poor population that lives in a census tract characterized by extreme poverty — having a poverty rate of 40% or higher. The concentrated poverty rate was reviewed for 2009 — represented as a five-year average for 2005-2009, and 2015 — a five-year average for 2011-2015. Census tracts in which more than 50% of the population is enrolled in postsecondary school or where the total population is fewer than 500 were excluded from consideration of extreme poverty. Violent crime rates are as of 2015 and are from the FBI’s Uniform Crime Report. We also reviewed other data from the American Community Survey, including educational attainment rates for both groups in concentrated poverty and those not in poverty. These data are also averages of the 2005-2009 and 2011-2015 five-year periods.
These are the cities hit hardest by extreme poverty.
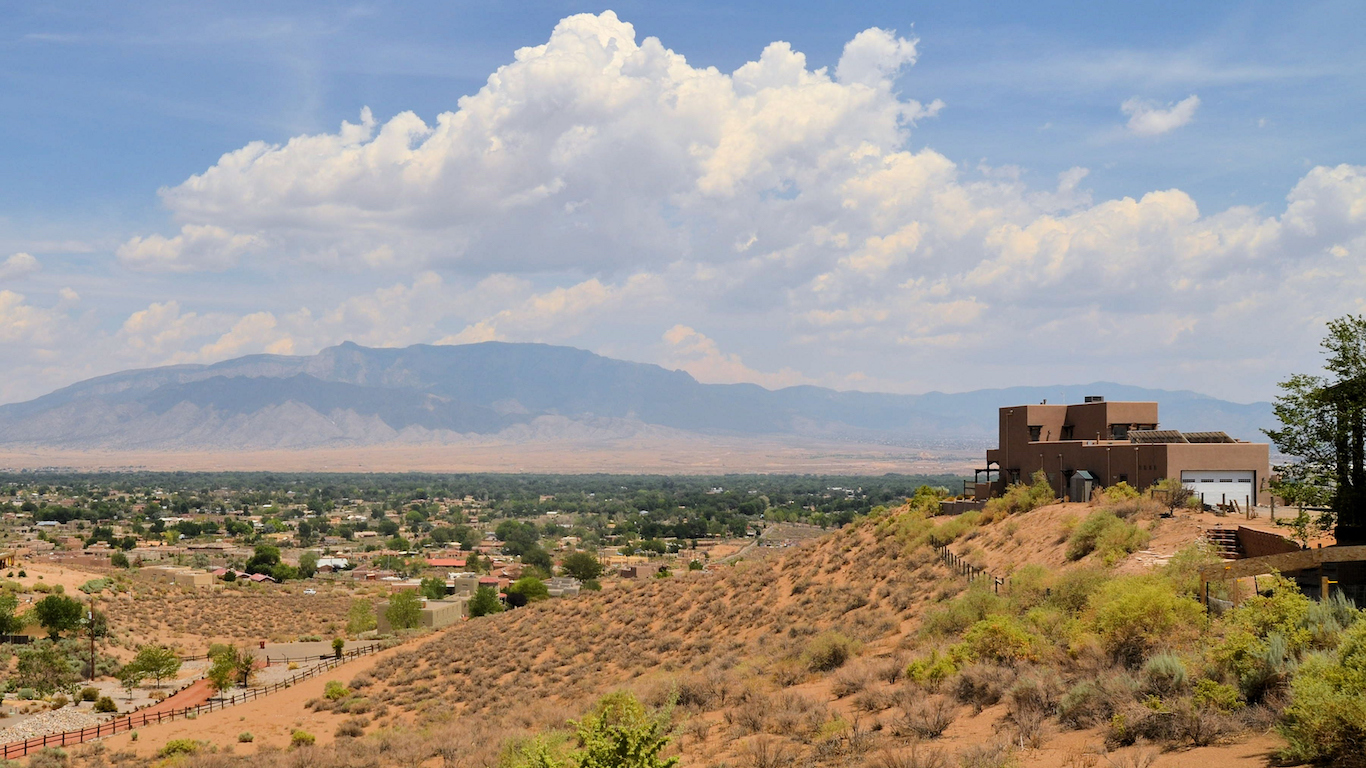
20. Albuquerque, NM
> Concentrated poverty rate chg. 2009-2015: 5.6 ppts
> Concentrated poverty chg. 2009-2015: +13,176
> Change in no. of poor neighborhoods 2009-2015: +7
> Poverty rate: 19.2%
Albuquerque has one of the poorest populations of U.S. metro areas, and conditions have significantly worsened over the last five years. Between 2009 and 2015, the share of the population living in poverty increased from 14.9% to 19.2%, the eighth highest poverty rate of any metropolitan area. As poverty rose in New Mexico’s largest metropolitan area, it became increasingly concentrated in extremely poor neighborhoods as well. The share of poor people living in neighborhoods where at least 40% of the population is poor increased from 7.5% to 13.1%. The number of extremely poor neighborhoods in Albuquerque rose from seven to 11.
[in-text-ad]

19. Las Vegas-Henderson-Paradise, NV
> Concentrated poverty rate chg. 2009-2015: 5.7 ppts
> Concentrated poverty chg. 2009-2015: +26,525
> Change in no. of poor neighborhoods 2009-2015: +19
> Poverty rate: 15.7%
Unlike most metro areas on this list, the level of concentrated poverty in the Last Vegas metro area is lower than it is nationwide. In Las Vegas, 12.9% of people in poverty live in extremely poor neighborhoods, lower than the national concentrated poverty rate of 14.1%. In the past five years, however, poverty intensified faster in the city than in most other U.S. areas.
One of the disadvantages of living in an extremely poor neighborhood is the often higher incidence of violence. For every 100,000 Las Vegas area residents, 815 violent crimes were reported in 2015, the second highest rate of all metro areas.
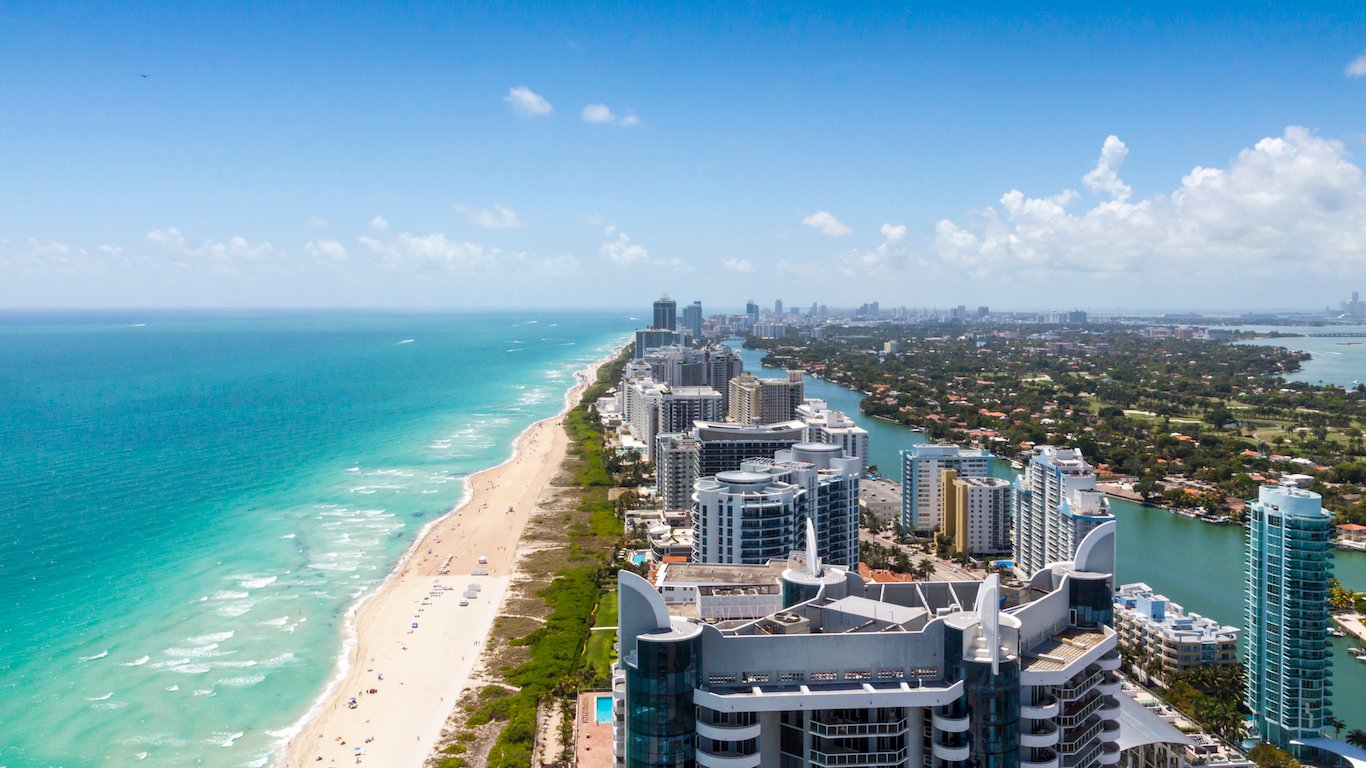
18. Miami-Fort Lauderdale-West Palm Beach, FL
> Concentrated poverty rate chg. 2009-2015: 5.7 ppts
> Concentrated poverty chg. 2009-2015: +71,778
> Change in no. of poor neighborhoods 2009-2015: +34
> Poverty rate: 17.2%
Miami-Fort Lauderdale-West Palm Beach metro area’s poverty rate of 17.2% is one of the higher rates nationwide. While the concentration of these low income individuals in extremely poor neighborhoods, at 12.0%, is lower than average nationwide, it nearly doubled from the concentrated poverty rate of 6.3% five years ago.
The number of neighborhoods in the area with poverty rates of 40% or higher more than doubled in that time, from 24 to 53. The increase was due either to falling incomes in already poor neighborhoods, migration of poor individuals into neighborhoods on the edge of extreme poverty, or both.
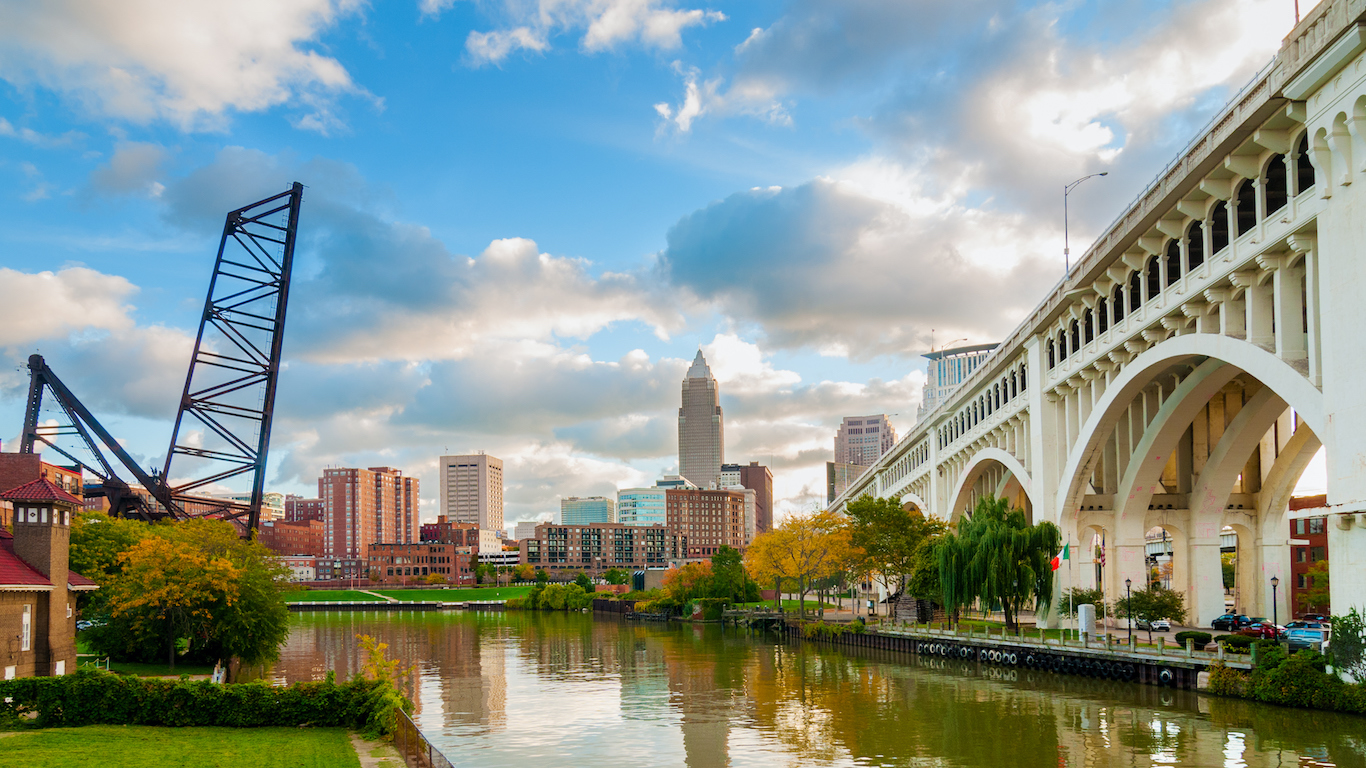
17. Cleveland-Elyria, OH
> Concentrated poverty rate chg. 2009-2015: 5.7 ppts
> Concentrated poverty chg. 2009-2015: +25,739
> Change in no. of poor neighborhoods 2009-2015: +46
> Poverty rate: 15.5%
The number of people living in poverty across the Cleveland metro area climbed from 280,377 in 2009 to 313,983 in 2015. Of the area’s poor population, the share living in extremely poor neighborhoods climbed from 23.2% to 28.9% over the same period, one of the largest concentrations of poverty of any U.S. metro area.
While the country as a whole has largely recovered from the recession, economic conditions in parts of Cleveland have only worsened. Like many other Rust Belt cities, Cleveland’s economy is relatively dependent on manufacturing, an industry that has been shedding jobs for decades.
[in-text-ad-2]
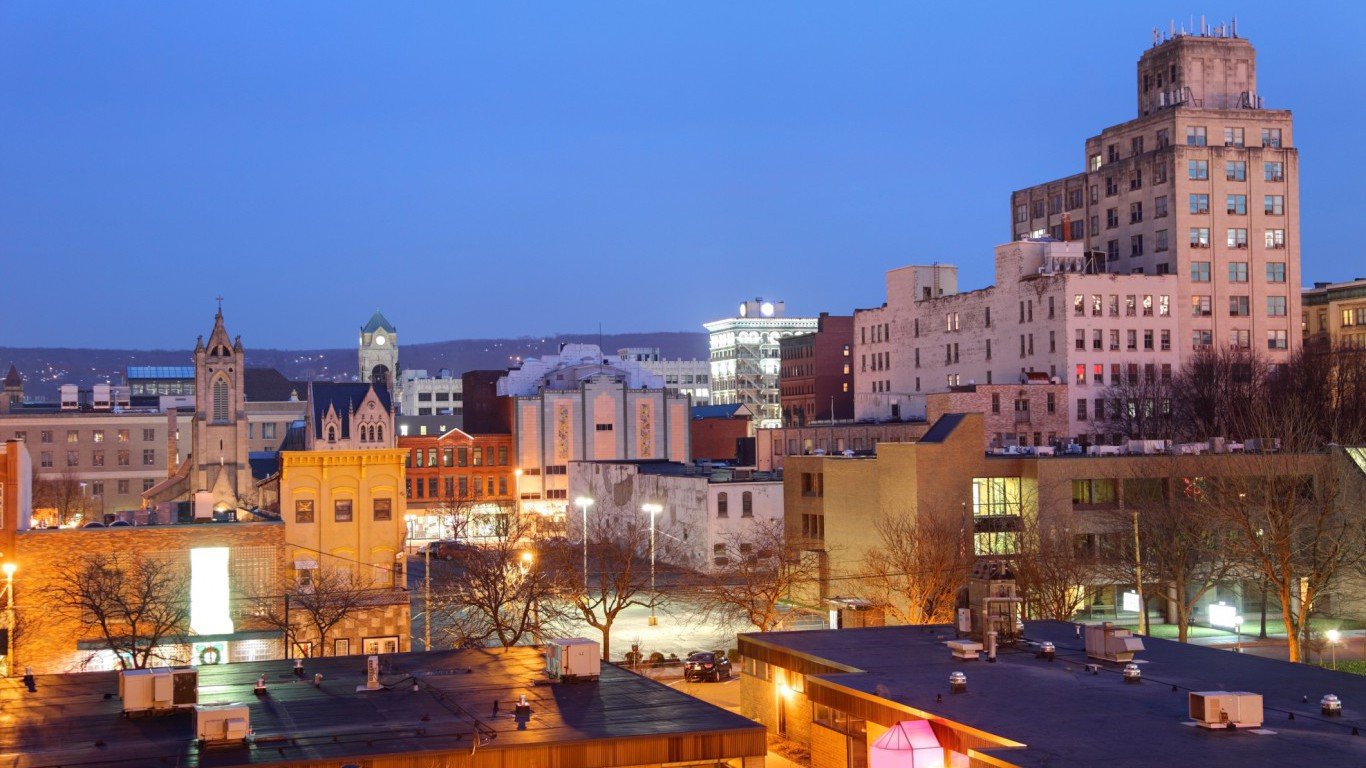
16. Scranton–Wilkes-Barre–Hazleton, PA
> Concentrated poverty rate chg. 2009-2015: 6.7 ppts
> Concentrated poverty chg. 2009-2015: +5,924
> Change in no. of poor neighborhoods 2009-2015: +3
> Poverty rate: 15.2%
Some neighborhoods in the Scranton-Wilkes-Barre-Hazleton metro area are getting poorer. Only 3.0% of metro area residents living on poverty wages lived in extremely poor neighborhoods in 2009. By 2015, the share more than tripled to 9.7%.
The prevalence of poverty in Scranton varies dramatically along racial lines. While the area’s poverty rate among all residents is 15.2%, it is 46% among black residents — the largest such share of any U.S. metro area.
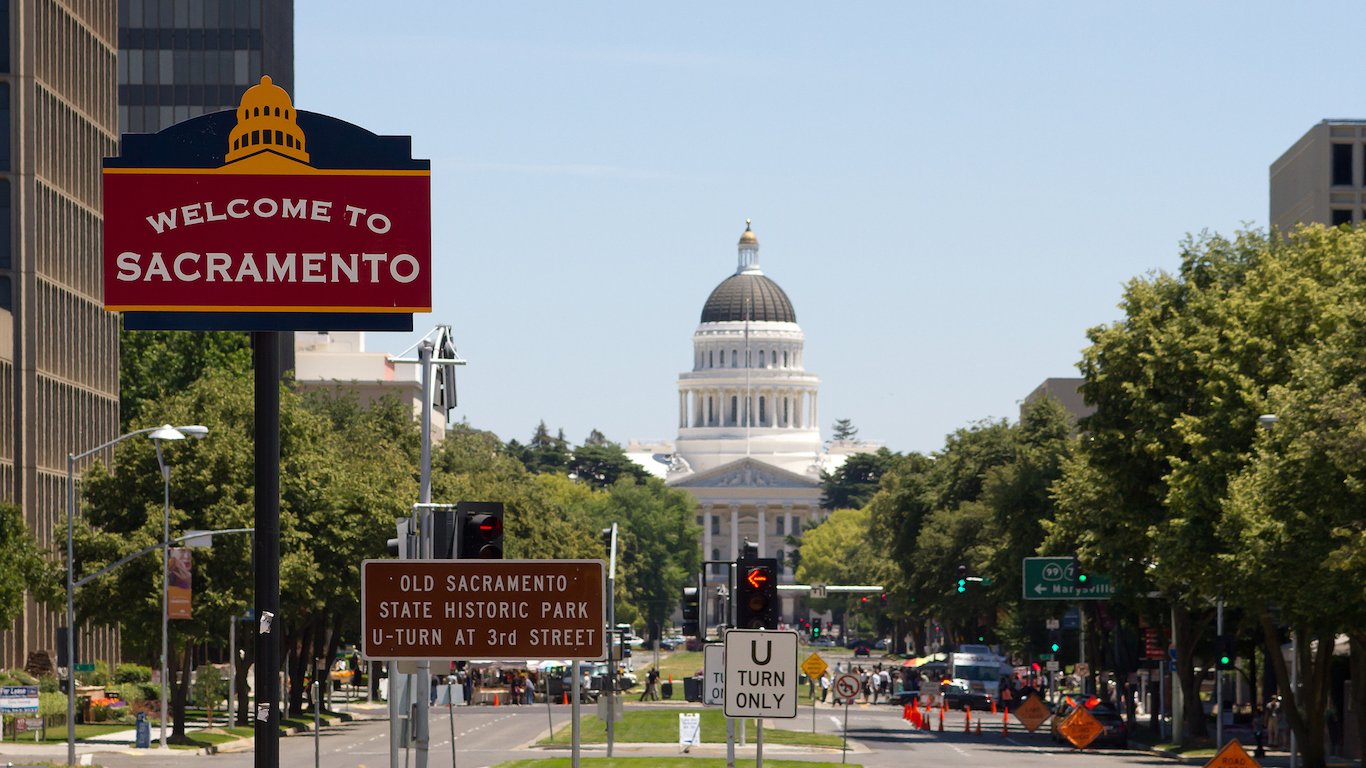
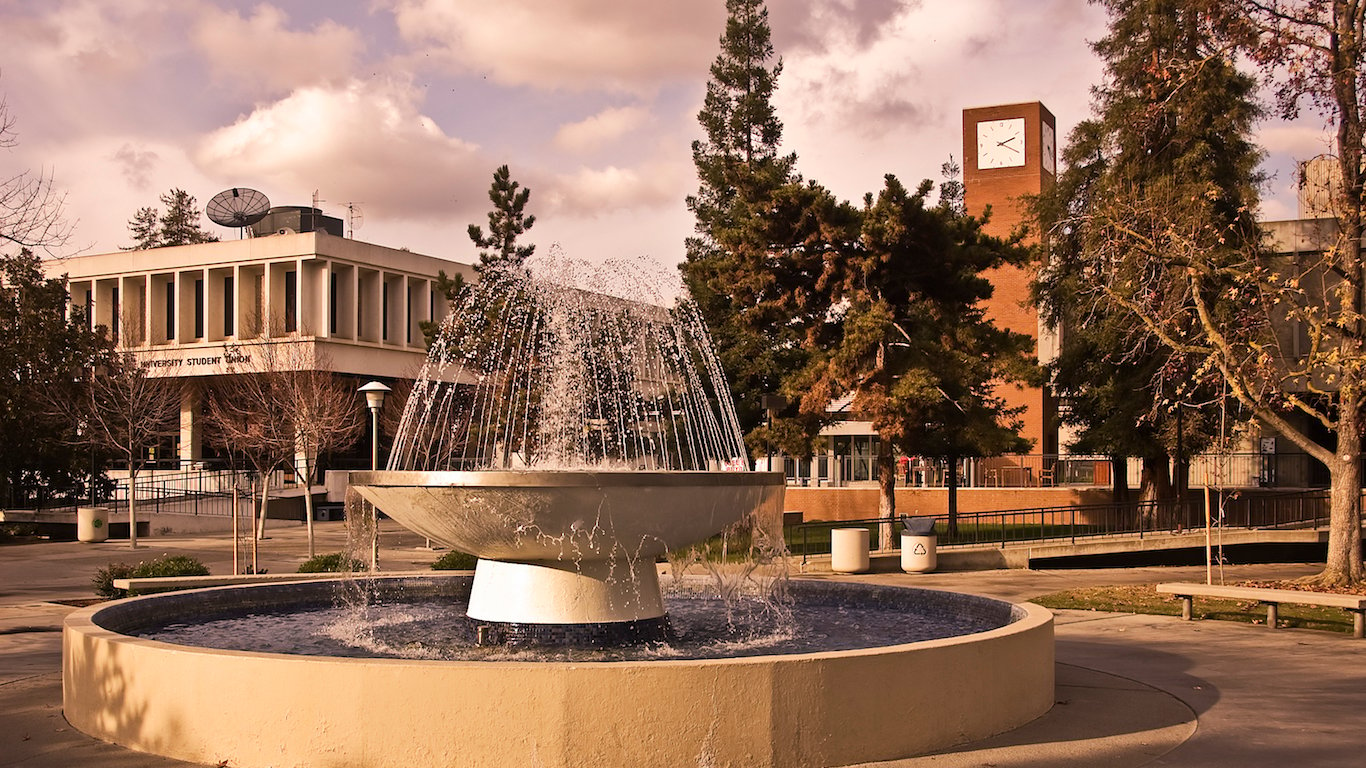
15. Sacramento–Roseville–Arden-Arcade, CA
> Concentrated poverty rate chg. 2009-2015: 6.9 ppts
> Concentrated poverty chg. 2009-2015: +27,597
> Change in no. of poor neighborhoods 2009-2015: +19
> Poverty rate: 16.1%
Low-income individuals living around California’s state capital are more likely to live in very poor neighborhoods today than five years ago. Only about 6,900 people in poverty lived in extremely poor neighborhoods in 2009, compared to 34,500 in 2015.
A college education often leads to higher incomes. Not surprisingly, a relatively small share of adults in Sacramento’s poorest neighborhoods are college educated. Across the metro area, 31.1% of adults have at least a bachelor’s degree, nearly triple the comparable 11.2% share in metro area neighborhoods where are least 40% of residents live in poverty.
[in-text-ad]
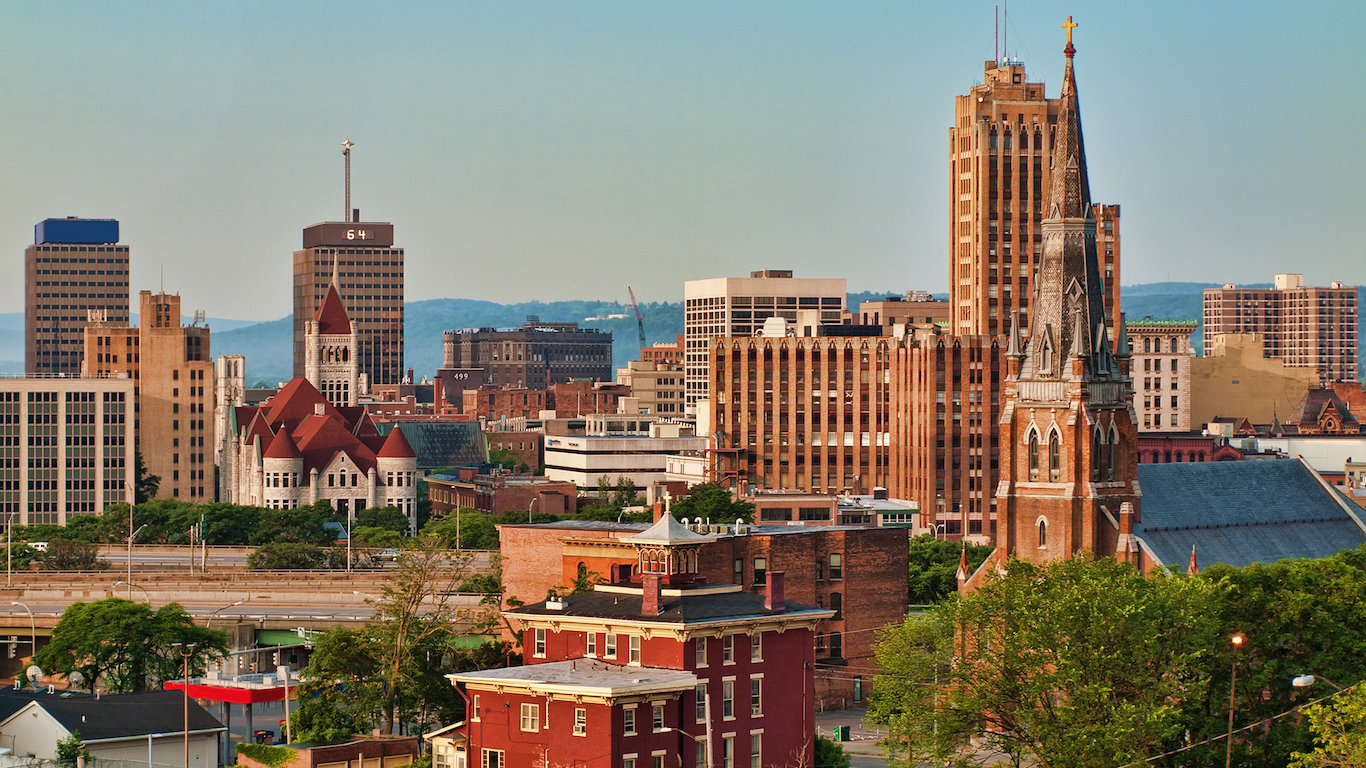
14. Syracuse, NY
> Concentrated poverty rate chg. 2009-2015: 7.2 ppts
> Concentrated poverty chg. 2009-2015: +10,832
> Change in no. of poor neighborhoods 2009-2015: +10
> Poverty rate: 15.7%
Syracuse is one of two large metro areas in upstate New York where neighborhoods are becoming increasingly segregated by income. The share the metro area’s poor population living in extremely poor neighborhoods increased from 21.5% in 2009 to 28.7% in 2015.
Poor blacks and Hispanics are far more likely to live in Syracuse’s extremely poor neighborhoods than poor whites. Some 48.2% of the metro area’s impoverished black population and 54.8% of Hispanics living in poverty reside in extremely poor neighborhoods. In comparison, only 16.6% of whites living in poverty reside in extreme poverty tracts.
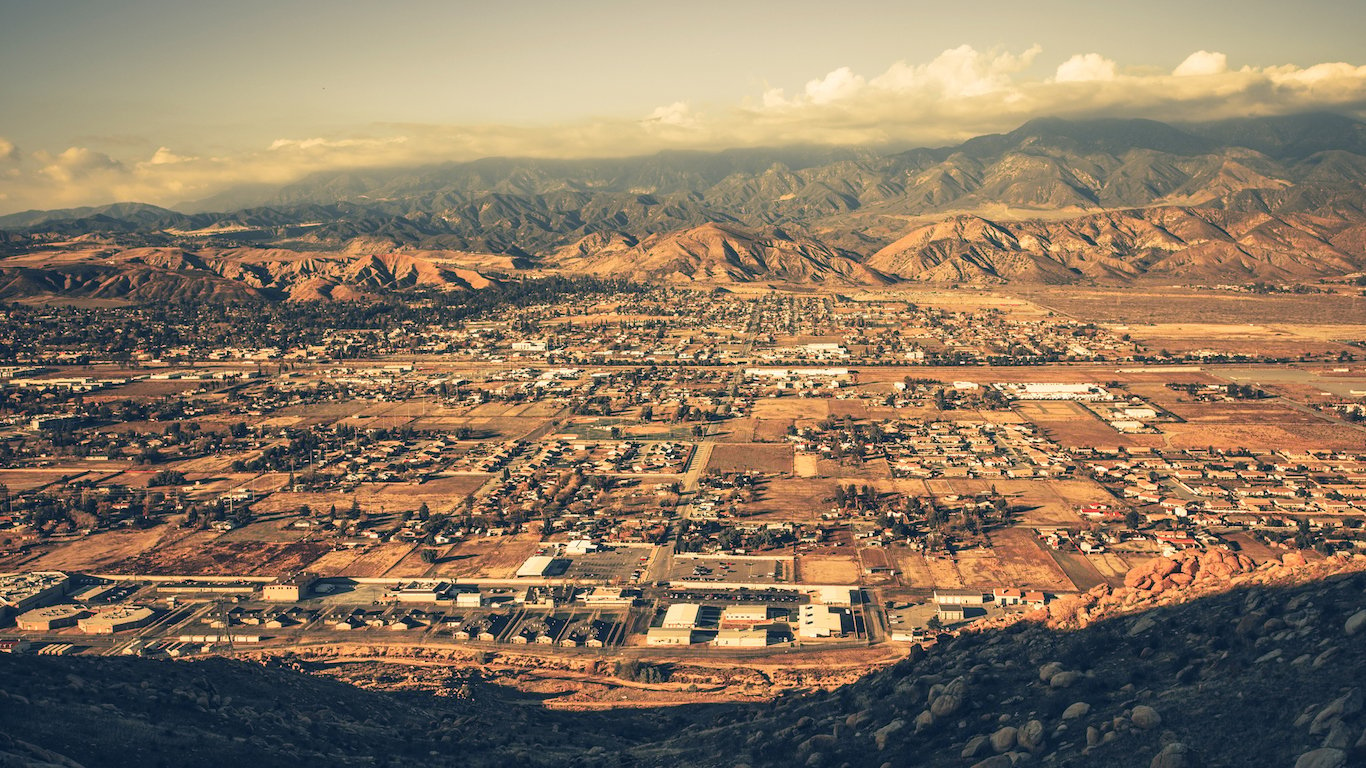
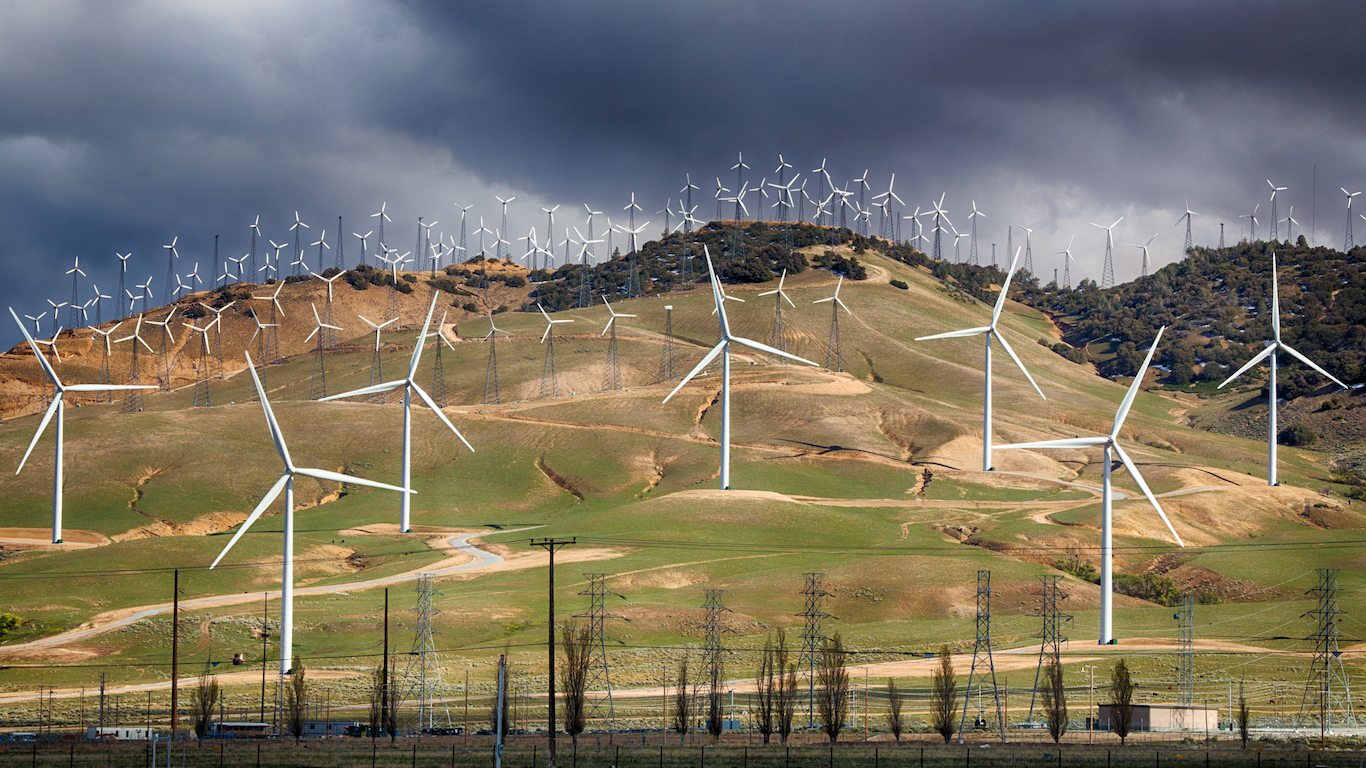
13. Riverside-San Bernardino-Ontario, CA
> Concentrated poverty rate chg. 2009-2015: 8.2 ppts
> Concentrated poverty chg. 2009-2015: +73,280
> Change in no. of poor neighborhoods 2009-2015: +30
> Poverty rate: 18.1%
The Riverside-San Bernardino-Ontario metropolitan area, comprising the massive area in the southern interior of the state known as the Inland Empire, had above average poverty five years ago. But these low-income residents were considerably less likely to live in extremely poor neighborhoods than people in poverty nationwide. Since then, the number of neighborhoods where at least 40% of the population is poor rose from 10 to 38.
Following the national trend, Hispanic residents are much more likely to be both poor and to live in very poor areas. Just 6.7% of the area’s white poor people live in high poverty neighborhoods, compared to 13.1% of Hispanic poor people.

12. Deltona-Daytona Beach-Ormond Beach, FL
> Concentrated poverty rate chg. 2009-2015: 8.5 ppts
> Concentrated poverty chg. 2009-2015: +10,297
> Change in no. of poor neighborhoods 2009-2015: +5
> Poverty rate: 17.0%
The Deltona-Daytona Beach-Ormond Beach metro area is poorer now than it was five years ago. The region’s poverty rate climbed from 13.1% in 2009 to 17.0% in 2015. The metro area has also become more economically segregated. The share of people living on poverty level income residing in extremely poor neighborhoods climbed from 4.7% to 13.1% over the same time period.
Like many metro areas on this list, Daytona Beach’s recovery from the Great Recession has been slow. While the area’s annual GDP growth rate matched the national GDP growth rate of 2.4% in 2014 and 2.8% in 2015, it trailed far behind it in each of the prior four years.
[in-text-ad-2]

11. Lakeland-Winter Haven, FL
> Concentrated poverty rate chg. 2009-2015: 8.7 ppts
> Concentrated poverty chg. 2009-2015: +11,704
> Change in no. of poor neighborhoods 2009-2015: +10
> Poverty rate: 18.3%
In Lakeland-Winter Haven, the number of people in poverty and residing in extremely poor neighborhoods climbed from 4,781 in 2009 to nearly 16,500 in 2015. Like many other cities on this list, Lakeland’s economy has been struggling and poverty has increased since the end of the recession. The metro area’s economy contracted in four of the last seven years and outpaced national annual economic growth rate only once in the same time period. The metro area’s poverty rate of 18.3% is up from 14.4% in 2009.
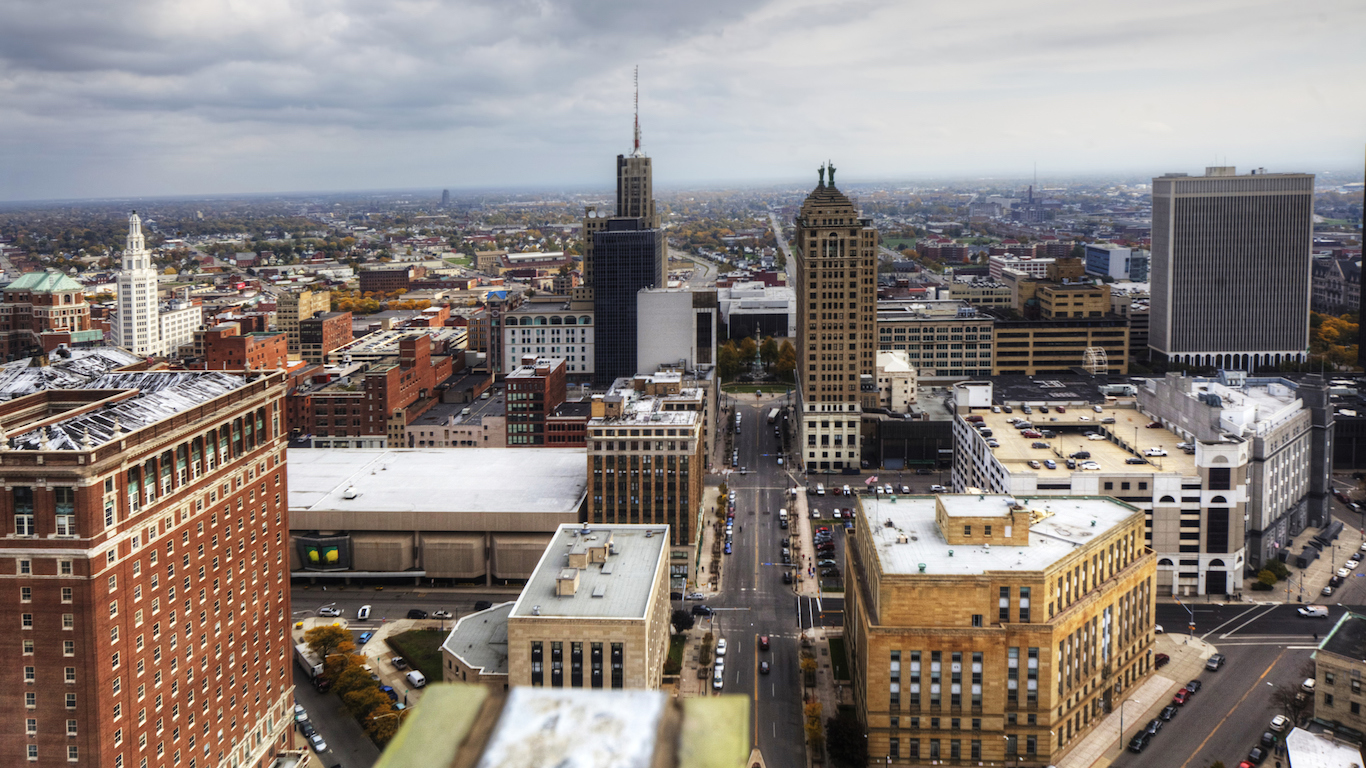
10. Buffalo-Cheektowaga-Niagara Falls, NY
> Concentrated poverty rate chg. 2009-2015: 8.8 ppts
> Concentrated poverty chg. 2009-2015: +16,680
> Change in no. of poor neighborhoods 2009-2015: +15
> Poverty rate: 14.8%
Buffalo, New York’s poverty rate climbed by 1.2 percentage points between 2009 and 2015, slower than the comparable 2.2 percentage point national increase. Despite this, segregation along income lines in the Buffalo metro area has worsened far more rapidly. The share of residents living on poverty level income in extremely poor neighborhoods climbed from 15.7% in 2009 to 24.5% in 2015.
Racial and income segregation often move together. Well over half of the metro area’s 40,000 low-income residents who live in extremely poor communities are black.
[in-text-ad]
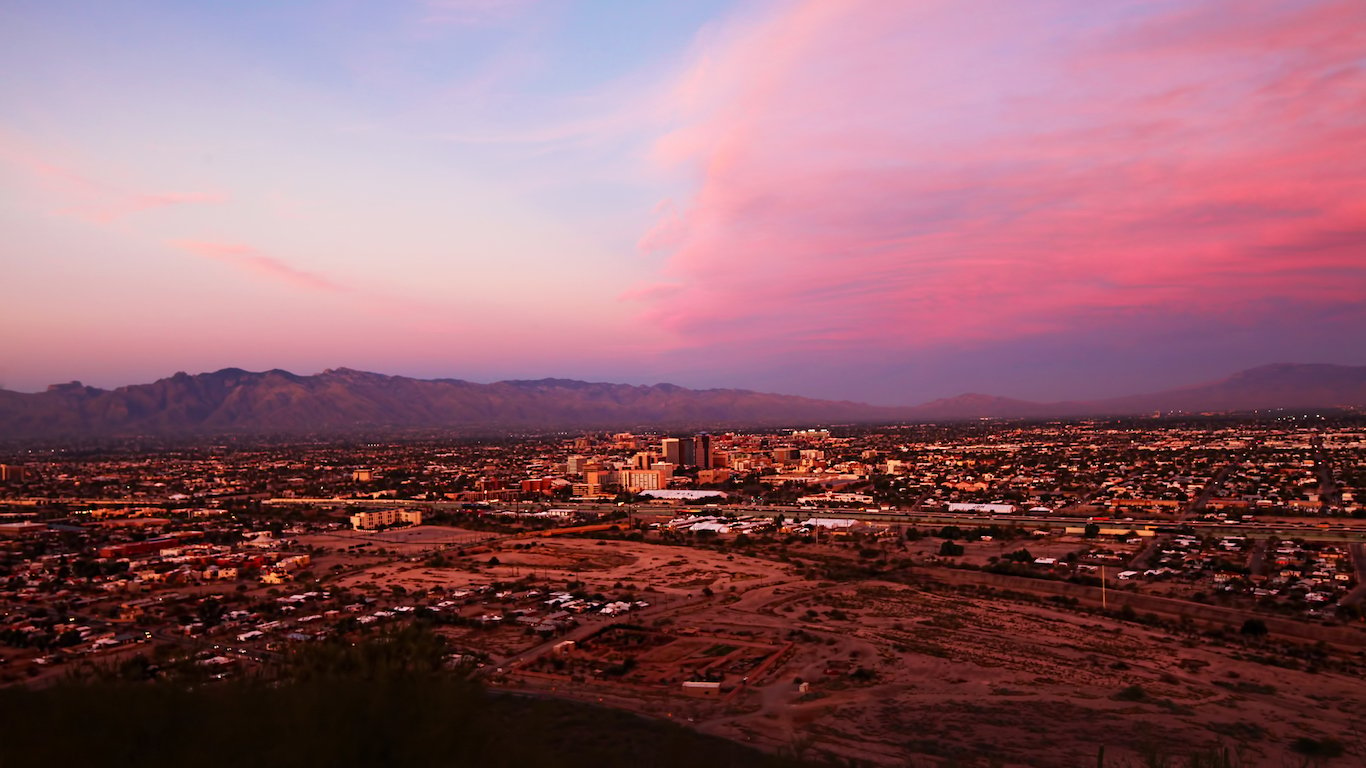
9. Tucson, AZ
> Concentrated poverty rate chg. 2009-2015: 9.4 ppts
> Concentrated poverty chg. 2009-2015: +22,523
> Change in no. of poor neighborhoods 2009-2015: +14
> Poverty rate: 19.3%
Nearly one in five Tucson metro area residents live in poverty, one of the higher poverty rates among metro areas in the country. Further, 23.7% of the area’s poor residents live in extremely poor neighborhoods, also far higher than the 14.1% comparable national share.
Both Tucson’s poverty rate and concentrated poverty rate have increased far faster than the comparable national rates in recent years. The metro area’s poverty rate increase by 3.6 percentage points between 2009 and 2015 compared to the 2.2 percentage point national increase over the same time period. Meanwhile, concentrated poverty in the metro area shot up by 9.4 percentage points, well above the 2.5 percentage point national increase.
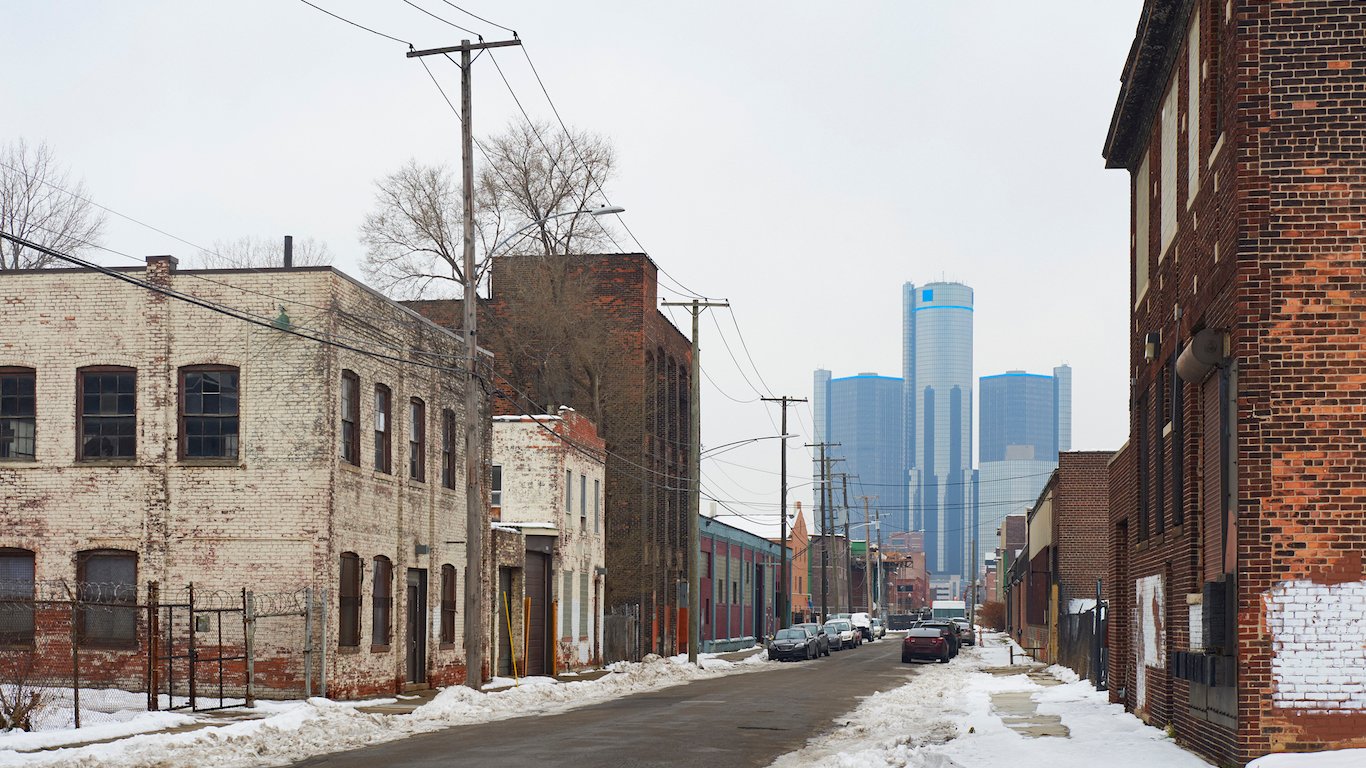
8. Detroit-Warren-Dearborn, MI
> Concentrated poverty rate chg. 2009-2015: 9.8 ppts
> Concentrated poverty chg. 2009-2015: +90,215
> Change in no. of poor neighborhoods 2009-2015: +105
> Poverty rate: 16.8%
In 2009, 147,478 of Detroit’s 676,303 poor people lived in neighborhoods where at least 40% of residents were poor. By 2015, the number of poor people in Detroit rose to 713,256, and the number of those living in extremely poor neighborhoods rose to 237,693. Only New York City, a city with over 10 times the population, has more poor people living in extremely poor neighborhoods. While there are disadvantages of living in poverty in any neighborhood, Detroit’s poor people living in concentrated poverty face even more obstacles to financial security, education, safety, and upward socioeconomic mobility.
As is the case nationwide, concentrated poverty is a much greater issue for racial minorities. While 15.2% of Detroit’s poor white residents live in such neighborhoods, 40.4% of poor Hispanic residents, and 50.3% of poor black residents do.
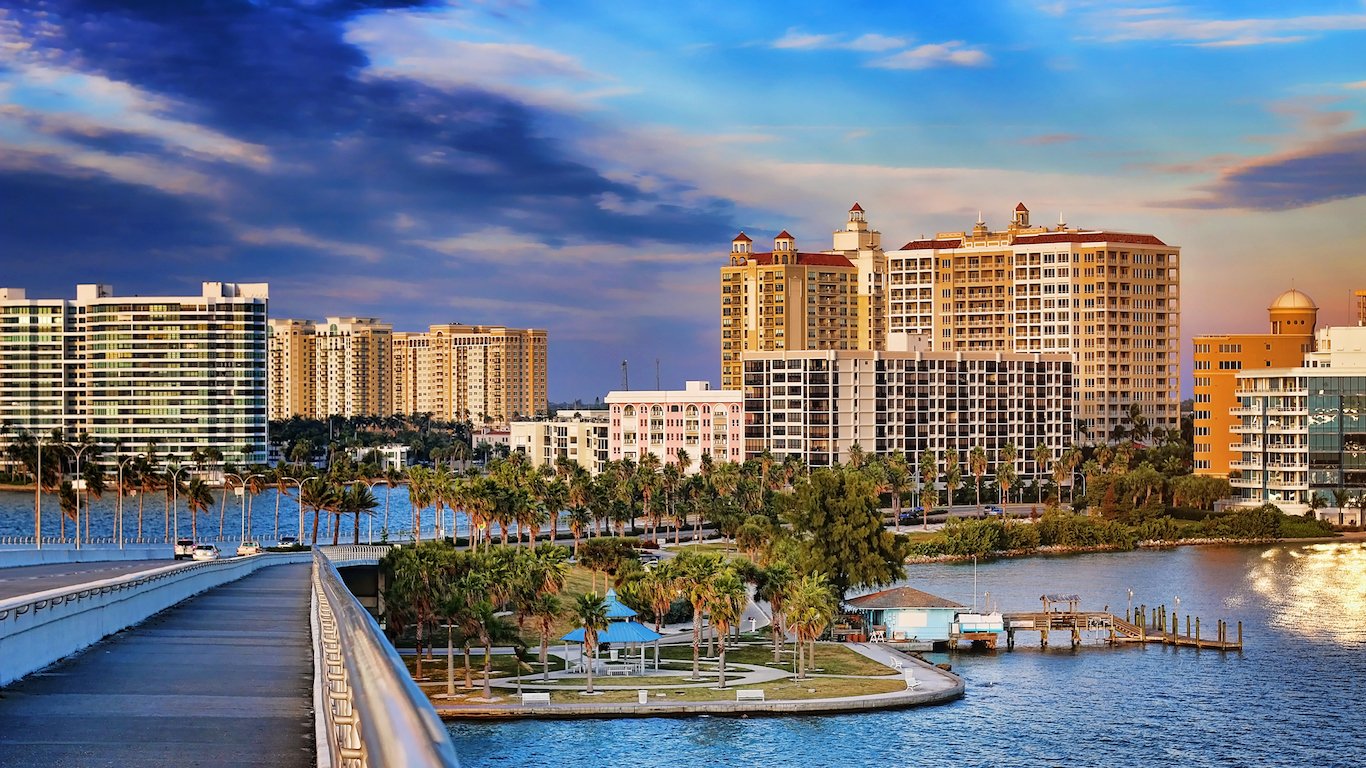
7. North Port-Sarasota-Bradenton, FL
> Concentrated poverty rate chg. 2009-2015: 9.9 ppts
> Concentrated poverty chg. 2009-2015: +9,906
> Change in no. of poor neighborhoods 2009-2015: +4
> Poverty rate: 12.9%
North Port-Sarasota-Bradenton is not an especially poor metro area. Some 12.9% of area residents live on poverty level income, well below the 14.6% national rate. However, the Gulf Coast metro area has become increasingly segregated by income since the end of the recession. Of metro area residents living in poverty, 12.6% live in extremely poor neighborhoods, up considerably from only 2.7% in 2009. This increase has mostly affected the area’s Hispanic residents. Over 25% of the area’s poor hispanic population lives in extremely poor neighborhoods are Hispanic, up from 3.9% in 2009.
[in-text-ad-2]

6. Youngstown-Warren-Boardman, OH-PA
> Concentrated poverty rate chg. 2009-2015: 10.1 ppts
> Concentrated poverty chg. 2009-2015: +10,820
> Change in no. of poor neighborhoods 2009-2015: +16
> Poverty rate: 16.8%
Conditions in extremely poor, distressed neighborhoods are generally difficult for all residents, regardless of their poverty status. Often, public spaces are more run-down, schools receive less funding, and commerce is less developed, among many other issues. For poor people living in extremely poor neighborhoods, these disadvantages are compounded by the difficulties associated with living on a poverty wage. In Youngstown-Warren-Boardman, more than 30% of individuals in poverty live in neighborhoods where poverty rates are 40% or higher — one of the highest levels among metro areas.
As is generally the case in poverty-stricken metro areas, racial segregation is a key aspect of the problem. Of poor, black residents, 60.4% live in extremely poor neighborhoods, versus 30.4% of poor white residents.
5. Fresno, CA
> Concentrated poverty rate chg. 2009-2015: 10.2 ppts
> Concentrated poverty chg. 2009-2015: +43,254
> Change in no. of poor neighborhoods 2009-2015: +27
> Poverty rate: 26.8%
Fresno, California is one of only two major U.S. metro areas where more than one in every four people live in poverty. Of the metro area’s quarter million people living below the poverty line, 35.2% live in extremely poor neighborhoods, one of the largest such shares of any major metro area.
Extremely poor neighborhoods typically struggle with a number of poor socioeconomic conditions tied to extreme poverty, including high crime rates. The 40 extremely poor neighborhoods in the Fresno metro area likely contribute to the far higher than typical violent crime rate of 537 incidents per 100,000 residents a year.
[in-text-ad]

4. Indianapolis-Carmel-Anderson, IN
> Concentrated poverty rate chg. 2009-2015: 10.4 ppts
> Concentrated poverty chg. 2009-2015: +35,205
> Change in no. of poor neighborhoods 2009-2015: +28
> Poverty rate: 14.4%
Since the end of the recession, the number of people living below the poverty line in Indianapolis jumped from just under 200,000 to well over a quarter of a million. Of those living on poverty level income, only about 16,000 lived in extremely poor neighborhoods in 2009. That number has since jumped to nearly 51,000.
Worsening economic conditions and increased income-based segregation in Indianapolis is partially the result of continued employment declines in the manufacturing industry.

3. Toledo, OH
> Concentrated poverty rate chg. 2009-2015: 12.4 ppts
> Concentrated poverty chg. 2009-2015: +16,451
> Change in no. of poor neighborhoods 2009-2015: +13
> Poverty rate: 19.0%
While concentrated poverty affects white Americans, it is much more widespread among racial minorities, and this is certainly the case in Toledo as well. The share of poor Hispanics in the metropolitan area living in neighborhoods where at least 40% of residents are poor rose from an already high 27.7% in 2009 to 40.8% in 2015. More than half of the area’s 33,100 poor black people live in extremely poor neighborhoods, roughly double the share of poor white residents who live in extreme poverty.

2. Phoenix-Mesa-Scottsdale, AZ
> Concentrated poverty rate chg. 2009-2015: 13.0 ppts
> Concentrated poverty chg. 2009-2015: +116,459
> Change in no. of poor neighborhoods 2009-2015: +65
> Poverty rate: 17.0%
About 176,000 of the Phoenix metro area’s 737,000 poor people live in extremely poor neighborhoods. While people living in poverty face a number of disadvantages, living in very poor neighborhoods can have other wide-reaching negative effects. Poor people living in these areas are less likely to receive a good education, more likely to have worse mental and physical health, and to have greater difficulty climbing the socioeconomic ladder than poor people living in higher-income areas. While there are about 21,000 poor white Phoenix residents living in high-poverty neighborhoods, there are nearly six times as many poor Hispanics living in such conditions.
[in-text-ad-2]
1. Bakersfield, CA
> Concentrated poverty rate chg. 2009-2015: 17.2 ppts
> Concentrated poverty chg. 2009-2015: +40,878
> Change in no. of poor neighborhoods 2009-2015: +12
> Poverty rate: 23.5%
The share of poor people living in extremely impoverished neighborhoods in the Bakersfield metro area nearly doubled between 2009 and 2015. As of 2015, more than one in every three people in Bakersfield living in poverty resided in an extremely poor neighborhood, up from only 16.2% in 2009.
Over the same time period, the share of poor whites living in extremely poor neighborhoods climbed dramatically, from 4.3% to 22.8%. Meanwhile, the share of poor blacks in such neighborhoods fell slightly, from 32.2% in 2009 to 31.2% in 2015.
Are you ready for retirement? Planning for retirement can be overwhelming, that’s why it could be a good idea to speak to a fiduciary financial advisor about your goals today.
Start by taking this retirement quiz right here from SmartAsset that will match you with up to 3 financial advisors that serve your area and beyond in 5 minutes. Smart Asset is now matching over 50,000 people a month.
Click here now to get started.
Thank you for reading! Have some feedback for us?
Contact the 24/7 Wall St. editorial team.


 24/7 Wall St.
 24/7 Wall St.