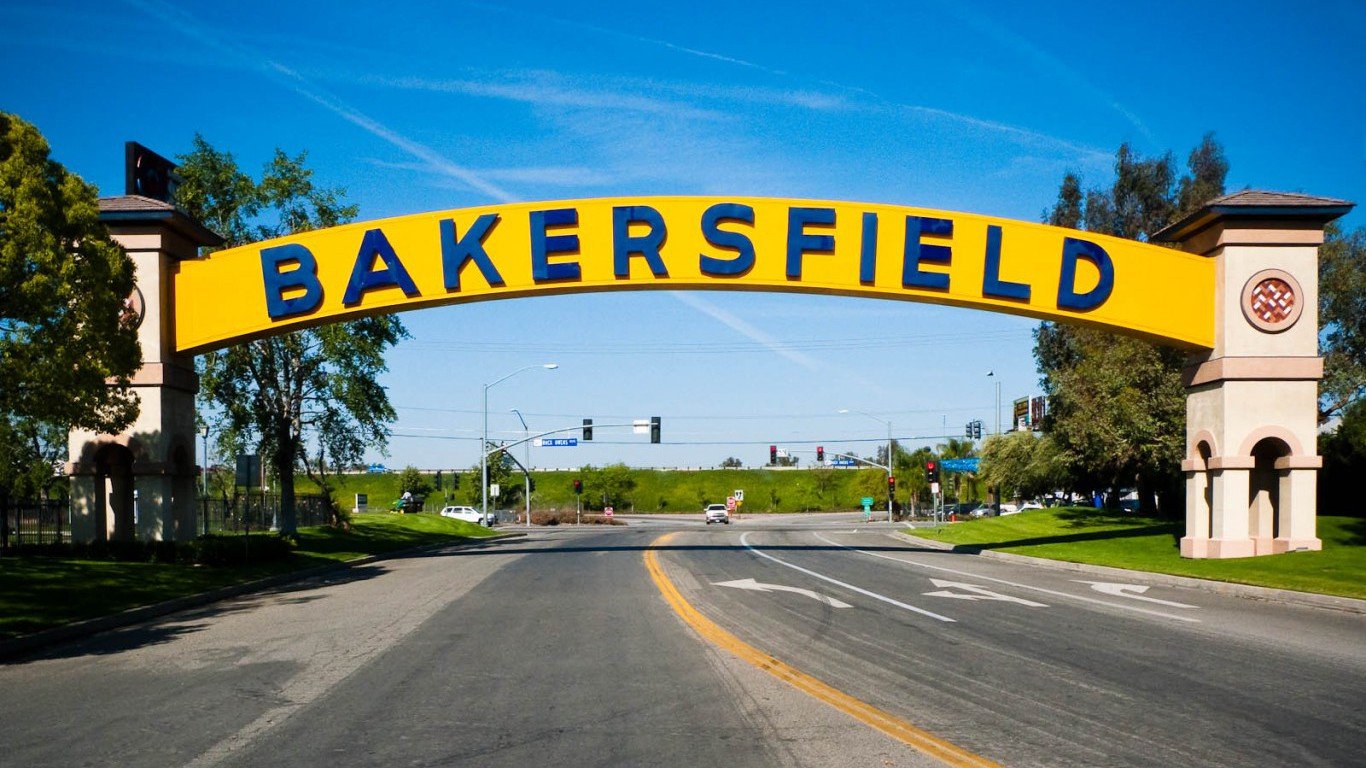
The Most (and Least) Expensive States to Drive
June 29, 2017 by Steven M. PetersThe cost of driving a car in one state compared to another can differ by more than $2,000 a year. In states where accidents are prevalent, insurance rates are often higher. In western states, gas prices tend to be higher. And in states with bad road conditions, vehicles require more frequent repairs. All these factors contribute to overall yearly driving costs.
To identify the most and least expensive states in which to drive, 24/7 Wall St. calculated the annual cost of owning, operating, and repairing a vehicle. The calculation includes annual fuel expenditures, the average cost to fix a check engine light — which was used as proxy for annual repair cost — and the average premium for a full-coverage insurance policy.
The cost of insurance varies much more than the other two factors, with the annual cost of full-coverage differing by as much as $1,930 between the top and bottom states. With only two exceptions, in states where it is most expensive to drive, high insurance premiums are the main contributor to the high expenditure.
Average yearly car expenditures include $1,325 for insurance and $1,210 for gas. In addition, the average cost of repairing a check engine light is $387. In total, the average U.S. motorist pays $2,923 a year to drive a car. Generally, the sum of these costs is higher in Southern states, while it is relatively cheap to drive in Midwestern states.
Click here to see the most and least expensive states to drive.
Click here to see the detailed findings and methodology.
50. Ohio
> Vehicle operating cost: $2,294/yr.
> Avg. price of gas: $2.15 (15th lowest)
> Avg. insurance premium: $900/yr. (2nd lowest)
> Avg. repair cost: $356 (3rd lowest)
[in-text-ad]
49. Wisconsin
> Vehicle operating cost: $2,331/yr.
> Avg. price of gas: $2.23 (23rd highest)
> Avg. insurance premium: $912/yr. (3rd lowest)
> Avg. repair cost: $357 (4th lowest)

48. Iowa
> Vehicle operating cost: $2,353/yr.
> Avg. price of gas: $2.20 (23rd lowest)
> Avg. insurance premium: $989/yr. (8th lowest)
> Avg. repair cost: $358 (5th lowest)
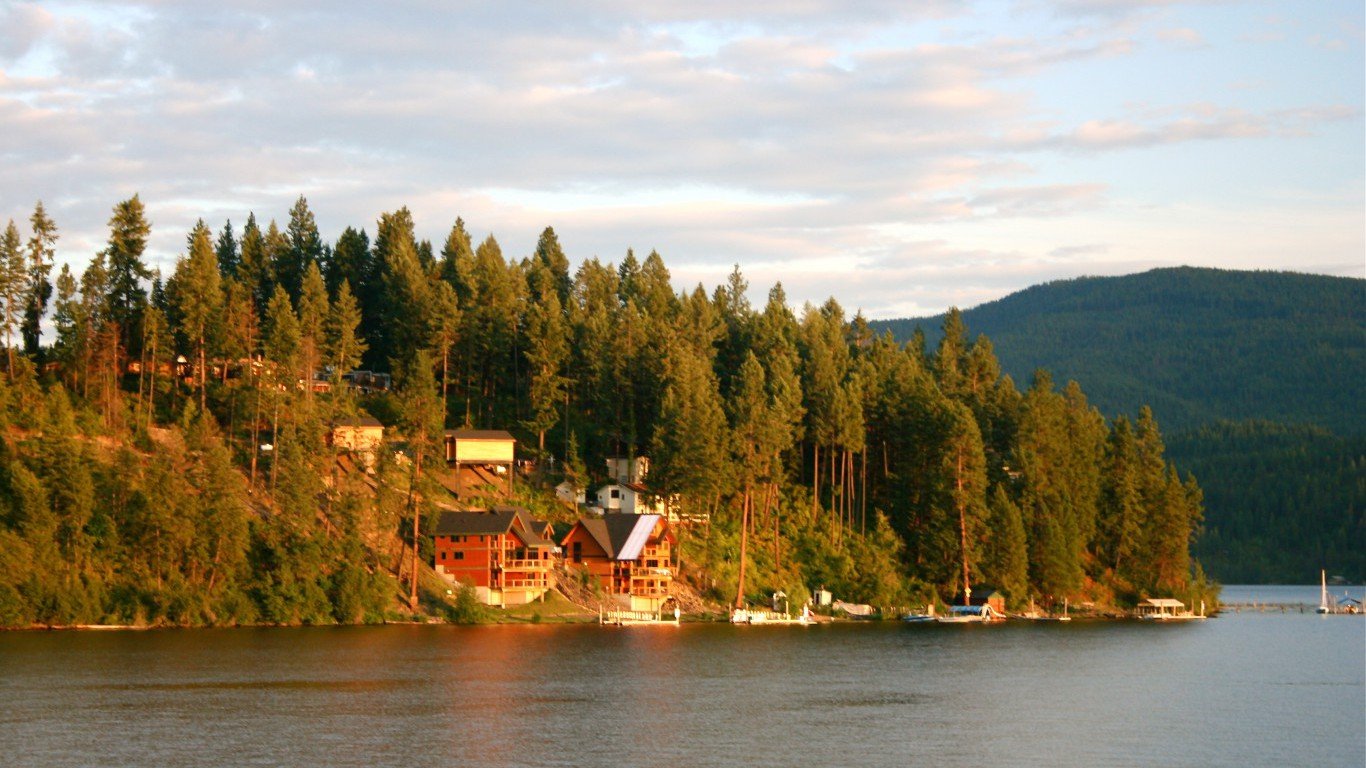
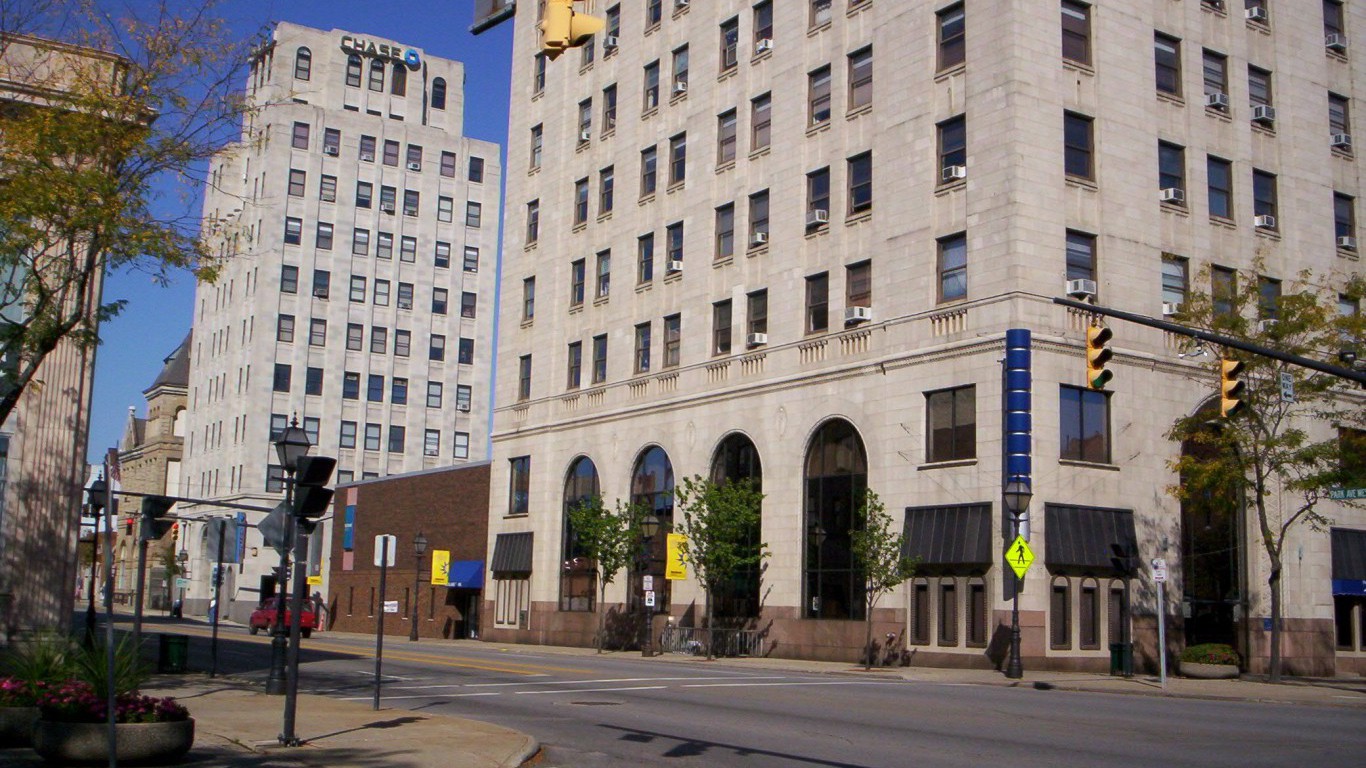
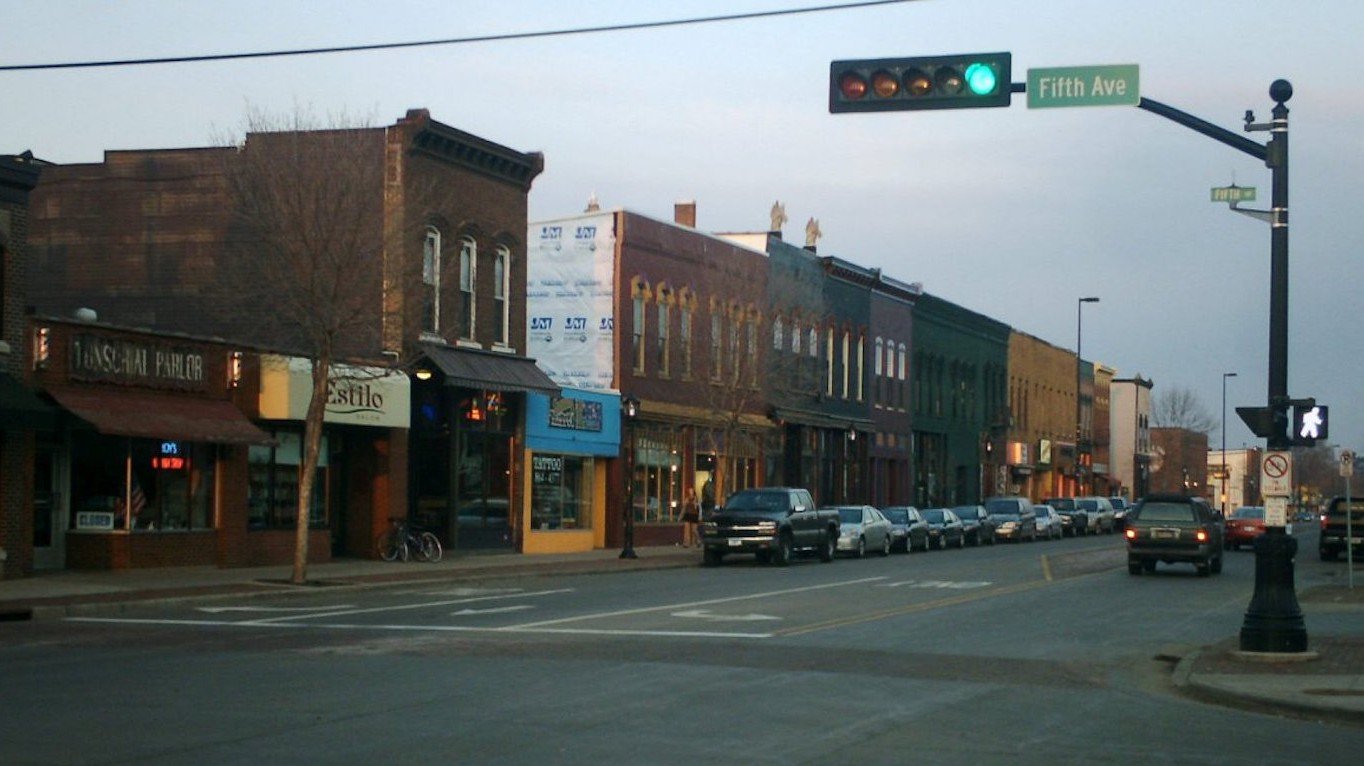
47. Idaho
> Vehicle operating cost: $2,384/yr.
> Avg. price of gas: $2.57 (7th highest)
> Avg. insurance premium: $935/yr. (4th lowest)
> Avg. repair cost: $408 (12th highest)
[in-text-ad-2]
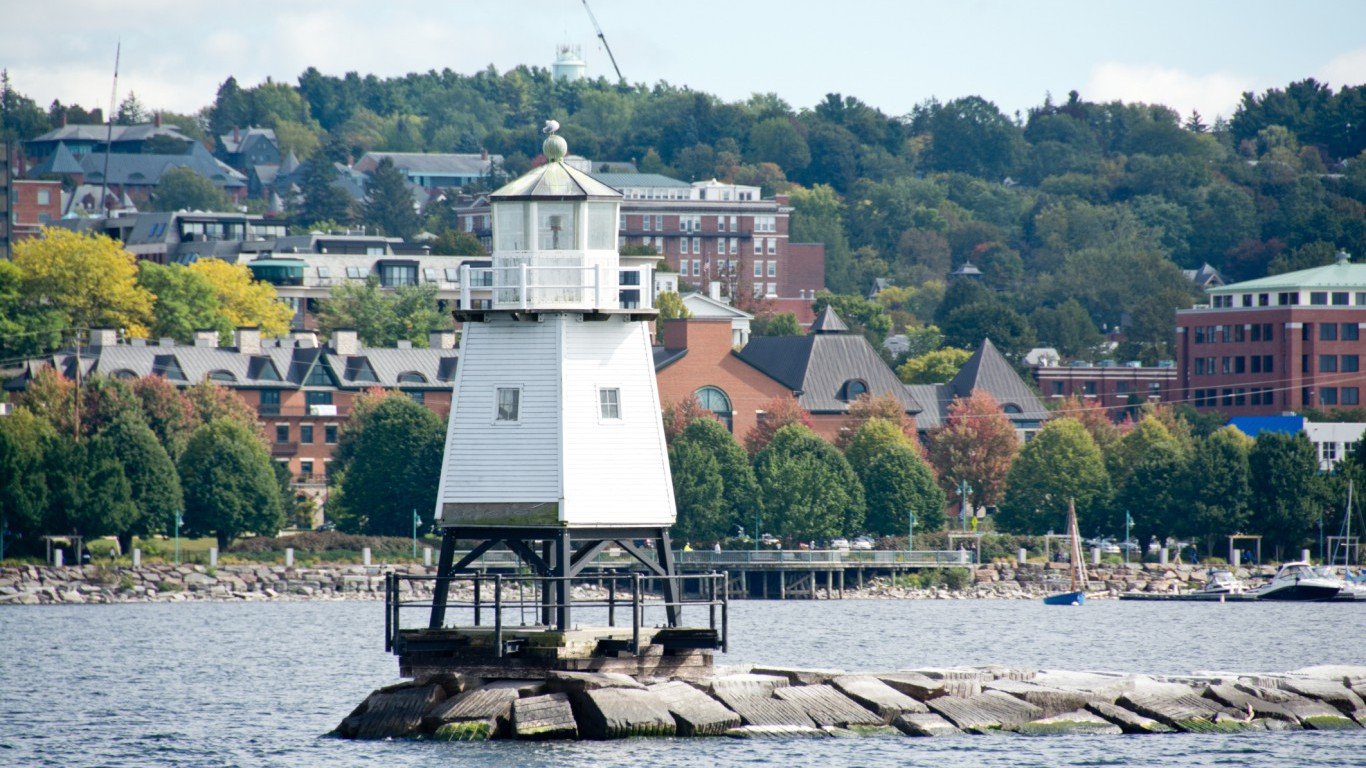
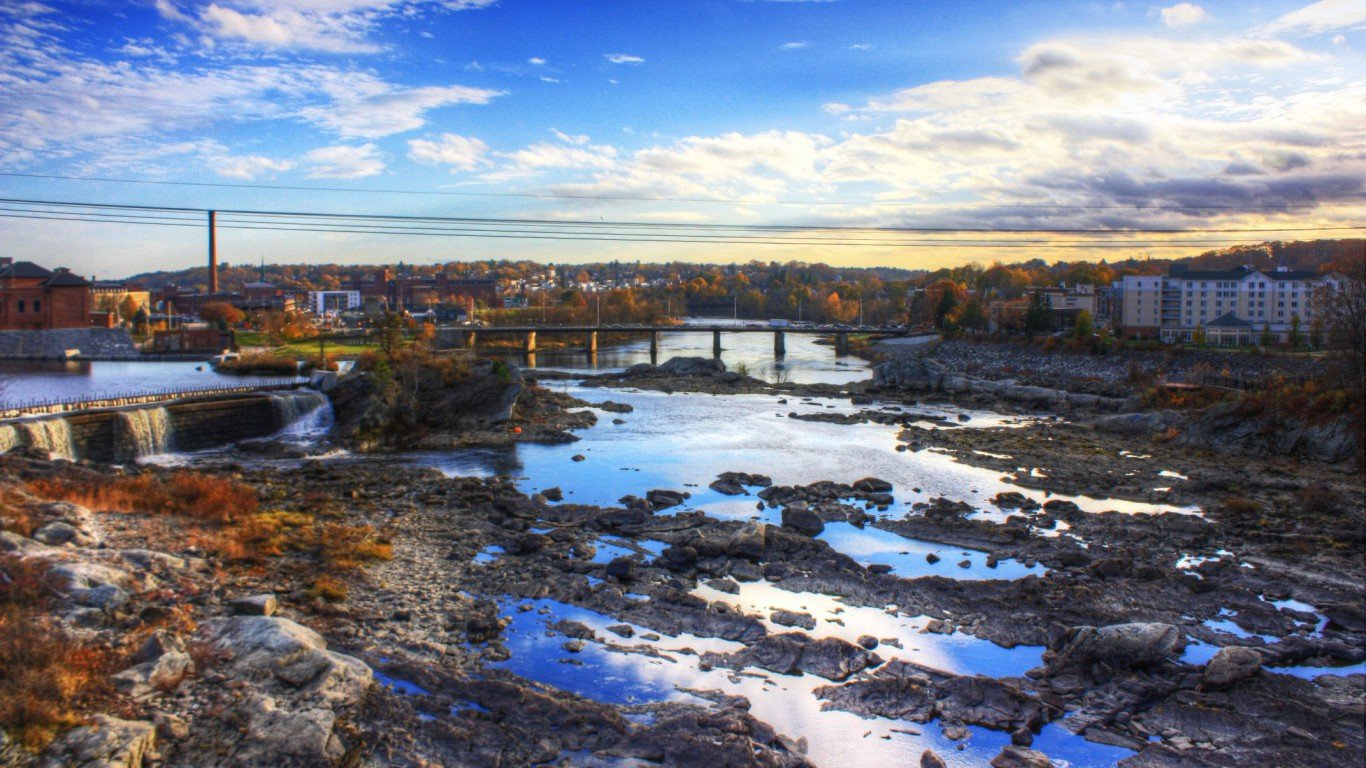
46. Vermont
> Vehicle operating cost: $2,441/yr.
> Avg. price of gas: $2.32 (14th highest)
> Avg. insurance premium: $942/yr. (6th lowest)
> Avg. repair cost: $391 (24th highest)
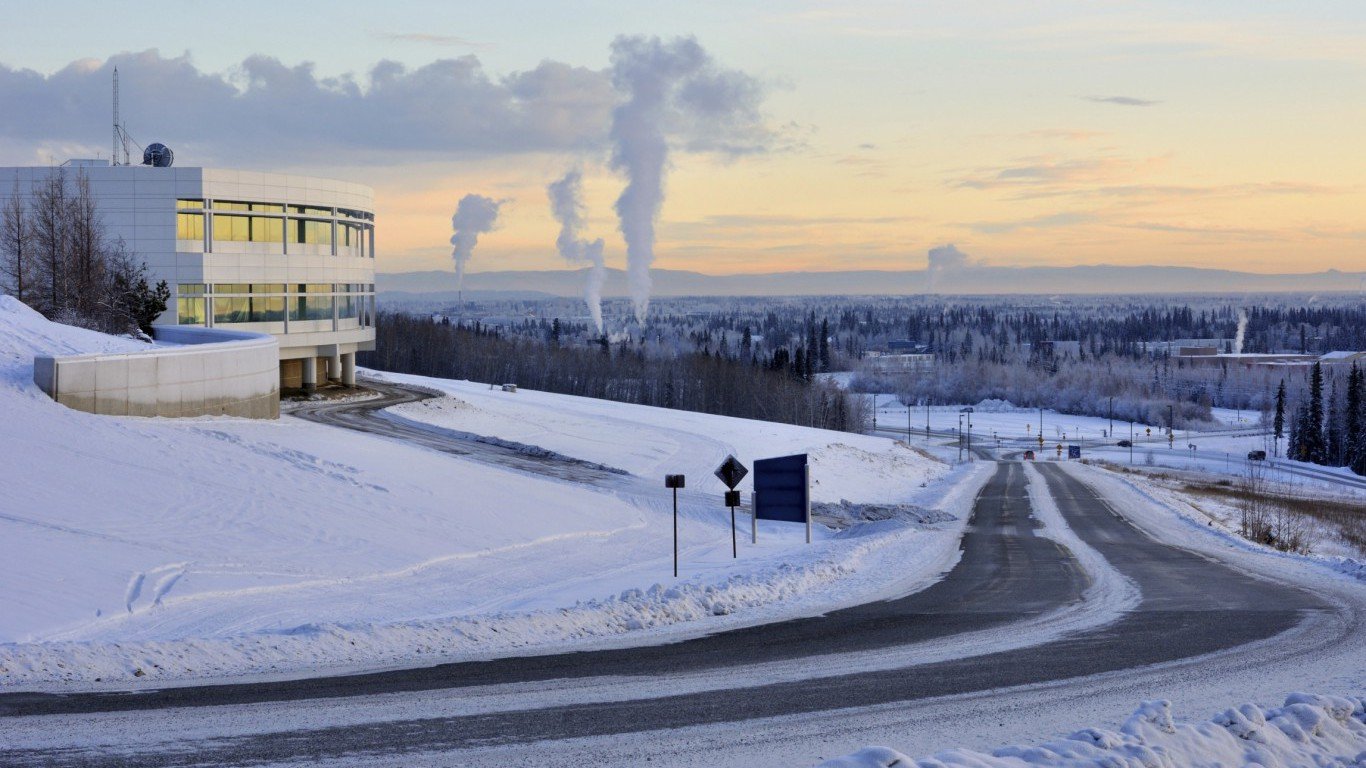
45. Alaska
> Vehicle operating cost: $2,471/yr.
> Avg. price of gas: $2.75 (4th highest)
> Avg. insurance premium: $1,078/yr. (15th lowest)
> Avg. repair cost: $407 (15th highest)
[in-text-ad]

44. Kansas
> Vehicle operating cost: $2,501/yr.
> Avg. price of gas: $2.04 (9th lowest)
> Avg. insurance premium: $1,135/yr. (17th lowest)
> Avg. repair cost: $369 (7th lowest)

43. Illinois
> Vehicle operating cost: $2,508/yr.
> Avg. price of gas: $2.28 (17th highest)
> Avg. insurance premium: $1,035/yr. (10th lowest)
> Avg. repair cost: $372 (11th lowest)
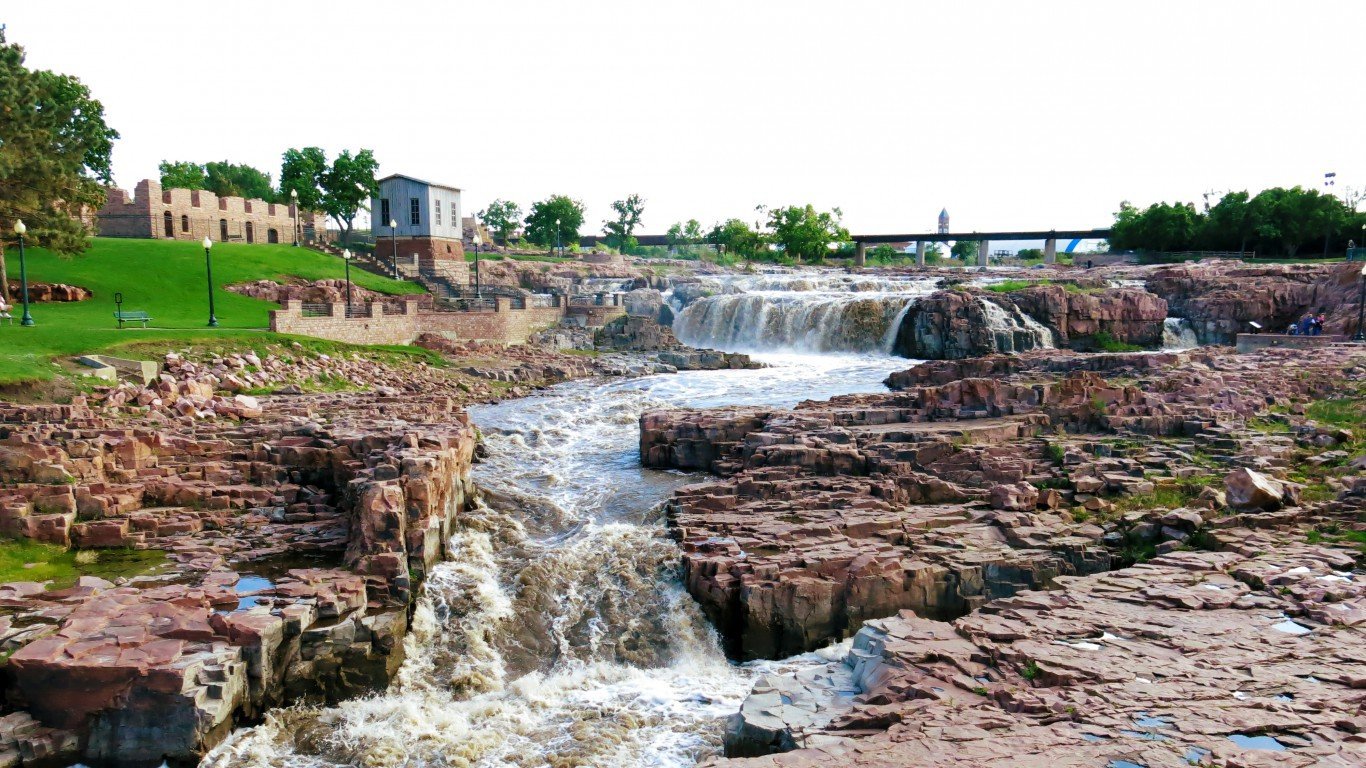
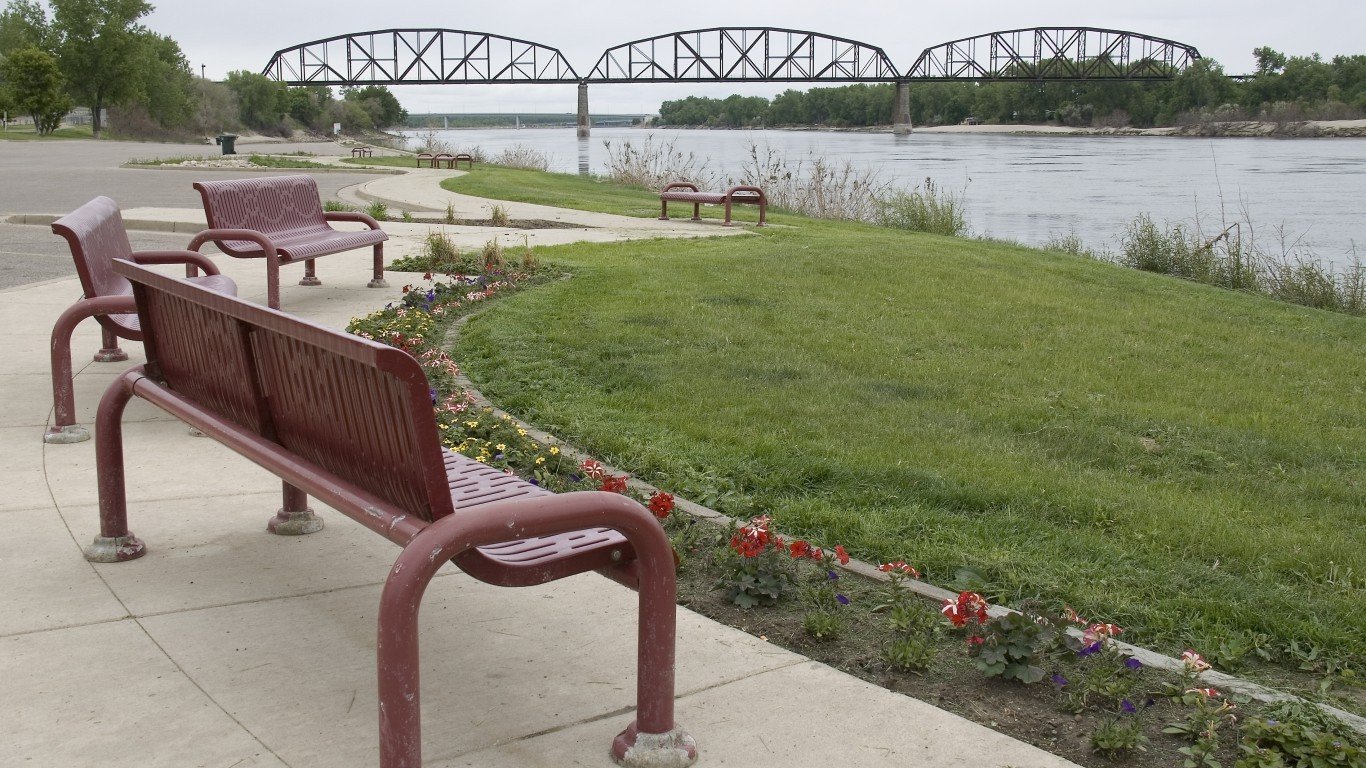
42. South Dakota
> Vehicle operating cost: $2,509/yr.
> Avg. price of gas: $2.23 (24th highest)
> Avg. insurance premium: $1,168/yr. (tied-19th lowest)
> Avg. repair cost: $370 (10th lowest)
[in-text-ad-2]
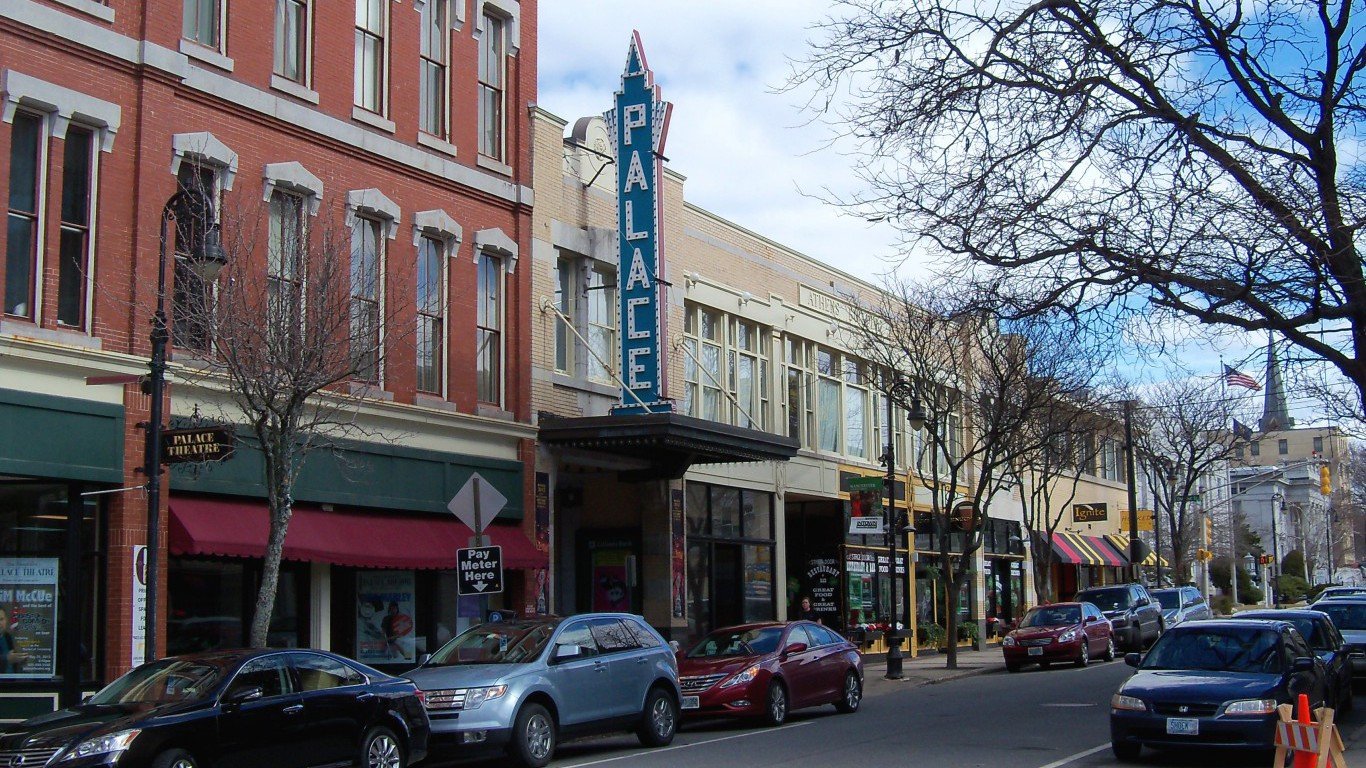
41. New Hampshire
> Vehicle operating cost: $2,541/yr.
> Avg. price of gas: $2.19 (22nd lowest)
> Avg. insurance premium: $941/yr. (5th lowest)
> Avg. repair cost: $389 (24th lowest)
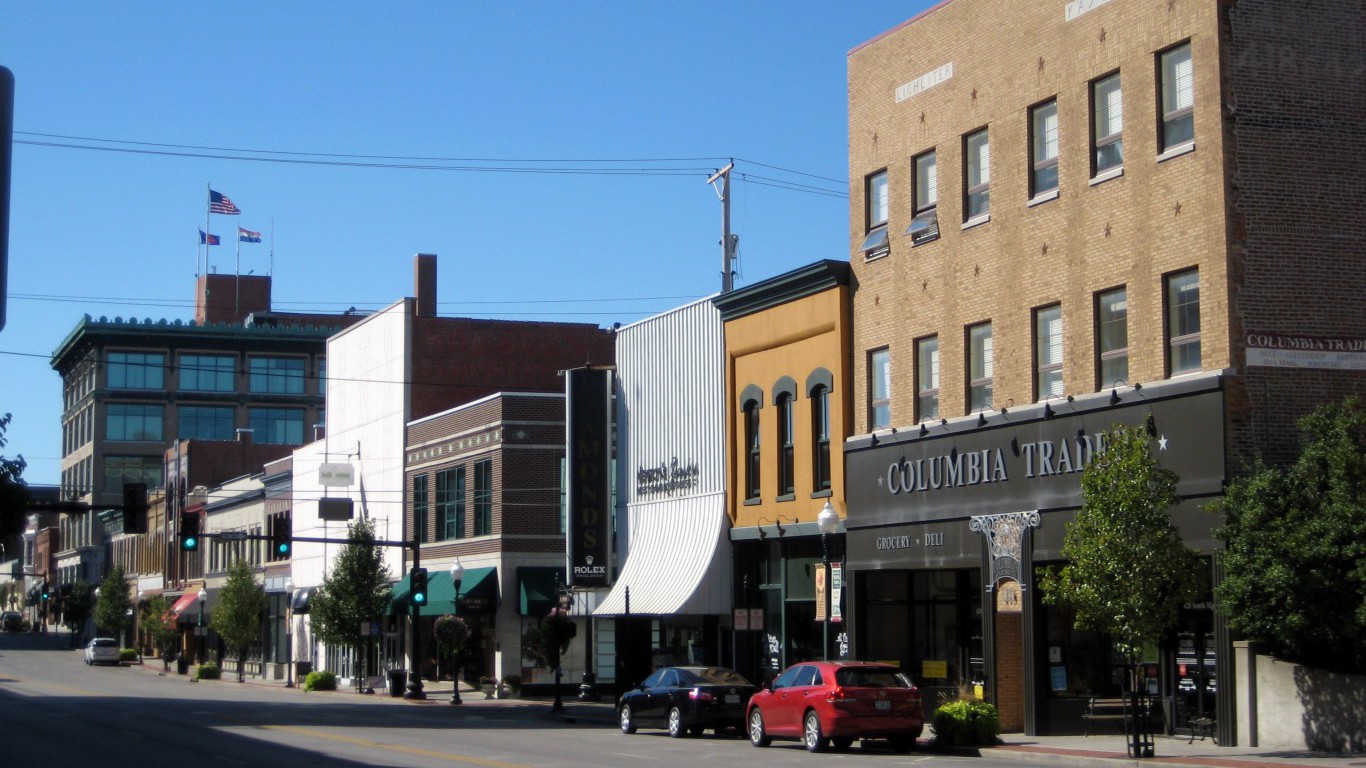
40. Missouri
> Vehicle operating cost: $2,553/yr.
> Avg. price of gas: $2.02 (7th lowest)
> Avg. insurance premium: $1,056/yr. (13th lowest)
> Avg. repair cost: $369 (8th lowest)
[in-text-ad]
39. Virginia
> Vehicle operating cost: $2,556/yr.
> Avg. price of gas: $2.03 (8th lowest)
> Avg. insurance premium: $1,020/yr. (9th lowest)
> Avg. repair cost: $409 (11th highest)
38. Nebraska
> Vehicle operating cost: $2,559/yr.
> Avg. price of gas: $2.22 (25th lowest)
> Avg. insurance premium: $1,188/yr. (tied-21st lowest)
> Avg. repair cost: $373 (12th lowest)
37. North Carolina
> Vehicle operating cost: $2,577/yr.
> Avg. price of gas: $2.10 (12th lowest)
> Avg. insurance premium: $987/yr. (7th lowest)
> Avg. repair cost: $395 (22nd highest)
[in-text-ad-2]

36. Hawaii
> Vehicle operating cost: $2,578/yr.
> Avg. price of gas: $3.03 (the highest)
> Avg. insurance premium: $1,049/yr. (11th lowest)
> Avg. repair cost: $404 (18th highest)

35. Indiana
> Vehicle operating cost: $2,594/yr.
> Avg. price of gas: $2.16 (17th lowest)
> Avg. insurance premium: $1,113/yr. (16th lowest)
> Avg. repair cost: $356 (2nd lowest)
[in-text-ad]

34. New York
> Vehicle operating cost: $2,690/yr.
> Avg. price of gas: $2.43 (10th highest)
> Avg. insurance premium: $1,050/yr. (12th lowest)
> Avg. repair cost: $389 (22nd lowest)
33. Tennessee
> Vehicle operating cost: $2,695/yr.
> Avg. price of gas: $2.01 (5th lowest)
> Avg. insurance premium: $1,145/yr. (18th lowest)
> Avg. repair cost: $385 (18th lowest)

32. Minnesota
> Vehicle operating cost: $2,703/yr.
> Avg. price of gas: $2.19 (tied-20th lowest)
> Avg. insurance premium: $1,257/yr. (25th lowest)
> Avg. repair cost: $385 (17th lowest)
[in-text-ad-2]
31. Alabama
> Vehicle operating cost: $2,707/yr.
> Avg. price of gas: $1.98 (3rd lowest)
> Avg. insurance premium: $1,337/yr. (19th highest)
> Avg. repair cost: $383 (16th lowest)
30. Arizona
> Vehicle operating cost: $2,709/yr.
> Avg. price of gas: $2.27 (19th highest)
> Avg. insurance premium: $1,188/yr. (tied-21st lowest)
> Avg. repair cost: $386 (19th lowest)
[in-text-ad]
29. Utah
> Vehicle operating cost: $2,739/yr.
> Avg. price of gas: $2.53 (8th highest)
> Avg. insurance premium: $1,061/yr. (14th lowest)
> Avg. repair cost: $408 (13th highest)
 24/7 Wall St.
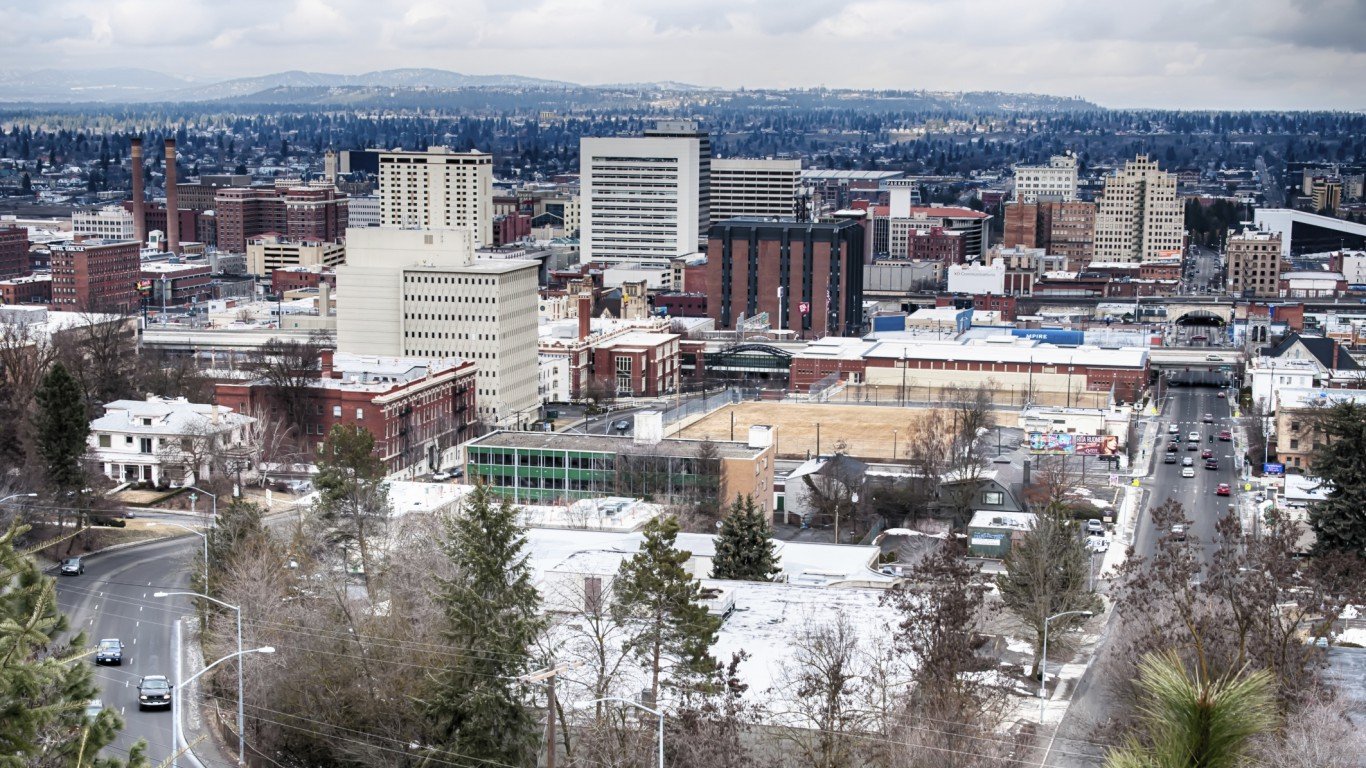
28. Washington
> Vehicle operating cost: $2,749/yr.
> Avg. price of gas: $2.82 (3rd highest)
> Avg. insurance premium: $1,168/yr. (tied-19th lowest)
> Avg. repair cost: $408 (14th highest)
27. Maine
> Vehicle operating cost: $2,751/yr.
> Avg. price of gas: $2.23 (25th highest)
> Avg. insurance premium: $808/yr. (the lowest)
> Avg. repair cost: $361 (6th lowest)
[in-text-ad-2]
26. North Dakota
> Vehicle operating cost: $2,776/yr.
> Avg. price of gas: $2.19 (19th lowest)
> Avg. insurance premium: $1,200/yr. (23rd lowest)
> Avg. repair cost: $419 (4th highest)
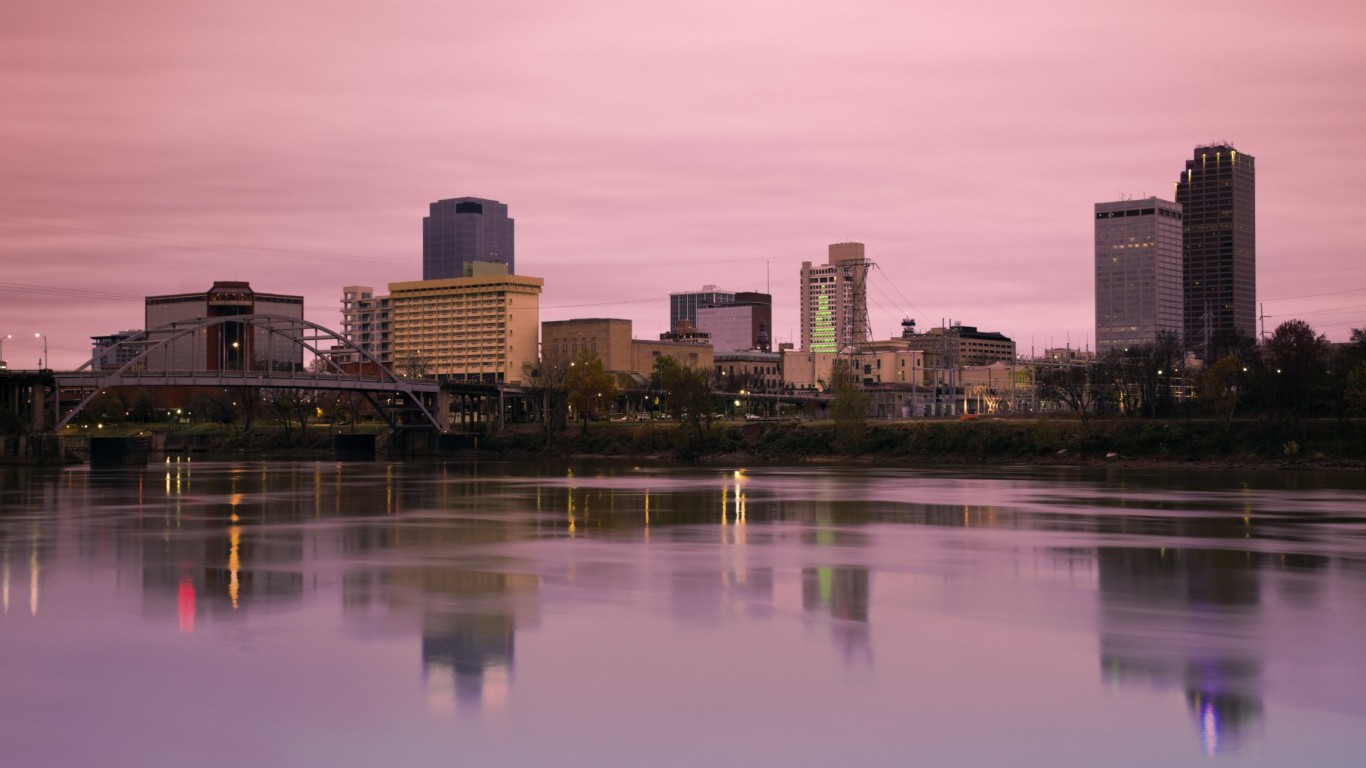
25. Arkansas
> Vehicle operating cost: $2,786/yr.
> Avg. price of gas: $2.01 (6th lowest)
> Avg. insurance premium: $1,345/yr. (18th highest)
> Avg. repair cost: $391 (25th highest)
[in-text-ad]
24. Kentucky
> Vehicle operating cost: $2,806/yr.
> Avg. price of gas: $2.13 (14th lowest)
> Avg. insurance premium: $1,295/yr. (22nd highest)
> Avg. repair cost: $390 (25th lowest)
23. Pennsylvania
> Vehicle operating cost: $2,817/yr.
> Avg. price of gas: $2.44 (9th highest)
> Avg. insurance premium: $1,305/yr. (21st highest)
> Avg. repair cost: $381 (tied-14th lowest)
22. Oregon
> Vehicle operating cost: $2,825/yr.
> Avg. price of gas: $2.68 (5th highest)
> Avg. insurance premium: $1,267/yr. (25th highest)
> Avg. repair cost: $404 (17th highest)
[in-text-ad-2]
21. Colorado
> Vehicle operating cost: $2,828/yr.
> Avg. price of gas: $2.25 (22nd highest)
> Avg. insurance premium: $1,393/yr. (15th highest)
> Avg. repair cost: $416 (8th highest)
20. New Mexico
> Vehicle operating cost: $2,839/yr.
> Avg. price of gas: $2.15 (16th lowest)
> Avg. insurance premium: $1,277/yr. (tied-23rd highest)
> Avg. repair cost: $405 (16th highest)
[in-text-ad]
19. Wyoming
> Vehicle operating cost: $2,874/yr.
> Avg. price of gas: $2.26 (21st highest)
> Avg. insurance premium: $1,421/yr. (14th highest)
> Avg. repair cost: $428 (2nd highest)
18. Nevada
> Vehicle operating cost: $2,953/yr.
> Avg. price of gas: $2.67 (6th highest)
> Avg. insurance premium: $1,221/yr. (24th lowest)
> Avg. repair cost: $400 (20th highest)

17. Massachusetts
> Vehicle operating cost: $2,984/yr.
> Avg. price of gas: $2.28 (18th highest)
> Avg. insurance premium: $1,325/yr. (20th highest)
> Avg. repair cost: $401 (19th highest)
[in-text-ad-2]

16. Rhode Island
> Vehicle operating cost: $3,026/yr.
> Avg. price of gas: $2.30 (15th highest)
> Avg. insurance premium: $1,608/yr. (9th highest)
> Avg. repair cost: $417 (6th highest)
15. South Carolina
> Vehicle operating cost: $3,032/yr.
> Avg. price of gas: $1.91 (the lowest)
> Avg. insurance premium: $1,353/yr. (17th highest)
> Avg. repair cost: $389 (23rd lowest)
[in-text-ad]
14. West Virginia
> Vehicle operating cost: $3,046/yr.
> Avg. price of gas: $2.27 (20th highest)
> Avg. insurance premium: $1,456/yr. (13th highest)
> Avg. repair cost: $374 (13th lowest)
 24/7 Wall St.
13. Connecticut
> Vehicle operating cost: $3,052/yr.
> Avg. price of gas: $2.43 (11th highest)
> Avg. insurance premium: $1,367/yr. (16th highest)
> Avg. repair cost: $416 (7th highest)
12. Delaware
> Vehicle operating cost: $3,058/yr.
> Avg. price of gas: $2.16 (18th lowest)
> Avg. insurance premium: $1,607/yr. (10th highest)
> Avg. repair cost: $398 (21st highest)
[in-text-ad-2]

11. Texas
> Vehicle operating cost: $3,197/yr.
> Avg. price of gas: $2.05 (10th lowest)
> Avg. insurance premium: $1,510/yr. (12th highest)
> Avg. repair cost: $386 (20th lowest)
10. Florida
> Vehicle operating cost: $3,237/yr.
> Avg. price of gas: $2.19 (tied-20th lowest)
> Avg. insurance premium: $1,654/yr. (7th highest)
> Avg. repair cost: $387 (21st lowest)
[in-text-ad]
9. Georgia
> Vehicle operating cost: $3,249/yr.
> Avg. price of gas: $2.10 (13th lowest)
> Avg. insurance premium: $1,559/yr. (11th highest)
> Avg. repair cost: $410 (10th highest)

8. Mississippi
> Vehicle operating cost: $3,296/yr.
> Avg. price of gas: $1.99 (4th lowest)
> Avg. insurance premium: $1,277/yr. (tied-23rd highest)
> Avg. repair cost: $391 (23rd highest)
7. Oklahoma
> Vehicle operating cost: $3,405/yr.
> Avg. price of gas: $1.92 (2nd lowest)
> Avg. insurance premium: $1,778/yr. (5th highest)
> Avg. repair cost: $370 (9th lowest)
[in-text-ad-2]
6. Louisiana
> Vehicle operating cost: $3,456/yr.
> Avg. price of gas: $2.06 (11th lowest)
> Avg. insurance premium: $1,842/yr. (4th highest)
> Avg. repair cost: $381 (tied-14th lowest)
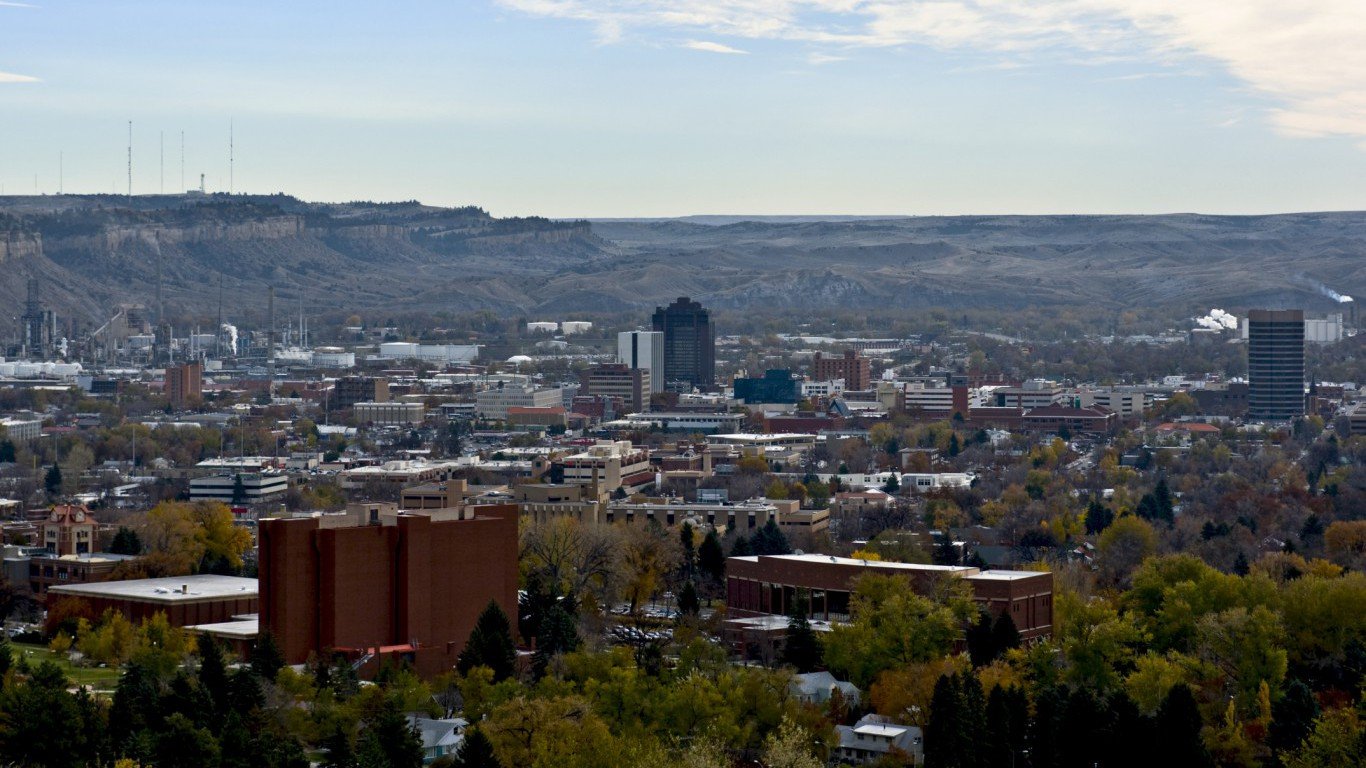
5. Montana
> Vehicle operating cost: $3,484/yr.
> Avg. price of gas: $2.35 (12th highest)
> Avg. insurance premium: $2,297/yr. (2nd highest)
> Avg. repair cost: $416 (9th highest)
[in-text-ad]
4. Maryland
> Vehicle operating cost: $3,553/yr.
> Avg. price of gas: $2.22 (24th lowest)
> Avg. insurance premium: $1,610/yr. (8th highest)
> Avg. repair cost: $419 (3rd highest)
3. California
> Vehicle operating cost: $3,706/yr.
> Avg. price of gas: $2.96 (2nd highest)
> Avg. insurance premium: $1,752/yr. (6th highest)
> Avg. repair cost: $435 (the highest)
2. New Jersey
> Vehicle operating cost: $3,911/yr.
> Avg. price of gas: $2.29 (16th highest)
> Avg. insurance premium: $1,905/yr. (3rd highest)
> Avg. repair cost: $419 (5th highest)
[in-text-ad-2]
1. Michigan
> Vehicle operating cost: $4,417/yr.
> Avg. price of gas: $2.34 (13th highest)
> Avg. insurance premium: $2,738/yr. (the highest)
> Avg. repair cost: $354 (the lowest)
Detailed Findings & Methodology:
The costs of insurance is the largest driving expense in 31 states. Insurance payments account for a majority of the overall cost of driving a car in eight states. Often, a high prevalence of car accidents tends to increase insurance premiums. Similarly, in states where drivers sue more often following an accident premiums are also mostly higher.
State requirements for what an insurance policy must cover can particularly increase the cost at the expensive end of the list. In 15 states, motorists must purchase personal injury protection as part of their auto insurance. This insurance will cover the medical bills of the policyholder as well as those of any vehicle occupants at the time of the accident.
Only Michigan — the most expensive state in which to drive — requires motorists to purchase a policy that covers unlimited, lifetime medical benefits. Solely for this reason, the cost to own and drive a car in Michigan is about $1,500 more than the average across all states, and $500 more than the second most expensive state.
In states where insurance premiums are relatively low, the cost of gas is the main expense for drivers. On average, American motorists spend about $1,210 on fuel each year. Because of different gas prices, gas taxes, and time spent on the road this expense can rise as high as $1,600 or drop to as low as $800 per year.
Although it is not an immediate expense, in states where motorists rack up more mileage than average the car resale value decreases faster. In the Northeast, because more people live in dense urban environments, commutes are often shorter, and motorists only drive roughly 10,000 to 12,000 miles annually. By contrast, in rural states like North Dakota, Mississippi, and Wyoming, mileage can reach 20,000 per driver per year.
In order to determine the most and least expensive states to drive, 24/7 Wall St. added the average annual costs of insurance, gasoline, and repair costs by state. The total cost of repair, provided by automobile software developer CarMD, represents the sum of the average amount paid for parts and labor by drivers for one check engine light repair. This was used as a proxy for annual repair costs.
Gas expenditure per car was calculated from average fuel consumption per registered motor vehicle, which came from the Federal Highway Administration (FHWA), and average gas price in the state as of June 27, 2017, which came from AAA. The average car insurance premium in each state came from Insure.com, an insurance review website. All data are as of the most recent period available.
The number of vehicles, vehicle registrations, miles driven, total gallons of fuel consumed, and total miles travelled in each state came from the FHWA and are for 2015. All commuting figures and urban and rural composition data came from the U.S. Census Bureau’s 2015 American Community Survey.
Sponsored: Find a Qualified Financial Advisor
Finding a qualified financial advisor doesn’t have to be hard. SmartAsset’s free tool matches you with up to 3 fiduciary financial advisors in your area in 5 minutes. Each advisor has been vetted by SmartAsset and is held to a fiduciary standard to act in your best interests. If you’re ready to be matched with local advisors that can help you achieve your financial goals, get started now.